
An official website of the United States government
An official website of the United States government
The .gov means it's official.
Federal government websites often end in .gov or .mil. Before sharing sensitive information,
make sure you're on a federal government site.
The site is secure.
The
https:// ensures that you are connecting to the official website and that any
information you provide is encrypted and transmitted securely.
Ensure the safe takeoff and landing of commercial and military aircraft. Duties include coordination between air-traffic control and maintenance personnel, dispatching, using airfield landing and navigational aids, implementing airfield safety procedures, monitoring and maintaining flight records, and applying knowledge of weather information.
Employment estimate and mean wage estimates for Airfield Operations Specialists:
| Employment (1) | Employment RSE (3) |
Mean hourly wage |
Mean annual wage (2) |
Wage RSE (3) |
|---|---|---|---|---|
| 12,610 | 2.9 % | $ 26.13 | $ 54,360 | 0.9 % |
Percentile wage estimates for Airfield Operations Specialists:
| Percentile | 10% | 25% | 50% (Median) |
75% | 90% |
|---|---|---|---|---|---|
| Hourly Wage | $ 14.79 | $ 18.26 | $ 23.02 | $ 30.46 | $ 39.38 |
| Annual Wage (2) | $ 30,770 | $ 37,990 | $ 47,880 | $ 63,350 | $ 81,910 |
Industries with the highest published employment and wages for Airfield Operations Specialists are provided. For a list of all industries with employment in Airfield Operations Specialists, see the Create Customized Tables function.
Industries with the highest levels of employment in Airfield Operations Specialists:
| Industry | Employment (1) | Percent of industry employment | Hourly mean wage | Annual mean wage (2) |
|---|---|---|---|---|
| Support Activities for Air Transportation | 4,290 | 2.20 | $ 21.51 | $ 44,740 |
| Local Government, excluding schools and hospitals (OEWS Designation) | 3,090 | 0.06 | $ 25.33 | $ 52,680 |
| Scheduled Air Transportation | 1,980 | 0.51 | $ 26.02 | $ 54,130 |
| Couriers and Express Delivery Services | 890 | 0.10 | $ 26.96 | $ 56,080 |
| Nonscheduled Air Transportation | 860 | 1.78 | $ 29.89 | $ 62,170 |
Industries with the highest concentration of employment in Airfield Operations Specialists:
| Industry | Employment (1) | Percent of industry employment | Hourly mean wage | Annual mean wage (2) |
|---|---|---|---|---|
| Support Activities for Air Transportation | 4,290 | 2.20 | $ 21.51 | $ 44,740 |
| Nonscheduled Air Transportation | 860 | 1.78 | $ 29.89 | $ 62,170 |
| Scheduled Air Transportation | 1,980 | 0.51 | $ 26.02 | $ 54,130 |
| Couriers and Express Delivery Services | 890 | 0.10 | $ 26.96 | $ 56,080 |
| Technical and Trade Schools | 80 | 0.06 | $ 17.66 | $ 36,740 |
Top paying industries for Airfield Operations Specialists:
| Industry | Employment (1) | Percent of industry employment | Hourly mean wage | Annual mean wage (2) |
|---|---|---|---|---|
| Management of Companies and Enterprises | (8) | (8) | $ 53.29 | $ 110,840 |
| State Government, excluding schools and hospitals (OEWS Designation) | 90 | (7) | $ 38.40 | $ 79,880 |
| Aerospace Product and Parts Manufacturing | 130 | 0.03 | $ 37.92 | $ 78,870 |
| Federal Executive Branch (OEWS Designation) | 310 | 0.01 | $ 32.06 | $ 66,690 |
| Nonscheduled Air Transportation | 860 | 1.78 | $ 29.89 | $ 62,170 |
States and areas with the highest published employment, location quotients, and wages for Airfield Operations Specialists are provided. For a list of all areas with employment in Airfield Operations Specialists, see the Create Customized Tables function.
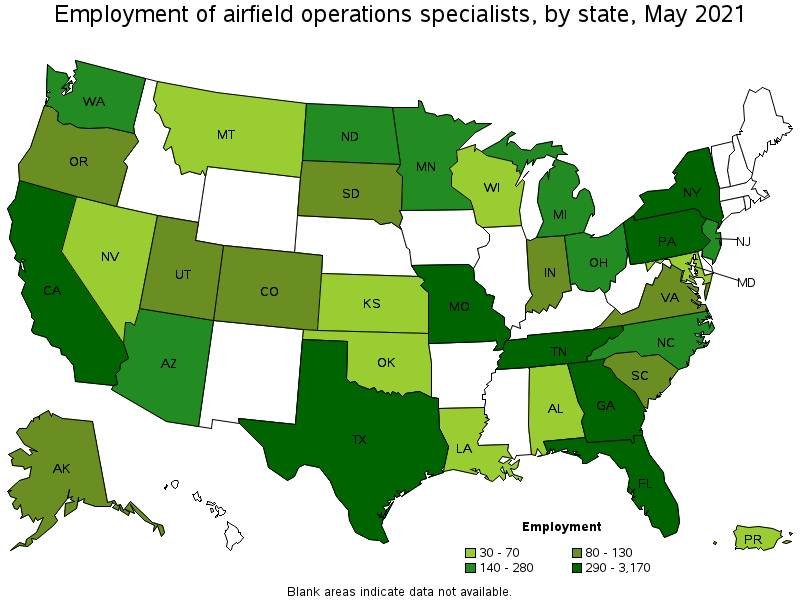
States with the highest employment level in Airfield Operations Specialists:
| State | Employment (1) | Employment per thousand jobs | Location quotient (9) | Hourly mean wage | Annual mean wage (2) |
|---|---|---|---|---|---|
| California | 3,170 | 0.19 | 2.14 | $ 22.36 | $ 46,500 |
| Texas | 1,220 | 0.10 | 1.12 | $ 37.14 | $ 77,260 |
| Florida | 1,070 | 0.12 | 1.39 | $ 21.30 | $ 44,310 |
| Tennessee | 700 | 0.23 | 2.61 | $ 23.63 | $ 49,150 |
| Missouri | 580 | 0.21 | 2.36 | $ 16.39 | $ 34,090 |
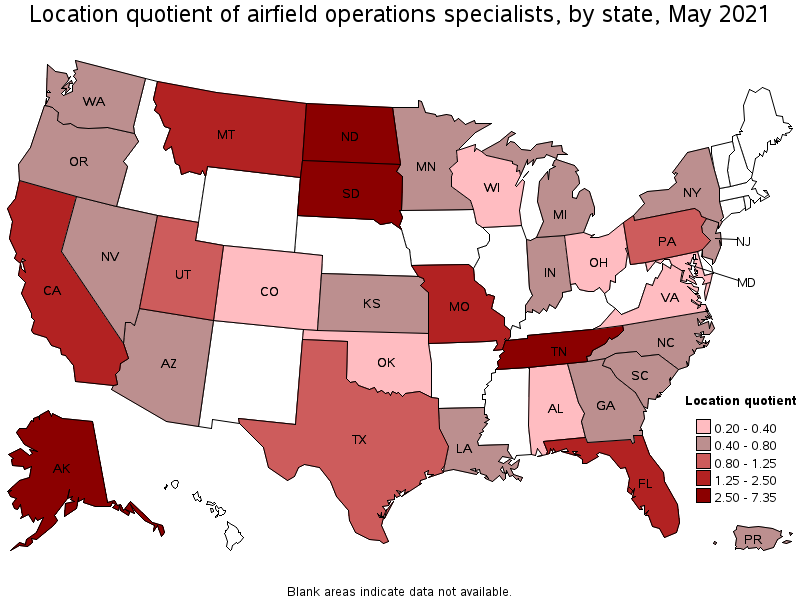
States with the highest concentration of jobs and location quotients in Airfield Operations Specialists:
| State | Employment (1) | Employment per thousand jobs | Location quotient (9) | Hourly mean wage | Annual mean wage (2) |
|---|---|---|---|---|---|
| North Dakota | 260 | 0.66 | 7.35 | $ 17.56 | $ 36,520 |
| Alaska | 130 | 0.45 | 5.01 | $ 31.31 | $ 65,130 |
| South Dakota | 100 | 0.24 | 2.66 | $ 17.47 | $ 36,340 |
| Tennessee | 700 | 0.23 | 2.61 | $ 23.63 | $ 49,150 |
| Missouri | 580 | 0.21 | 2.36 | $ 16.39 | $ 34,090 |
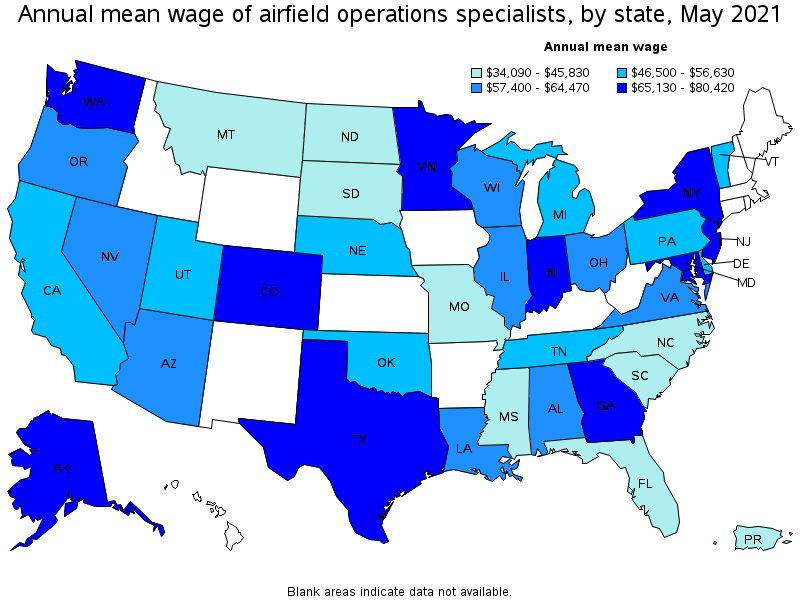
Top paying states for Airfield Operations Specialists:
| State | Employment (1) | Employment per thousand jobs | Location quotient (9) | Hourly mean wage | Annual mean wage (2) |
|---|---|---|---|---|---|
| Washington | 150 | 0.05 | 0.52 | $ 38.67 | $ 80,420 |
| Maryland | 70 | 0.03 | 0.29 | $ 38.26 | $ 79,590 |
| New Jersey | 250 | 0.07 | 0.73 | $ 37.61 | $ 78,220 |
| Texas | 1,220 | 0.10 | 1.12 | $ 37.14 | $ 77,260 |
| Georgia | 290 | 0.07 | 0.75 | $ 35.95 | $ 74,780 |
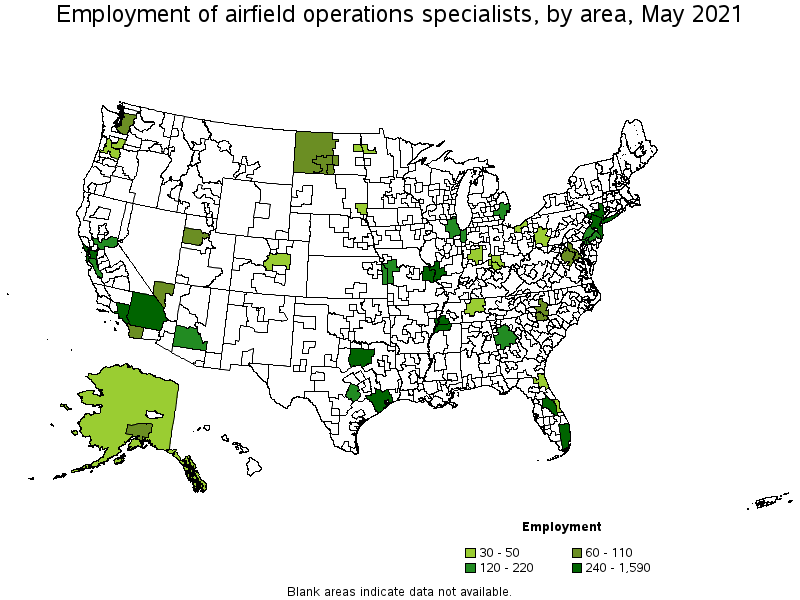
Metropolitan areas with the highest employment level in Airfield Operations Specialists:
| Metropolitan area | Employment (1) | Employment per thousand jobs | Location quotient (9) | Hourly mean wage | Annual mean wage (2) |
|---|---|---|---|---|---|
| Los Angeles-Long Beach-Anaheim, CA | 1,590 | 0.28 | 3.10 | (8) | (8) |
| Memphis, TN-MS-AR | 630 | 1.04 | 11.63 | $ 23.59 | $ 49,070 |
| New York-Newark-Jersey City, NY-NJ-PA | 590 | 0.07 | 0.77 | $ 36.15 | $ 75,190 |
| Riverside-San Bernardino-Ontario, CA | 540 | 0.35 | 3.93 | $ 17.51 | $ 36,430 |
| Dallas-Fort Worth-Arlington, TX | 490 | 0.14 | 1.52 | (8) | (8) |
| Miami-Fort Lauderdale-West Palm Beach, FL | 480 | 0.19 | 2.18 | $ 23.38 | $ 48,620 |
| San Francisco-Oakland-Hayward, CA | 470 | 0.21 | 2.36 | $ 25.85 | $ 53,760 |
| St. Louis, MO-IL | 320 | 0.25 | 2.80 | $ 17.17 | $ 35,720 |
| Houston-The Woodlands-Sugar Land, TX | 280 | 0.10 | 1.07 | $ 25.07 | $ 52,150 |
| Orlando-Kissimmee-Sanford, FL | 240 | 0.21 | 2.30 | $ 20.14 | $ 41,890 |
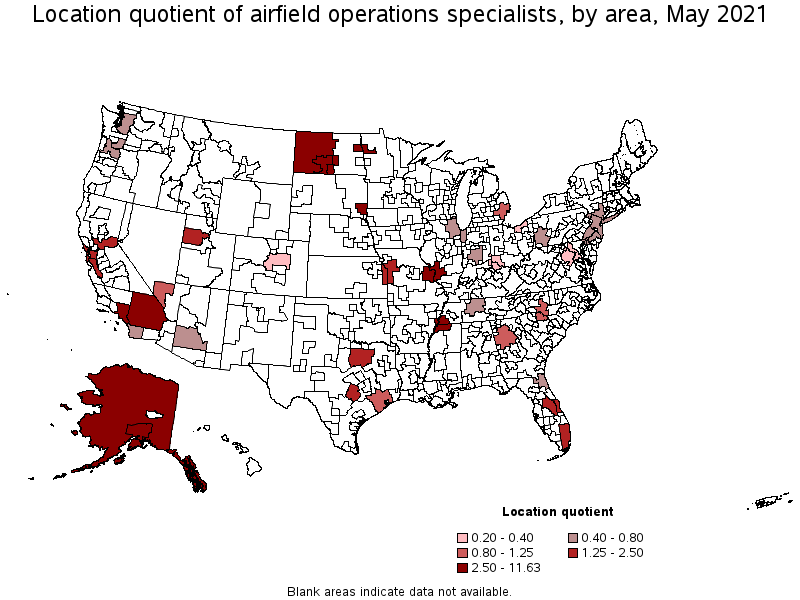
Metropolitan areas with the highest concentration of jobs and location quotients in Airfield Operations Specialists:
| Metropolitan area | Employment (1) | Employment per thousand jobs | Location quotient (9) | Hourly mean wage | Annual mean wage (2) |
|---|---|---|---|---|---|
| Memphis, TN-MS-AR | 630 | 1.04 | 11.63 | $ 23.59 | $ 49,070 |
| Grand Forks, ND-MN | 50 | 0.96 | 10.75 | $ 16.06 | $ 33,400 |
| Bismarck, ND | 60 | 0.91 | 10.21 | $ 16.55 | $ 34,420 |
| Anchorage, AK | 70 | 0.44 | 4.90 | $ 28.11 | $ 58,480 |
| Riverside-San Bernardino-Ontario, CA | 540 | 0.35 | 3.93 | $ 17.51 | $ 36,430 |
| Sioux Falls, SD | 50 | 0.32 | 3.56 | $ 16.40 | $ 34,120 |
| Los Angeles-Long Beach-Anaheim, CA | 1,590 | 0.28 | 3.10 | (8) | (8) |
| St. Louis, MO-IL | 320 | 0.25 | 2.80 | $ 17.17 | $ 35,720 |
| San Francisco-Oakland-Hayward, CA | 470 | 0.21 | 2.36 | $ 25.85 | $ 53,760 |
| Orlando-Kissimmee-Sanford, FL | 240 | 0.21 | 2.30 | $ 20.14 | $ 41,890 |
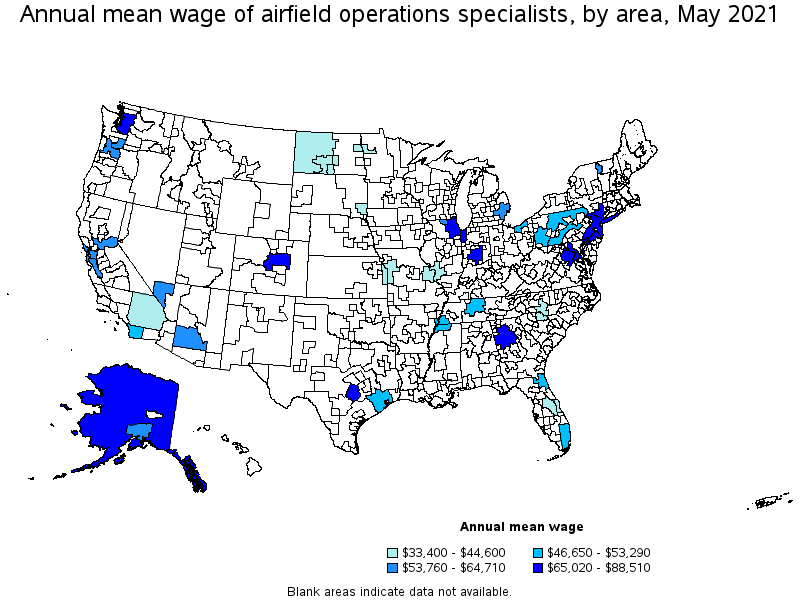
Top paying metropolitan areas for Airfield Operations Specialists:
| Metropolitan area | Employment (1) | Employment per thousand jobs | Location quotient (9) | Hourly mean wage | Annual mean wage (2) |
|---|---|---|---|---|---|
| Austin-Round Rock, TX | 160 | 0.15 | 1.63 | $ 42.55 | $ 88,510 |
| Atlanta-Sandy Springs-Roswell, GA | 220 | 0.09 | 0.95 | $ 38.57 | $ 80,230 |
| Seattle-Tacoma-Bellevue, WA | 110 | 0.06 | 0.67 | $ 38.09 | $ 79,230 |
| New York-Newark-Jersey City, NY-NJ-PA | 590 | 0.07 | 0.77 | $ 36.15 | $ 75,190 |
| Denver-Aurora-Lakewood, CO | 50 | 0.03 | 0.38 | $ 35.98 | $ 74,830 |
| Indianapolis-Carmel-Anderson, IN | 50 | 0.05 | 0.52 | $ 35.92 | $ 74,700 |
| Chicago-Naperville-Elgin, IL-IN-WI | 200 | 0.05 | 0.54 | $ 32.64 | $ 67,890 |
| Washington-Arlington-Alexandria, DC-VA-MD-WV | 80 | 0.03 | 0.29 | $ 31.83 | $ 66,200 |
| Philadelphia-Camden-Wilmington, PA-NJ-DE-MD | 170 | 0.06 | 0.71 | $ 31.26 | $ 65,020 |
| Phoenix-Mesa-Scottsdale, AZ | 120 | 0.06 | 0.66 | $ 31.11 | $ 64,710 |
Nonmetropolitan areas with the highest employment in Airfield Operations Specialists:
| Nonmetropolitan area | Employment (1) | Employment per thousand jobs | Location quotient (9) | Hourly mean wage | Annual mean wage (2) |
|---|---|---|---|---|---|
| West North Dakota nonmetropolitan area | 70 | 0.65 | 7.29 | $ 20.97 | $ 43,620 |
| Alaska nonmetropolitan area | 50 | 0.50 | 5.59 | $ 35.94 | $ 74,760 |
Nonmetropolitan areas with the highest concentration of jobs and location quotients in Airfield Operations Specialists:
| Nonmetropolitan area | Employment (1) | Employment per thousand jobs | Location quotient (9) | Hourly mean wage | Annual mean wage (2) |
|---|---|---|---|---|---|
| West North Dakota nonmetropolitan area | 70 | 0.65 | 7.29 | $ 20.97 | $ 43,620 |
| Alaska nonmetropolitan area | 50 | 0.50 | 5.59 | $ 35.94 | $ 74,760 |
Top paying nonmetropolitan areas for Airfield Operations Specialists:
| Nonmetropolitan area | Employment (1) | Employment per thousand jobs | Location quotient (9) | Hourly mean wage | Annual mean wage (2) |
|---|---|---|---|---|---|
| Alaska nonmetropolitan area | 50 | 0.50 | 5.59 | $ 35.94 | $ 74,760 |
| Northern Pennsylvania nonmetropolitan area | (8) | (8) | (8) | $ 24.27 | $ 50,490 |
| Southern Pennsylvania nonmetropolitan area | (8) | (8) | (8) | $ 23.39 | $ 48,650 |
| West North Dakota nonmetropolitan area | 70 | 0.65 | 7.29 | $ 20.97 | $ 43,620 |
These estimates are calculated with data collected from employers in all industry sectors, all metropolitan and nonmetropolitan areas, and all states and the District of Columbia. The top employment and wage figures are provided above. The complete list is available in the downloadable XLS files.
The percentile wage estimate is the value of a wage below which a certain percent of workers fall. The median wage is the 50th percentile wage estimate—50 percent of workers earn less than the median and 50 percent of workers earn more than the median. More about percentile wages.
(1) Estimates for detailed occupations do not sum to the totals because the totals include occupations not shown separately. Estimates do not include self-employed workers.
(2) Annual wages have been calculated by multiplying the hourly mean wage by a "year-round, full-time" hours figure of 2,080 hours; for those occupations where there is not an hourly wage published, the annual wage has been directly calculated from the reported survey data.
(3) The relative standard error (RSE) is a measure of the reliability of a survey statistic. The smaller the relative standard error, the more precise the estimate.
(7) The value is less than .005 percent of industry employment.
(8) Estimate not released.
(9) The location quotient is the ratio of the area concentration of occupational employment to the national average concentration. A location quotient greater than one indicates the occupation has a higher share of employment than average, and a location quotient less than one indicates the occupation is less prevalent in the area than average.
Other OEWS estimates and related information:
May 2021 National Occupational Employment and Wage Estimates
May 2021 State Occupational Employment and Wage Estimates
May 2021 Metropolitan and Nonmetropolitan Area Occupational Employment and Wage Estimates
May 2021 National Industry-Specific Occupational Employment and Wage Estimates
Last Modified Date: March 31, 2022