
An official website of the United States government
An official website of the United States government
The .gov means it's official.
Federal government websites often end in .gov or .mil. Before sharing sensitive information,
make sure you're on a federal government site.
The site is secure.
The
https:// ensures that you are connecting to the official website and that any
information you provide is encrypted and transmitted securely.
Drive a school bus to transport students. Ensure adherence to safety rules. May assist students in boarding or exiting.
Employment estimate and mean wage estimates for Bus Drivers, School:
| Employment (1) | Employment RSE (3) |
Mean hourly wage |
Mean annual wage (2) |
Wage RSE (3) |
|---|---|---|---|---|
| 361,420 | 1.2 % | $ 18.63 | $ 38,750 | 0.7 % |
Percentile wage estimates for Bus Drivers, School:
| Percentile | 10% | 25% | 50% (Median) |
75% | 90% |
|---|---|---|---|---|---|
| Hourly Wage | $ 9.55 | $ 14.18 | $ 18.23 | $ 22.84 | $ 26.05 |
| Annual Wage (2) | $ 19,860 | $ 29,490 | $ 37,910 | $ 47,520 | $ 54,190 |
Industries with the highest published employment and wages for Bus Drivers, School are provided. For a list of all industries with employment in Bus Drivers, School, see the Create Customized Tables function.
Industries with the highest levels of employment in Bus Drivers, School:
| Industry | Employment (1) | Percent of industry employment | Hourly mean wage | Annual mean wage (2) |
|---|---|---|---|---|
| Elementary and Secondary Schools | 190,560 | 2.36 | $ 17.36 | $ 36,110 |
| School and Employee Bus Transportation | 115,680 | 64.92 | $ 20.73 | $ 43,110 |
| Local Government, excluding schools and hospitals (OEWS Designation) | 37,530 | 0.70 | $ 19.60 | $ 40,770 |
| Other Transit and Ground Passenger Transportation | 6,250 | 7.39 | $ 17.30 | $ 35,980 |
| Child Day Care Services | 4,060 | 0.51 | $ 14.79 | $ 30,760 |
Industries with the highest concentration of employment in Bus Drivers, School:
| Industry | Employment (1) | Percent of industry employment | Hourly mean wage | Annual mean wage (2) |
|---|---|---|---|---|
| School and Employee Bus Transportation | 115,680 | 64.92 | $ 20.73 | $ 43,110 |
| Other Transit and Ground Passenger Transportation | 6,250 | 7.39 | $ 17.30 | $ 35,980 |
| Charter Bus Industry | 400 | 2.66 | $ 20.45 | $ 42,530 |
| Elementary and Secondary Schools | 190,560 | 2.36 | $ 17.36 | $ 36,110 |
| Urban Transit Systems | 640 | 1.64 | $ 19.47 | $ 40,500 |
Top paying industries for Bus Drivers, School:
| Industry | Employment (1) | Percent of industry employment | Hourly mean wage | Annual mean wage (2) |
|---|---|---|---|---|
| State Government, excluding schools and hospitals (OEWS Designation) | 60 | (7) | $ 22.79 | $ 47,410 |
| School and Employee Bus Transportation | 115,680 | 64.92 | $ 20.73 | $ 43,110 |
| Charter Bus Industry | 400 | 2.66 | $ 20.45 | $ 42,530 |
| Other Schools and Instruction | 140 | 0.04 | $ 20.33 | $ 42,290 |
| Interurban and Rural Bus Transportation | 180 | 1.47 | $ 19.81 | $ 41,200 |
States and areas with the highest published employment, location quotients, and wages for Bus Drivers, School are provided. For a list of all areas with employment in Bus Drivers, School, see the Create Customized Tables function.
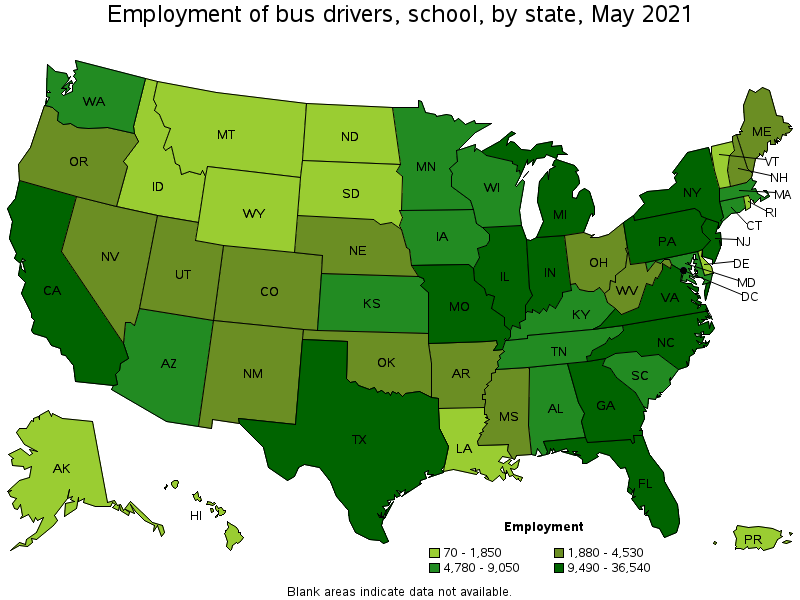
States with the highest employment level in Bus Drivers, School:
| State | Employment (1) | Employment per thousand jobs | Location quotient (9) | Hourly mean wage | Annual mean wage (2) |
|---|---|---|---|---|---|
| New York | 36,540 | 4.22 | 1.64 | $ 23.88 | $ 49,670 |
| Texas | 27,580 | 2.26 | 0.88 | $ 15.76 | $ 32,780 |
| Pennsylvania | 22,460 | 4.02 | 1.57 | $ 19.47 | $ 40,490 |
| Georgia | 19,050 | 4.35 | 1.70 | $ 13.81 | $ 28,730 |
| Florida | 14,520 | 1.69 | 0.66 | $ 15.85 | $ 32,970 |
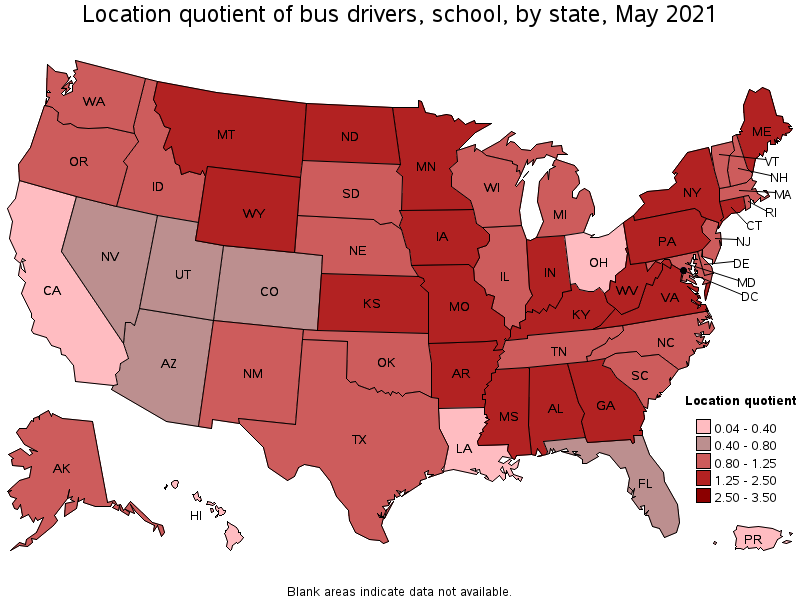
States with the highest concentration of jobs and location quotients in Bus Drivers, School:
| State | Employment (1) | Employment per thousand jobs | Location quotient (9) | Hourly mean wage | Annual mean wage (2) |
|---|---|---|---|---|---|
| Wyoming | 1,440 | 5.53 | 2.15 | $ 18.69 | $ 38,880 |
| West Virginia | 3,370 | 5.12 | 2.00 | $ 14.28 | $ 29,700 |
| Connecticut | 7,410 | 4.71 | 1.84 | $ 20.92 | $ 43,510 |
| Kansas | 6,030 | 4.50 | 1.75 | $ 18.46 | $ 38,390 |
| Georgia | 19,050 | 4.35 | 1.70 | $ 13.81 | $ 28,730 |
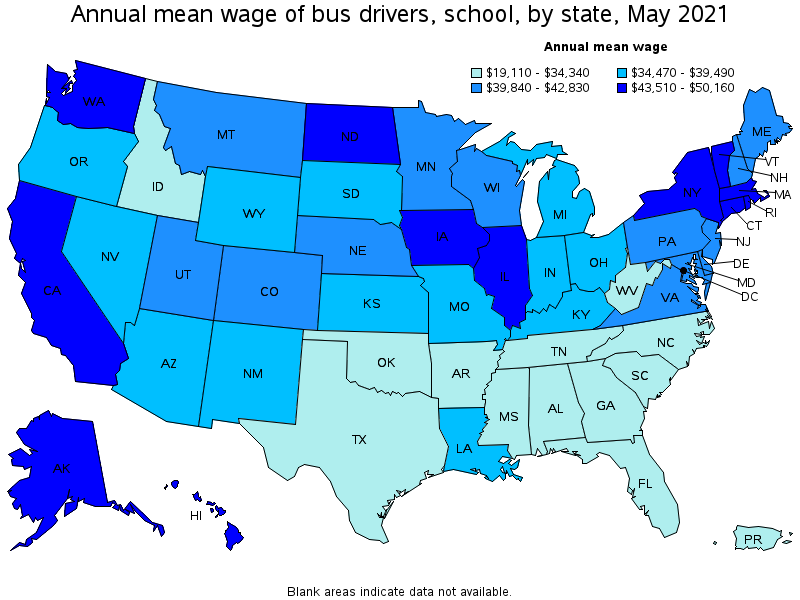
Top paying states for Bus Drivers, School:
| State | Employment (1) | Employment per thousand jobs | Location quotient (9) | Hourly mean wage | Annual mean wage (2) |
|---|---|---|---|---|---|
| Washington | 8,350 | 2.60 | 1.02 | $ 24.12 | $ 50,160 |
| New York | 36,540 | 4.22 | 1.64 | $ 23.88 | $ 49,670 |
| North Dakota | 1,570 | 3.97 | 1.55 | $ 23.62 | $ 49,130 |
| Hawaii | 520 | 0.95 | 0.37 | $ 23.06 | $ 47,950 |
| Rhode Island | 1,320 | 2.88 | 1.12 | $ 22.65 | $ 47,110 |
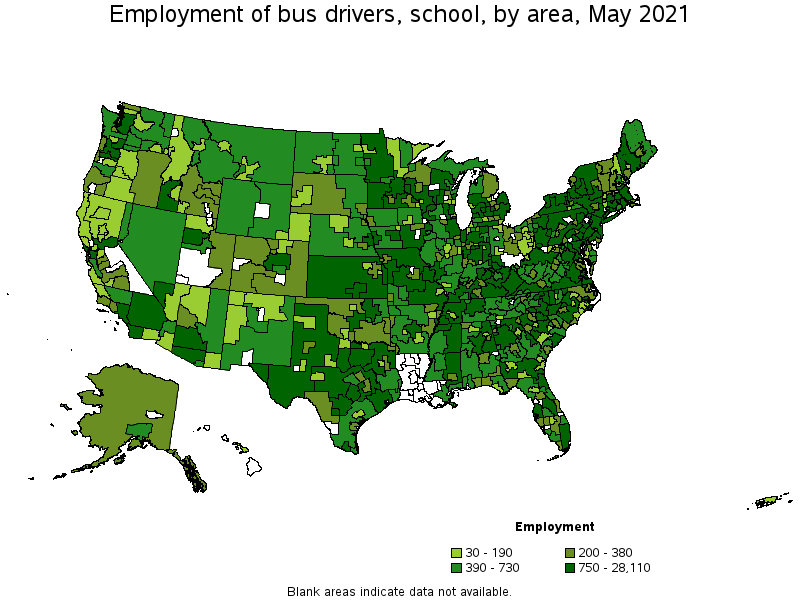
Metropolitan areas with the highest employment level in Bus Drivers, School:
| Metropolitan area | Employment (1) | Employment per thousand jobs | Location quotient (9) | Hourly mean wage | Annual mean wage (2) |
|---|---|---|---|---|---|
| New York-Newark-Jersey City, NY-NJ-PA | 28,110 | 3.24 | 1.26 | $ 24.80 | $ 51,580 |
| Atlanta-Sandy Springs-Roswell, GA | 11,770 | 4.55 | 1.77 | $ 15.10 | $ 31,410 |
| Chicago-Naperville-Elgin, IL-IN-WI | 8,960 | 2.12 | 0.83 | $ 21.53 | $ 44,790 |
| Philadelphia-Camden-Wilmington, PA-NJ-DE-MD | 7,930 | 2.99 | 1.16 | $ 20.64 | $ 42,940 |
| Washington-Arlington-Alexandria, DC-VA-MD-WV | 7,140 | 2.44 | 0.95 | $ 23.20 | $ 48,260 |
| Dallas-Fort Worth-Arlington, TX | 7,100 | 1.98 | 0.77 | $ 17.00 | $ 35,360 |
| Houston-The Woodlands-Sugar Land, TX | 6,630 | 2.29 | 0.89 | $ 15.69 | $ 32,630 |
| Pittsburgh, PA | 5,030 | 4.82 | 1.88 | $ 20.20 | $ 42,020 |
| Minneapolis-St. Paul-Bloomington, MN-WI | 4,830 | 2.65 | 1.03 | $ 20.54 | $ 42,710 |
| Boston-Cambridge-Nashua, MA-NH | 4,820 | 1.86 | 0.73 | $ 21.55 | $ 44,830 |
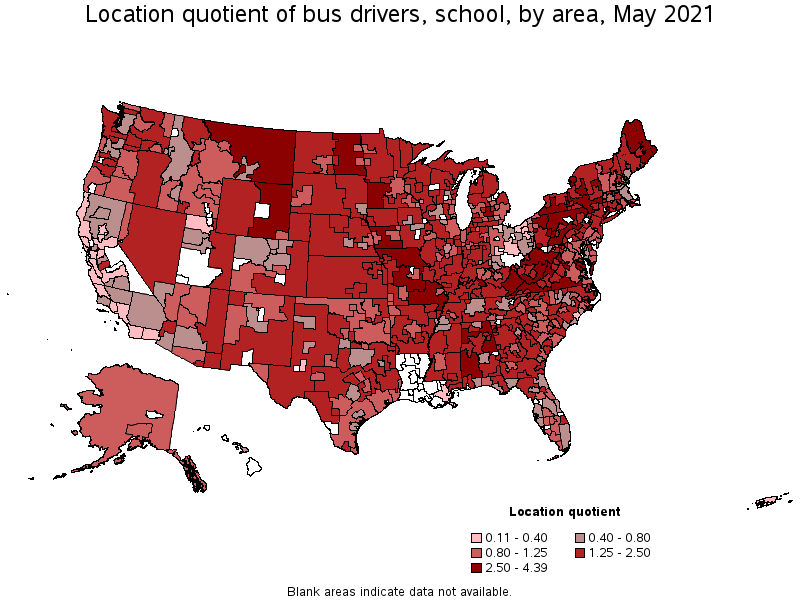
Metropolitan areas with the highest concentration of jobs and location quotients in Bus Drivers, School:
| Metropolitan area | Employment (1) | Employment per thousand jobs | Location quotient (9) | Hourly mean wage | Annual mean wage (2) |
|---|---|---|---|---|---|
| Johnstown, PA | 540 | 11.27 | 4.39 | $ 16.78 | $ 34,900 |
| Utica-Rome, NY | 980 | 8.51 | 3.32 | $ 19.88 | $ 41,360 |
| Lansing-East Lansing, MI | 1,470 | 7.48 | 2.92 | $ 18.77 | $ 39,040 |
| Watertown-Fort Drum, NY | 250 | 6.73 | 2.62 | $ 20.77 | $ 43,210 |
| Elizabethtown-Fort Knox, KY | 350 | 6.72 | 2.62 | $ 17.39 | $ 36,180 |
| Rome, GA | 260 | 6.62 | 2.58 | $ 11.13 | $ 23,150 |
| Glens Falls, NY | 310 | 6.44 | 2.51 | $ 19.37 | $ 40,280 |
| Waterbury, CT | 410 | 6.44 | 2.51 | $ 19.83 | $ 41,250 |
| Bloomsburg-Berwick, PA | 250 | 6.22 | 2.43 | $ 15.20 | $ 31,610 |
| Rochester, NY | 2,870 | 6.10 | 2.38 | $ 20.96 | $ 43,590 |
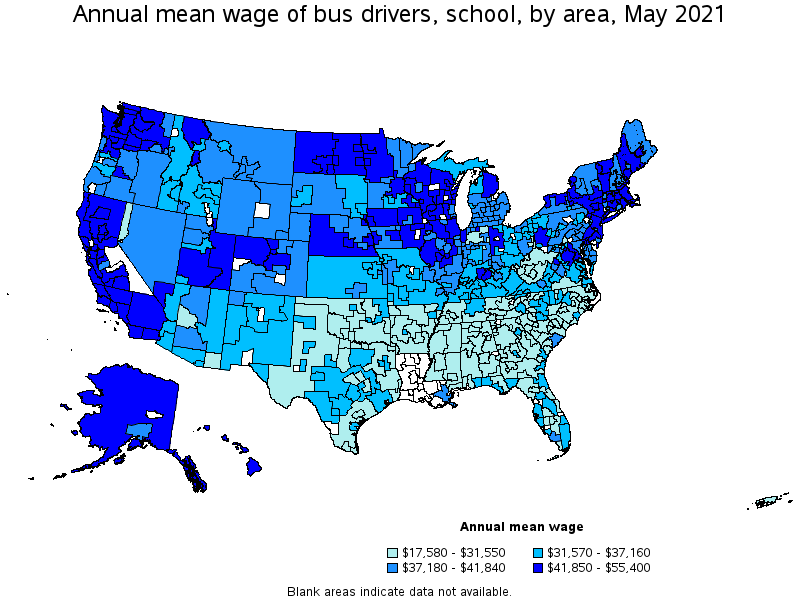
Top paying metropolitan areas for Bus Drivers, School:
| Metropolitan area | Employment (1) | Employment per thousand jobs | Location quotient (9) | Hourly mean wage | Annual mean wage (2) |
|---|---|---|---|---|---|
| Elkhart-Goshen, IN | 280 | 2.09 | 0.81 | $ 26.64 | $ 55,400 |
| Kahului-Wailuku-Lahaina, HI | 90 | 1.39 | 0.54 | $ 26.51 | $ 55,150 |
| Bremerton-Silverdale, WA | 270 | 3.12 | 1.22 | $ 25.85 | $ 53,770 |
| Seattle-Tacoma-Bellevue, WA | 3,880 | 2.02 | 0.79 | $ 25.81 | $ 53,680 |
| Mount Vernon-Anacortes, WA | 160 | 3.34 | 1.30 | $ 25.19 | $ 52,400 |
| Santa Rosa, CA | 170 | 0.86 | 0.34 | $ 24.88 | $ 51,750 |
| San Francisco-Oakland-Hayward, CA | 1,490 | 0.66 | 0.26 | $ 24.85 | $ 51,680 |
| Salinas, CA | 110 | 0.64 | 0.25 | $ 24.83 | $ 51,650 |
| San Jose-Sunnyvale-Santa Clara, CA | 510 | 0.48 | 0.19 | $ 24.81 | $ 51,600 |
| New York-Newark-Jersey City, NY-NJ-PA | 28,110 | 3.24 | 1.26 | $ 24.80 | $ 51,580 |
Nonmetropolitan areas with the highest employment in Bus Drivers, School:
| Nonmetropolitan area | Employment (1) | Employment per thousand jobs | Location quotient (9) | Hourly mean wage | Annual mean wage (2) |
|---|---|---|---|---|---|
| Kansas nonmetropolitan area | 1,910 | 5.07 | 1.98 | $ 15.24 | $ 31,710 |
| Central Missouri nonmetropolitan area | 1,380 | 8.98 | 3.50 | $ 17.39 | $ 36,160 |
| Balance of Lower Peninsula of Michigan nonmetropolitan area | 1,310 | 5.20 | 2.03 | $ 18.16 | $ 37,780 |
| Southwest New York nonmetropolitan area | 1,190 | 7.12 | 2.77 | $ 18.79 | $ 39,080 |
| Northeast Alabama nonmetropolitan area | 1,190 | 8.35 | 3.26 | $ 8.92 | $ 18,560 |
Nonmetropolitan areas with the highest concentration of jobs and location quotients in Bus Drivers, School:
| Nonmetropolitan area | Employment (1) | Employment per thousand jobs | Location quotient (9) | Hourly mean wage | Annual mean wage (2) |
|---|---|---|---|---|---|
| Northwest Alabama nonmetropolitan area | 640 | 9.91 | 3.86 | $ 8.62 | $ 17,930 |
| Central Missouri nonmetropolitan area | 1,380 | 8.98 | 3.50 | $ 17.39 | $ 36,160 |
| East Kentucky nonmetropolitan area | 820 | 8.63 | 3.36 | $ 16.81 | $ 34,960 |
| Southwest Iowa nonmetropolitan area | 680 | 8.55 | 3.33 | $ 19.57 | $ 40,710 |
| Northeast Alabama nonmetropolitan area | 1,190 | 8.35 | 3.26 | $ 8.92 | $ 18,560 |
Top paying nonmetropolitan areas for Bus Drivers, School:
| Nonmetropolitan area | Employment (1) | Employment per thousand jobs | Location quotient (9) | Hourly mean wage | Annual mean wage (2) |
|---|---|---|---|---|---|
| South Central Wisconsin nonmetropolitan area | 950 | 4.75 | 1.85 | $ 25.18 | $ 52,380 |
| West North Dakota nonmetropolitan area | 510 | 4.82 | 1.88 | $ 24.48 | $ 50,910 |
| Southern Vermont nonmetropolitan area | 300 | 3.17 | 1.23 | $ 23.90 | $ 49,710 |
| East North Dakota nonmetropolitan area | 500 | 8.19 | 3.19 | $ 23.60 | $ 49,080 |
| Central Utah nonmetropolitan area | (8) | (8) | (8) | $ 23.53 | $ 48,950 |
These estimates are calculated with data collected from employers in all industry sectors, all metropolitan and nonmetropolitan areas, and all states and the District of Columbia. The top employment and wage figures are provided above. The complete list is available in the downloadable XLS files.
The percentile wage estimate is the value of a wage below which a certain percent of workers fall. The median wage is the 50th percentile wage estimate—50 percent of workers earn less than the median and 50 percent of workers earn more than the median. More about percentile wages.
(1) Estimates for detailed occupations do not sum to the totals because the totals include occupations not shown separately. Estimates do not include self-employed workers.
(2) Annual wages have been calculated by multiplying the hourly mean wage by a "year-round, full-time" hours figure of 2,080 hours; for those occupations where there is not an hourly wage published, the annual wage has been directly calculated from the reported survey data.
(3) The relative standard error (RSE) is a measure of the reliability of a survey statistic. The smaller the relative standard error, the more precise the estimate.
(7) The value is less than .005 percent of industry employment.
(8) Estimate not released.
(9) The location quotient is the ratio of the area concentration of occupational employment to the national average concentration. A location quotient greater than one indicates the occupation has a higher share of employment than average, and a location quotient less than one indicates the occupation is less prevalent in the area than average.
Other OEWS estimates and related information:
May 2021 National Occupational Employment and Wage Estimates
May 2021 State Occupational Employment and Wage Estimates
May 2021 Metropolitan and Nonmetropolitan Area Occupational Employment and Wage Estimates
May 2021 National Industry-Specific Occupational Employment and Wage Estimates
Last Modified Date: March 31, 2022