
An official website of the United States government
An official website of the United States government
The .gov means it's official.
Federal government websites often end in .gov or .mil. Before sharing sensitive information,
make sure you're on a federal government site.
The site is secure.
The
https:// ensures that you are connecting to the official website and that any
information you provide is encrypted and transmitted securely.
Drive bus or motor coach, including regular route operations, charters, and private carriage. May assist passengers with baggage. May collect fares or tickets.
Employment estimate and mean wage estimates for Bus Drivers, Transit and Intercity:
| Employment (1) | Employment RSE (3) |
Mean hourly wage |
Mean annual wage (2) |
Wage RSE (3) |
|---|---|---|---|---|
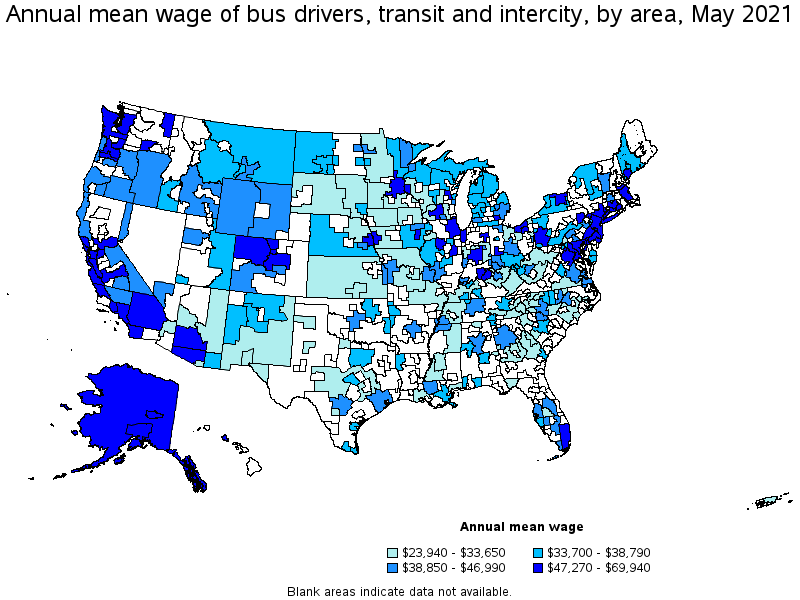
| 145,720 | 1.2 % | $ 24.67 | $ 51,310 | 0.4 % |
Percentile wage estimates for Bus Drivers, Transit and Intercity:
| Percentile | 10% | 25% | 50% (Median) |
75% | 90% |
|---|---|---|---|---|---|
| Hourly Wage | $ 14.56 | $ 18.31 | $ 23.37 | $ 30.00 | $ 37.33 |
| Annual Wage (2) | $ 30,290 | $ 38,080 | $ 48,620 | $ 62,400 | $ 77,640 |
Industries with the highest published employment and wages for Bus Drivers, Transit and Intercity are provided. For a list of all industries with employment in Bus Drivers, Transit and Intercity, see the Create Customized Tables function.
Industries with the highest levels of employment in Bus Drivers, Transit and Intercity:
| Industry | Employment (1) | Percent of industry employment | Hourly mean wage | Annual mean wage (2) |
|---|---|---|---|---|
| Local Government, excluding schools and hospitals (OEWS Designation) | 83,610 | 1.56 | $ 27.25 | $ 56,680 |
| Urban Transit Systems | 20,840 | 53.38 | $ 22.21 | $ 46,190 |
| Charter Bus Industry | 7,860 | 52.81 | $ 19.00 | $ 39,520 |
| Other Transit and Ground Passenger Transportation | 6,910 | 8.17 | $ 18.57 | $ 38,620 |
| State Government, excluding schools and hospitals (OEWS Designation) | 6,670 | 0.30 | $ 30.39 | $ 63,200 |
Industries with the highest concentration of employment in Bus Drivers, Transit and Intercity:
| Industry | Employment (1) | Percent of industry employment | Hourly mean wage | Annual mean wage (2) |
|---|---|---|---|---|
| Urban Transit Systems | 20,840 | 53.38 | $ 22.21 | $ 46,190 |
| Charter Bus Industry | 7,860 | 52.81 | $ 19.00 | $ 39,520 |
| Interurban and Rural Bus Transportation | 6,160 | 49.52 | $ 21.65 | $ 45,040 |
| Scenic and Sightseeing Transportation, Land | 1,520 | 21.88 | $ 18.16 | $ 37,760 |
| Other Transit and Ground Passenger Transportation | 6,910 | 8.17 | $ 18.57 | $ 38,620 |
Top paying industries for Bus Drivers, Transit and Intercity:
| Industry | Employment (1) | Percent of industry employment | Hourly mean wage | Annual mean wage (2) |
|---|---|---|---|---|
| Performing Arts Companies | 110 | 0.16 | $ 32.91 | $ 68,440 |
| State Government, excluding schools and hospitals (OEWS Designation) | 6,670 | 0.30 | $ 30.39 | $ 63,200 |
| Local Government, excluding schools and hospitals (OEWS Designation) | 83,610 | 1.56 | $ 27.25 | $ 56,680 |
| Facilities Support Services | 360 | 0.22 | $ 23.33 | $ 48,530 |
| Urban Transit Systems | 20,840 | 53.38 | $ 22.21 | $ 46,190 |
States and areas with the highest published employment, location quotients, and wages for Bus Drivers, Transit and Intercity are provided. For a list of all areas with employment in Bus Drivers, Transit and Intercity, see the Create Customized Tables function.
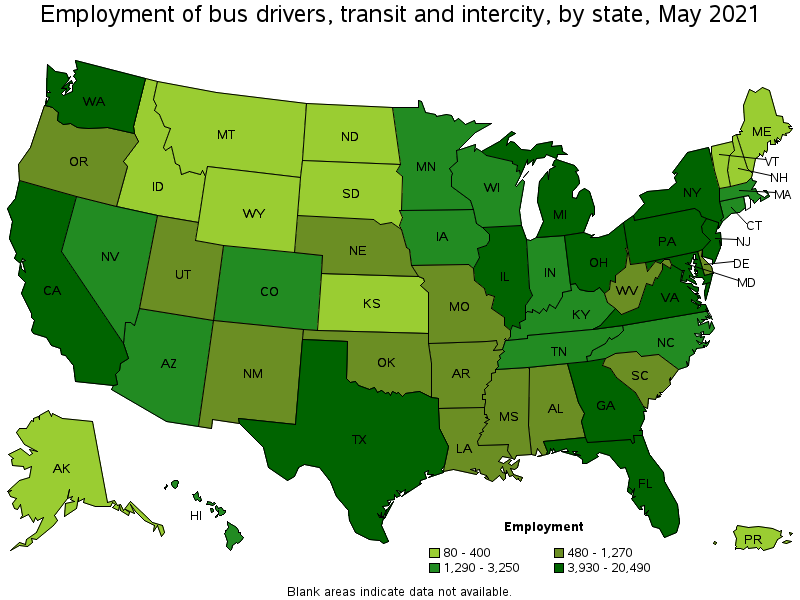
States with the highest employment level in Bus Drivers, Transit and Intercity:
| State | Employment (1) | Employment per thousand jobs | Location quotient (9) | Hourly mean wage | Annual mean wage (2) |
|---|---|---|---|---|---|
| California | 20,490 | 1.24 | 1.20 | $ 27.62 | $ 57,450 |
| New York | 16,330 | 1.88 | 1.82 | $ 34.10 | $ 70,930 |
| Illinois | 10,050 | 1.79 | 1.73 | $ 26.00 | $ 54,070 |
| Washington | 8,240 | 2.57 | 2.48 | $ 29.58 | $ 61,520 |
| Florida | 8,130 | 0.94 | 0.91 | $ 20.76 | $ 43,190 |
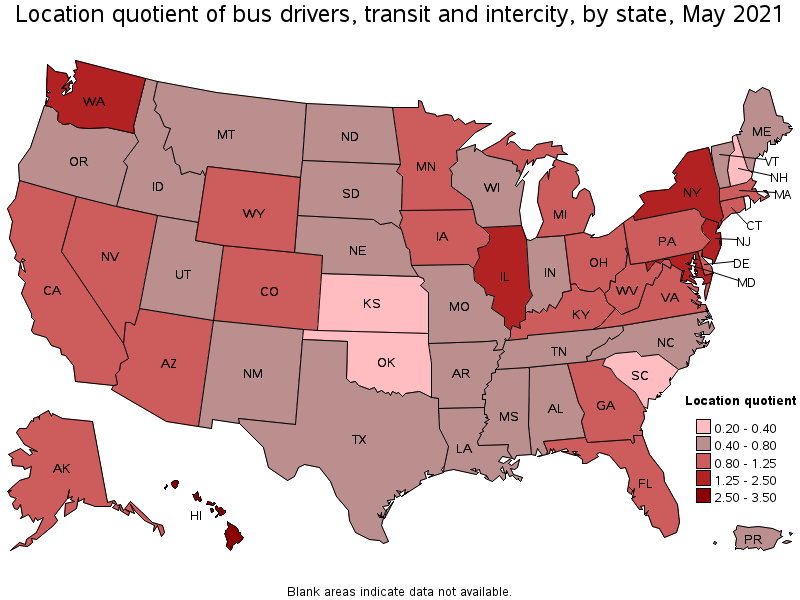
States with the highest concentration of jobs and location quotients in Bus Drivers, Transit and Intercity:
| State | Employment (1) | Employment per thousand jobs | Location quotient (9) | Hourly mean wage | Annual mean wage (2) |
|---|---|---|---|---|---|
| Hawaii | 1,650 | 3.00 | 2.90 | $ 26.42 | $ 54,960 |
| Washington | 8,240 | 2.57 | 2.48 | $ 29.58 | $ 61,520 |
| Maryland | 5,140 | 2.02 | 1.95 | $ 24.93 | $ 51,860 |
| New York | 16,330 | 1.88 | 1.82 | $ 34.10 | $ 70,930 |
| Illinois | 10,050 | 1.79 | 1.73 | $ 26.00 | $ 54,070 |
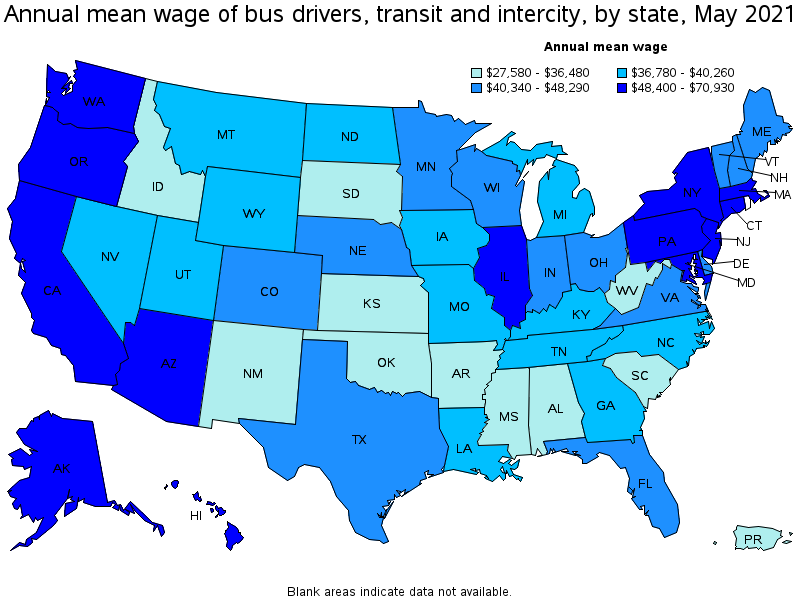
Top paying states for Bus Drivers, Transit and Intercity:
| State | Employment (1) | Employment per thousand jobs | Location quotient (9) | Hourly mean wage | Annual mean wage (2) |
|---|---|---|---|---|---|
| New York | 16,330 | 1.88 | 1.82 | $ 34.10 | $ 70,930 |
| Massachusetts | 3,060 | 0.90 | 0.87 | $ 31.20 | $ 64,890 |
| Washington | 8,240 | 2.57 | 2.48 | $ 29.58 | $ 61,520 |
| Alaska | 260 | 0.88 | 0.85 | $ 27.87 | $ 57,960 |
| California | 20,490 | 1.24 | 1.20 | $ 27.62 | $ 57,450 |
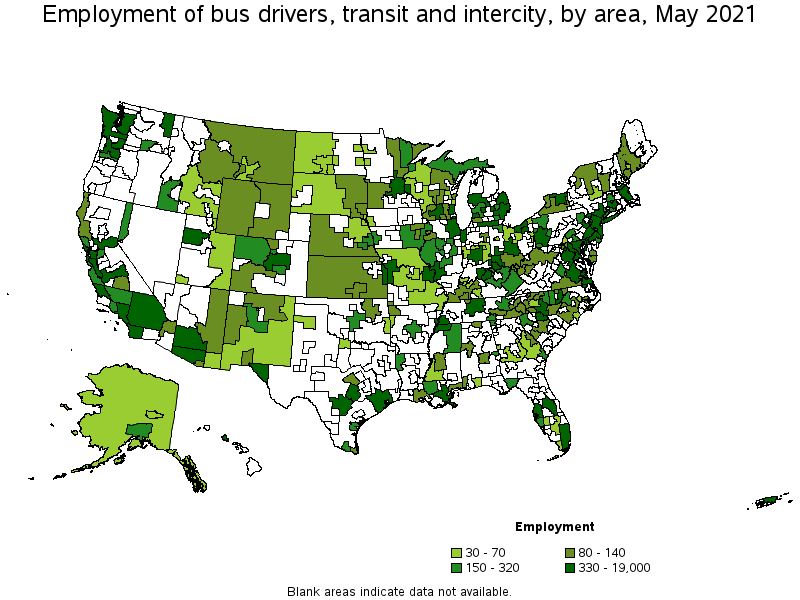
Metropolitan areas with the highest employment level in Bus Drivers, Transit and Intercity:
| Metropolitan area | Employment (1) | Employment per thousand jobs | Location quotient (9) | Hourly mean wage | Annual mean wage (2) |
|---|---|---|---|---|---|
| New York-Newark-Jersey City, NY-NJ-PA | 19,000 | 2.19 | 2.12 | $ 33.32 | $ 69,310 |
| Chicago-Naperville-Elgin, IL-IN-WI | 8,280 | 1.96 | 1.89 | $ 27.01 | $ 56,180 |
| Los Angeles-Long Beach-Anaheim, CA | 5,590 | 0.98 | 0.95 | $ 26.05 | $ 54,190 |
| Seattle-Tacoma-Bellevue, WA | 5,510 | 2.87 | 2.78 | $ 31.34 | $ 65,190 |
| San Francisco-Oakland-Hayward, CA | 5,150 | 2.30 | 2.22 | $ 31.98 | $ 66,520 |
| Washington-Arlington-Alexandria, DC-VA-MD-WV | 4,980 | 1.70 | 1.64 | $ 25.08 | $ 52,160 |
| Miami-Fort Lauderdale-West Palm Beach, FL | 3,420 | 1.40 | 1.35 | $ 22.87 | $ 47,570 |
| Boston-Cambridge-Nashua, MA-NH | 2,660 | 1.03 | 0.99 | $ 32.39 | $ 67,370 |
| Houston-The Woodlands-Sugar Land, TX | 2,410 | 0.83 | 0.81 | $ 21.54 | $ 44,800 |
| Baltimore-Columbia-Towson, MD | 2,120 | 1.68 | 1.63 | $ 25.68 | $ 53,410 |
Metropolitan areas with the highest concentration of jobs and location quotients in Bus Drivers, Transit and Intercity:
| Metropolitan area | Employment (1) | Employment per thousand jobs | Location quotient (9) | Hourly mean wage | Annual mean wage (2) |
|---|---|---|---|---|---|
| Urban Honolulu, HI | 1,410 | 3.57 | 3.45 | $ 27.31 | $ 56,800 |
| San Luis Obispo-Paso Robles-Arroyo Grande, CA | 330 | 2.92 | 2.82 | $ 27.46 | $ 57,120 |
| Seattle-Tacoma-Bellevue, WA | 5,510 | 2.87 | 2.78 | $ 31.34 | $ 65,190 |
| Auburn-Opelika, AL | 160 | 2.80 | 2.70 | $ 13.84 | $ 28,790 |
| Santa Cruz-Watsonville, CA | 260 | 2.73 | 2.64 | $ 30.19 | $ 62,790 |
| Champaign-Urbana, IL | 260 | 2.65 | 2.56 | $ 27.91 | $ 58,060 |
| Atlantic City-Hammonton, NJ | 270 | 2.31 | 2.23 | $ 27.46 | $ 57,120 |
| San Francisco-Oakland-Hayward, CA | 5,150 | 2.30 | 2.22 | $ 31.98 | $ 66,520 |
| Kennewick-Richland, WA | 270 | 2.29 | 2.22 | $ 27.11 | $ 56,380 |
| New York-Newark-Jersey City, NY-NJ-PA | 19,000 | 2.19 | 2.12 | $ 33.32 | $ 69,310 |
Top paying metropolitan areas for Bus Drivers, Transit and Intercity:
| Metropolitan area | Employment (1) | Employment per thousand jobs | Location quotient (9) | Hourly mean wage | Annual mean wage (2) |
|---|---|---|---|---|---|
| San Jose-Sunnyvale-Santa Clara, CA | 1,100 | 1.03 | 1.00 | $ 33.63 | $ 69,940 |
| New York-Newark-Jersey City, NY-NJ-PA | 19,000 | 2.19 | 2.12 | $ 33.32 | $ 69,310 |
| Boston-Cambridge-Nashua, MA-NH | 2,660 | 1.03 | 0.99 | $ 32.39 | $ 67,370 |
| San Francisco-Oakland-Hayward, CA | 5,150 | 2.30 | 2.22 | $ 31.98 | $ 66,520 |
| Fairbanks, AK | 50 | 1.31 | 1.27 | $ 31.60 | $ 65,740 |
| Seattle-Tacoma-Bellevue, WA | 5,510 | 2.87 | 2.78 | $ 31.34 | $ 65,190 |
| Santa Cruz-Watsonville, CA | 260 | 2.73 | 2.64 | $ 30.19 | $ 62,790 |
| Salinas, CA | 230 | 1.37 | 1.33 | $ 28.92 | $ 60,150 |
| Anchorage, AK | 150 | 0.91 | 0.88 | $ 28.12 | $ 58,480 |
| Champaign-Urbana, IL | 260 | 2.65 | 2.56 | $ 27.91 | $ 58,060 |
Nonmetropolitan areas with the highest employment in Bus Drivers, Transit and Intercity:
| Nonmetropolitan area | Employment (1) | Employment per thousand jobs | Location quotient (9) | Hourly mean wage | Annual mean wage (2) |
|---|---|---|---|---|---|
| Western Washington nonmetropolitan area | 450 | 3.77 | 3.64 | $ 24.67 | $ 51,310 |
| Balance of Lower Peninsula of Michigan nonmetropolitan area | 360 | 1.43 | 1.39 | $ 17.17 | $ 35,720 |
| Upper Peninsula of Michigan nonmetropolitan area | 310 | 3.03 | 2.93 | $ 17.98 | $ 37,400 |
| West Central Illinois nonmetropolitan area | 250 | 1.56 | 1.51 | $ 17.64 | $ 36,690 |
| Central Kentucky nonmetropolitan area | 240 | 1.39 | 1.35 | $ 15.11 | $ 31,430 |
Nonmetropolitan areas with the highest concentration of jobs and location quotients in Bus Drivers, Transit and Intercity:
| Nonmetropolitan area | Employment (1) | Employment per thousand jobs | Location quotient (9) | Hourly mean wage | Annual mean wage (2) |
|---|---|---|---|---|---|
| Western Washington nonmetropolitan area | 450 | 3.77 | 3.64 | $ 24.67 | $ 51,310 |
| Upper Peninsula of Michigan nonmetropolitan area | 310 | 3.03 | 2.93 | $ 17.98 | $ 37,400 |
| Northeast Minnesota nonmetropolitan area | 90 | 2.16 | 2.09 | $ 16.77 | $ 34,890 |
| East Kentucky nonmetropolitan area | 200 | 2.06 | 1.99 | $ 13.30 | $ 27,650 |
| Northwest Colorado nonmetropolitan area | 220 | 1.85 | 1.79 | $ 23.94 | $ 49,800 |
Top paying nonmetropolitan areas for Bus Drivers, Transit and Intercity:
| Nonmetropolitan area | Employment (1) | Employment per thousand jobs | Location quotient (9) | Hourly mean wage | Annual mean wage (2) |
|---|---|---|---|---|---|
| Alaska nonmetropolitan area | 70 | 0.69 | 0.67 | $ 24.90 | $ 51,790 |
| Western Washington nonmetropolitan area | 450 | 3.77 | 3.64 | $ 24.67 | $ 51,310 |
| Northwest Colorado nonmetropolitan area | 220 | 1.85 | 1.79 | $ 23.94 | $ 49,800 |
| Southwest Colorado nonmetropolitan area | 130 | 1.30 | 1.26 | $ 21.69 | $ 45,110 |
| Southeast-Central Idaho nonmetropolitan area | 70 | 0.79 | 0.76 | $ 20.87 | $ 43,410 |
These estimates are calculated with data collected from employers in all industry sectors, all metropolitan and nonmetropolitan areas, and all states and the District of Columbia. The top employment and wage figures are provided above. The complete list is available in the downloadable XLS files.
The percentile wage estimate is the value of a wage below which a certain percent of workers fall. The median wage is the 50th percentile wage estimate—50 percent of workers earn less than the median and 50 percent of workers earn more than the median. More about percentile wages.
(1) Estimates for detailed occupations do not sum to the totals because the totals include occupations not shown separately. Estimates do not include self-employed workers.
(2) Annual wages have been calculated by multiplying the hourly mean wage by a "year-round, full-time" hours figure of 2,080 hours; for those occupations where there is not an hourly wage published, the annual wage has been directly calculated from the reported survey data.
(3) The relative standard error (RSE) is a measure of the reliability of a survey statistic. The smaller the relative standard error, the more precise the estimate.
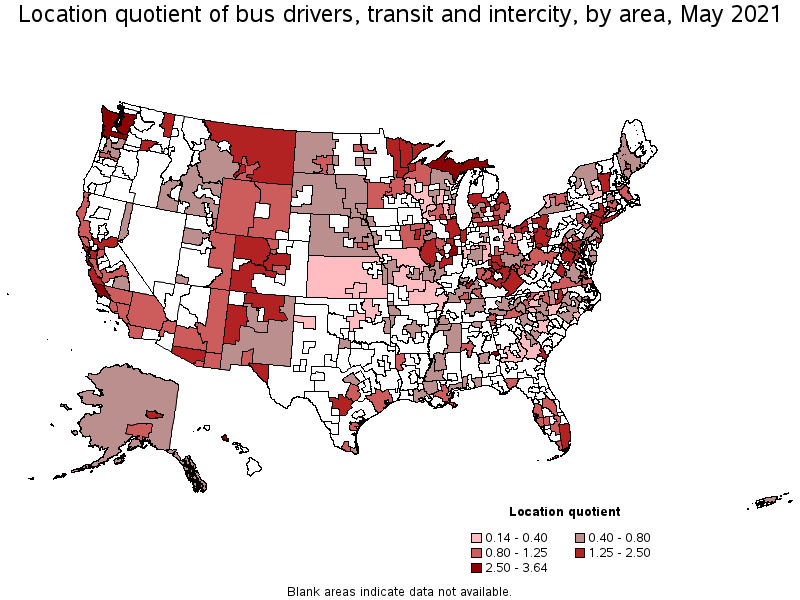
(9) The location quotient is the ratio of the area concentration of occupational employment to the national average concentration. A location quotient greater than one indicates the occupation has a higher share of employment than average, and a location quotient less than one indicates the occupation is less prevalent in the area than average.
Other OEWS estimates and related information:
May 2021 National Occupational Employment and Wage Estimates
May 2021 State Occupational Employment and Wage Estimates
May 2021 Metropolitan and Nonmetropolitan Area Occupational Employment and Wage Estimates
May 2021 National Industry-Specific Occupational Employment and Wage Estimates
Last Modified Date: March 31, 2022