
An official website of the United States government
An official website of the United States government
The .gov means it's official.
Federal government websites often end in .gov or .mil. Before sharing sensitive information,
make sure you're on a federal government site.
The site is secure.
The
https:// ensures that you are connecting to the official website and that any
information you provide is encrypted and transmitted securely.
Drive a motor vehicle to transport passengers on a planned or scheduled basis. May collect a fare. Includes nonemergency medical transporters and hearse drivers. Excludes �Ambulance Drivers and Attendants, Except Emergency Medical Technicians� (53-3011) and �Taxi Drivers� (53-3054).
Employment estimate and mean wage estimates for Shuttle Drivers and Chauffeurs:
| Employment (1) | Employment RSE (3) |
Mean hourly wage |
Mean annual wage (2) |
Wage RSE (3) |
|---|---|---|---|---|
| 175,660 | 1.2 % | $ 15.66 | $ 32,570 | 0.3 % |
Percentile wage estimates for Shuttle Drivers and Chauffeurs:
| Percentile | 10% | 25% | 50% (Median) |
75% | 90% |
|---|---|---|---|---|---|
| Hourly Wage | $ 10.92 | $ 12.70 | $ 14.42 | $ 17.79 | $ 22.11 |
| Annual Wage (2) | $ 22,710 | $ 26,420 | $ 30,000 | $ 37,010 | $ 45,980 |
Industries with the highest published employment and wages for Shuttle Drivers and Chauffeurs are provided. For a list of all industries with employment in Shuttle Drivers and Chauffeurs, see the Create Customized Tables function.
Industries with the highest levels of employment in Shuttle Drivers and Chauffeurs:
| Industry | Employment (1) | Percent of industry employment | Hourly mean wage | Annual mean wage (2) |
|---|---|---|---|---|
| Other Transit and Ground Passenger Transportation | 39,900 | 47.19 | $ 15.56 | $ 32,370 |
| Taxi and Limousine Service | 15,770 | 37.08 | $ 16.38 | $ 34,070 |
| Individual and Family Services | 14,820 | 0.56 | $ 13.77 | $ 28,650 |
| Automobile Dealers | 14,320 | 1.17 | $ 13.53 | $ 28,130 |
| Local Government, excluding schools and hospitals (OEWS Designation) | 11,780 | 0.22 | $ 17.01 | $ 35,370 |
Industries with the highest concentration of employment in Shuttle Drivers and Chauffeurs:
| Industry | Employment (1) | Percent of industry employment | Hourly mean wage | Annual mean wage (2) |
|---|---|---|---|---|
| Other Transit and Ground Passenger Transportation | 39,900 | 47.19 | $ 15.56 | $ 32,370 |
| Taxi and Limousine Service | 15,770 | 37.08 | $ 16.38 | $ 34,070 |
| Urban Transit Systems | 2,130 | 5.46 | $ 18.66 | $ 38,810 |
| School and Employee Bus Transportation | 9,490 | 5.33 | $ 17.30 | $ 35,980 |
| Interurban and Rural Bus Transportation | 600 | 4.82 | $ 14.07 | $ 29,270 |
Top paying industries for Shuttle Drivers and Chauffeurs:
| Industry | Employment (1) | Percent of industry employment | Hourly mean wage | Annual mean wage (2) |
|---|---|---|---|---|
| Securities, Commodity Contracts, and Other Financial Investments and Related Activities | (8) | (8) | $ 45.98 | $ 95,640 |
| Performing Arts Companies | (8) | (8) | $ 35.72 | $ 74,290 |
| Legal Services | (8) | (8) | $ 29.23 | $ 60,810 |
| Merchant Wholesalers, Nondurable Goods (4244 and 4248 only) | 370 | 0.04 | $ 27.20 | $ 56,570 |
| Scientific Research and Development Services | 170 | 0.02 | $ 25.35 | $ 52,720 |
States and areas with the highest published employment, location quotients, and wages for Shuttle Drivers and Chauffeurs are provided. For a list of all areas with employment in Shuttle Drivers and Chauffeurs, see the Create Customized Tables function.
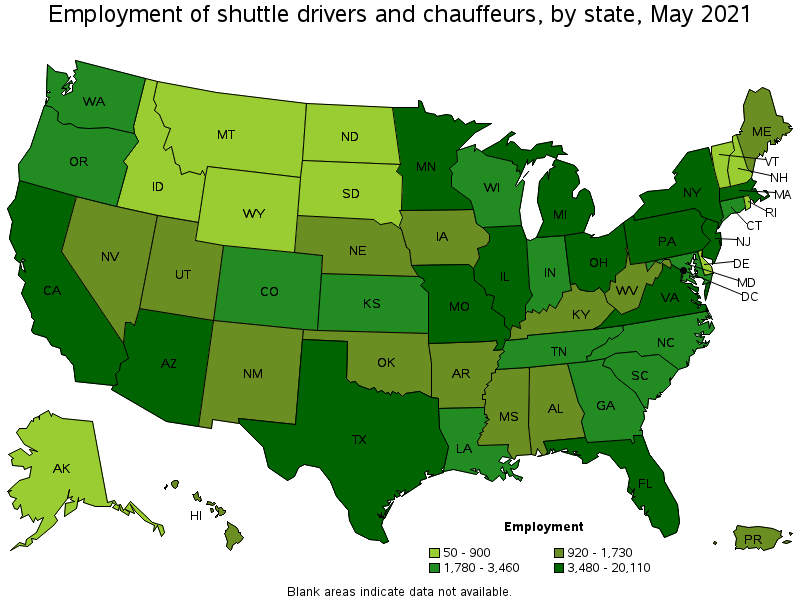
States with the highest employment level in Shuttle Drivers and Chauffeurs:
| State | Employment (1) | Employment per thousand jobs | Location quotient (9) | Hourly mean wage | Annual mean wage (2) |
|---|---|---|---|---|---|
| California | 20,110 | 1.22 | 0.98 | $ 18.59 | $ 38,670 |
| New York | 16,930 | 1.95 | 1.57 | $ 19.52 | $ 40,610 |
| Florida | 10,390 | 1.21 | 0.97 | $ 14.15 | $ 29,430 |
| Texas | 9,750 | 0.80 | 0.64 | $ 13.66 | $ 28,420 |
| Pennsylvania | 9,380 | 1.68 | 1.35 | $ 14.14 | $ 29,420 |
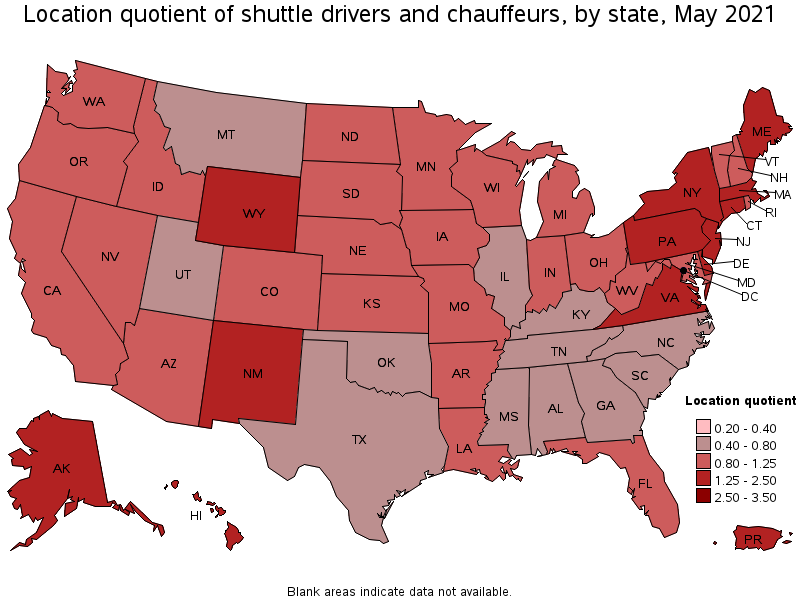
States with the highest concentration of jobs and location quotients in Shuttle Drivers and Chauffeurs:
| State | Employment (1) | Employment per thousand jobs | Location quotient (9) | Hourly mean wage | Annual mean wage (2) |
|---|---|---|---|---|---|
| Massachusetts | 8,840 | 2.60 | 2.09 | $ 17.33 | $ 36,040 |
| Hawaii | 1,090 | 1.98 | 1.59 | $ 16.40 | $ 34,120 |
| New York | 16,930 | 1.95 | 1.57 | $ 19.52 | $ 40,610 |
| Wyoming | 470 | 1.81 | 1.45 | $ 12.71 | $ 26,440 |
| Delaware | 790 | 1.80 | 1.45 | $ 17.08 | $ 35,520 |
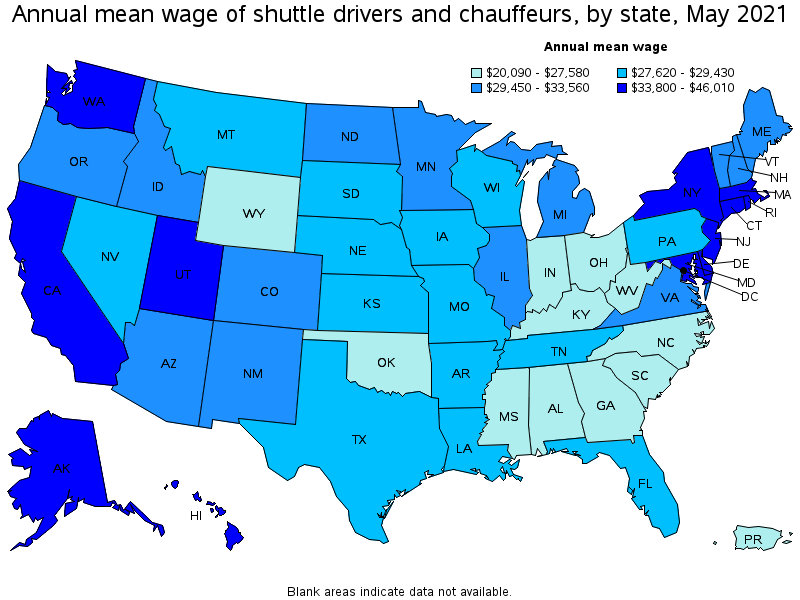
Top paying states for Shuttle Drivers and Chauffeurs:
| State | Employment (1) | Employment per thousand jobs | Location quotient (9) | Hourly mean wage | Annual mean wage (2) |
|---|---|---|---|---|---|
| District of Columbia | 400 | 0.61 | 0.49 | $ 22.12 | $ 46,010 |
| New York | 16,930 | 1.95 | 1.57 | $ 19.52 | $ 40,610 |
| California | 20,110 | 1.22 | 0.98 | $ 18.59 | $ 38,670 |
| Washington | 3,310 | 1.03 | 0.83 | $ 18.45 | $ 38,380 |
| Alaska | 480 | 1.62 | 1.30 | $ 17.63 | $ 36,670 |
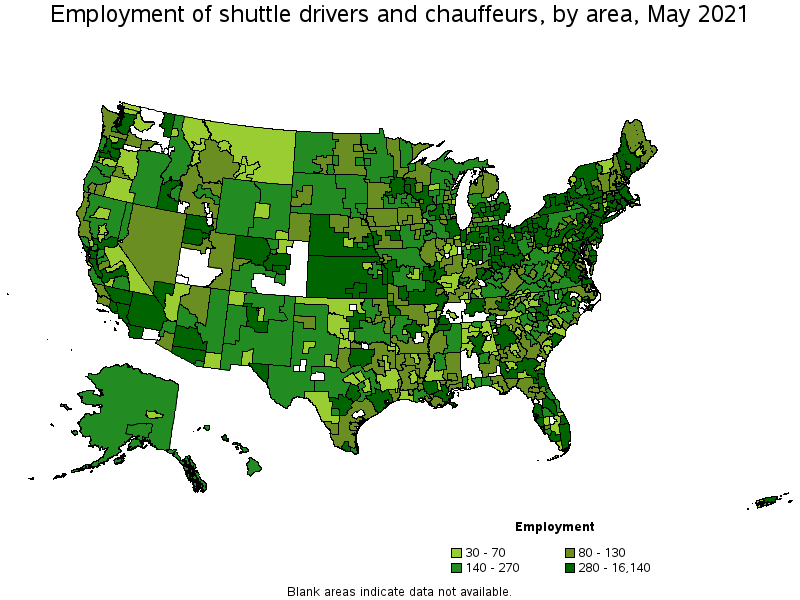
Metropolitan areas with the highest employment level in Shuttle Drivers and Chauffeurs:
| Metropolitan area | Employment (1) | Employment per thousand jobs | Location quotient (9) | Hourly mean wage | Annual mean wage (2) |
|---|---|---|---|---|---|
| New York-Newark-Jersey City, NY-NJ-PA | 16,140 | 1.86 | 1.49 | $ 20.19 | $ 42,000 |
| San Francisco-Oakland-Hayward, CA | 6,710 | 2.99 | 2.40 | $ 20.01 | $ 41,620 |
| Los Angeles-Long Beach-Anaheim, CA | 5,610 | 0.98 | 0.79 | $ 18.41 | $ 38,290 |
| Boston-Cambridge-Nashua, MA-NH | 5,440 | 2.10 | 1.69 | $ 17.53 | $ 36,460 |
| Philadelphia-Camden-Wilmington, PA-NJ-DE-MD | 4,480 | 1.69 | 1.35 | $ 15.34 | $ 31,900 |
| Miami-Fort Lauderdale-West Palm Beach, FL | 3,890 | 1.59 | 1.27 | $ 14.48 | $ 30,120 |
| Washington-Arlington-Alexandria, DC-VA-MD-WV | 3,590 | 1.22 | 0.98 | $ 17.89 | $ 37,220 |
| Phoenix-Mesa-Scottsdale, AZ | 3,140 | 1.49 | 1.19 | $ 15.93 | $ 33,130 |
| Dallas-Fort Worth-Arlington, TX | 2,790 | 0.78 | 0.62 | $ 14.12 | $ 29,370 |
| Chicago-Naperville-Elgin, IL-IN-WI | 2,620 | 0.62 | 0.50 | $ 15.65 | $ 32,560 |
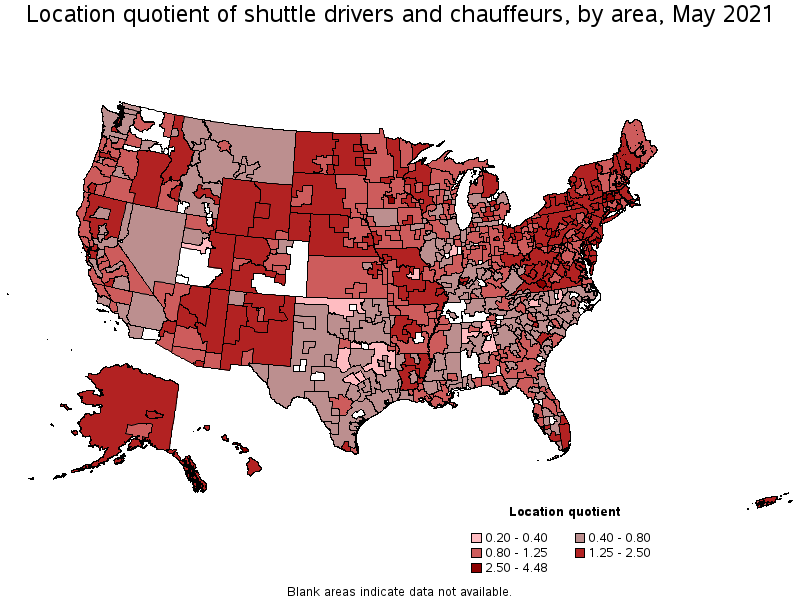
Metropolitan areas with the highest concentration of jobs and location quotients in Shuttle Drivers and Chauffeurs:
| Metropolitan area | Employment (1) | Employment per thousand jobs | Location quotient (9) | Hourly mean wage | Annual mean wage (2) |
|---|---|---|---|---|---|
| Springfield, MA-CT | 1,720 | 5.59 | 4.48 | $ 16.88 | $ 35,110 |
| Kahului-Wailuku-Lahaina, HI | 270 | 4.16 | 3.33 | $ 18.04 | $ 37,510 |
| Blacksburg-Christiansburg-Radford, VA | 250 | 3.67 | 2.95 | $ 14.74 | $ 30,660 |
| Johnstown, PA | 170 | 3.54 | 2.84 | $ 11.33 | $ 23,570 |
| New Bedford, MA | 210 | 3.39 | 2.72 | $ 17.12 | $ 35,610 |
| Leominster-Gardner, MA | 160 | 3.33 | 2.67 | $ 17.38 | $ 36,150 |
| Mankato-North Mankato, MN | 170 | 3.23 | 2.59 | $ 14.45 | $ 30,060 |
| Pittsfield, MA | 120 | 3.20 | 2.57 | $ 16.21 | $ 33,720 |
| Atlantic City-Hammonton, NJ | 370 | 3.16 | 2.53 | $ 14.94 | $ 31,080 |
| San Francisco-Oakland-Hayward, CA | 6,710 | 2.99 | 2.40 | $ 20.01 | $ 41,620 |
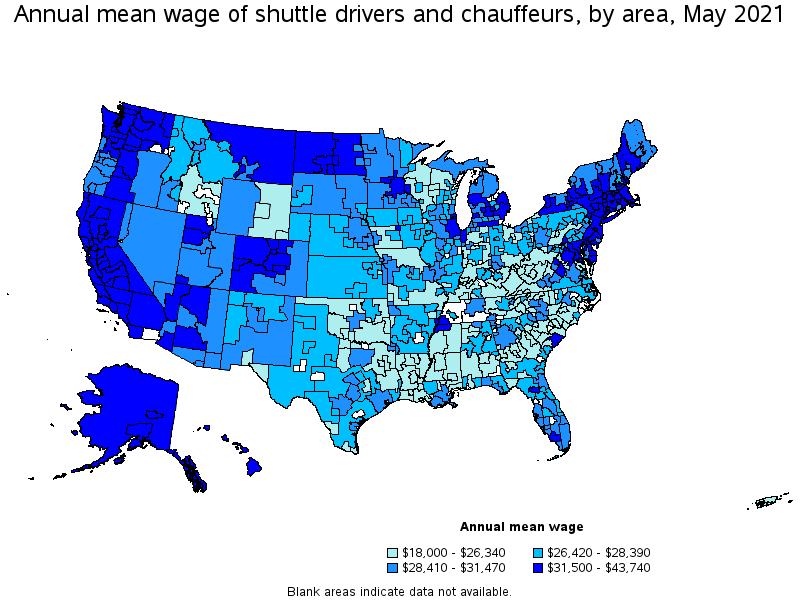
Top paying metropolitan areas for Shuttle Drivers and Chauffeurs:
| Metropolitan area | Employment (1) | Employment per thousand jobs | Location quotient (9) | Hourly mean wage | Annual mean wage (2) |
|---|---|---|---|---|---|
| San Jose-Sunnyvale-Santa Clara, CA | 730 | 0.69 | 0.55 | $ 21.03 | $ 43,740 |
| Napa, CA | 70 | 1.03 | 0.83 | $ 20.54 | $ 42,730 |
| New York-Newark-Jersey City, NY-NJ-PA | 16,140 | 1.86 | 1.49 | $ 20.19 | $ 42,000 |
| San Francisco-Oakland-Hayward, CA | 6,710 | 2.99 | 2.40 | $ 20.01 | $ 41,620 |
| Santa Cruz-Watsonville, CA | 70 | 0.73 | 0.58 | $ 19.68 | $ 40,930 |
| Santa Rosa, CA | 230 | 1.22 | 0.98 | $ 19.51 | $ 40,590 |
| Seattle-Tacoma-Bellevue, WA | 1,860 | 0.97 | 0.78 | $ 19.21 | $ 39,970 |
| Ames, IA | 50 | 1.18 | 0.94 | $ 19.12 | $ 39,780 |
| Bremerton-Silverdale, WA | 140 | 1.67 | 1.34 | $ 18.96 | $ 39,430 |
| Bridgeport-Stamford-Norwalk, CT | 790 | 2.12 | 1.70 | $ 18.95 | $ 39,420 |
Nonmetropolitan areas with the highest employment in Shuttle Drivers and Chauffeurs:
| Nonmetropolitan area | Employment (1) | Employment per thousand jobs | Location quotient (9) | Hourly mean wage | Annual mean wage (2) |
|---|---|---|---|---|---|
| Kansas nonmetropolitan area | 570 | 1.51 | 1.21 | $ 13.27 | $ 27,610 |
| North Northeastern Ohio nonmetropolitan area (noncontiguous) | 560 | 1.77 | 1.42 | $ 12.42 | $ 25,830 |
| Southwest Maine nonmetropolitan area | 450 | 2.44 | 1.96 | $ 15.15 | $ 31,510 |
| Southern Ohio nonmetropolitan area | 380 | 2.51 | 2.01 | $ 11.89 | $ 24,740 |
| Western Wisconsin nonmetropolitan area | 360 | 2.73 | 2.19 | $ 12.23 | $ 25,440 |
Nonmetropolitan areas with the highest concentration of jobs and location quotients in Shuttle Drivers and Chauffeurs:
| Nonmetropolitan area | Employment (1) | Employment per thousand jobs | Location quotient (9) | Hourly mean wage | Annual mean wage (2) |
|---|---|---|---|---|---|
| West South Dakota nonmetropolitan area | 180 | 3.09 | 2.48 | $ 14.07 | $ 29,260 |
| Northwest Colorado nonmetropolitan area | 350 | 3.01 | 2.42 | $ 16.45 | $ 34,210 |
| Western Wisconsin nonmetropolitan area | 360 | 2.73 | 2.19 | $ 12.23 | $ 25,440 |
| Arizona nonmetropolitan area | 240 | 2.69 | 2.15 | $ 14.31 | $ 29,760 |
| Northern New Hampshire nonmetropolitan area | 90 | 2.68 | 2.15 | $ 14.02 | $ 29,150 |
Top paying nonmetropolitan areas for Shuttle Drivers and Chauffeurs:
| Nonmetropolitan area | Employment (1) | Employment per thousand jobs | Location quotient (9) | Hourly mean wage | Annual mean wage (2) |
|---|---|---|---|---|---|
| Alaska nonmetropolitan area | 170 | 1.80 | 1.44 | $ 20.77 | $ 43,200 |
| Eastern Sierra-Mother Lode Region of California nonmetropolitan area | 70 | 1.20 | 0.96 | $ 17.23 | $ 35,830 |
| West North Dakota nonmetropolitan area | 160 | 1.55 | 1.25 | $ 17.21 | $ 35,800 |
| Massachusetts nonmetropolitan area | 130 | 2.33 | 1.87 | $ 17.12 | $ 35,600 |
| Western Washington nonmetropolitan area | 100 | 0.87 | 0.70 | $ 17.07 | $ 35,500 |
These estimates are calculated with data collected from employers in all industry sectors, all metropolitan and nonmetropolitan areas, and all states and the District of Columbia. The top employment and wage figures are provided above. The complete list is available in the downloadable XLS files.
The percentile wage estimate is the value of a wage below which a certain percent of workers fall. The median wage is the 50th percentile wage estimate—50 percent of workers earn less than the median and 50 percent of workers earn more than the median. More about percentile wages.
(1) Estimates for detailed occupations do not sum to the totals because the totals include occupations not shown separately. Estimates do not include self-employed workers.
(2) Annual wages have been calculated by multiplying the hourly mean wage by a "year-round, full-time" hours figure of 2,080 hours; for those occupations where there is not an hourly wage published, the annual wage has been directly calculated from the reported survey data.
(3) The relative standard error (RSE) is a measure of the reliability of a survey statistic. The smaller the relative standard error, the more precise the estimate.
(8) Estimate not released.
(9) The location quotient is the ratio of the area concentration of occupational employment to the national average concentration. A location quotient greater than one indicates the occupation has a higher share of employment than average, and a location quotient less than one indicates the occupation is less prevalent in the area than average.
Other OEWS estimates and related information:
May 2021 National Occupational Employment and Wage Estimates
May 2021 State Occupational Employment and Wage Estimates
May 2021 Metropolitan and Nonmetropolitan Area Occupational Employment and Wage Estimates
May 2021 National Industry-Specific Occupational Employment and Wage Estimates
Last Modified Date: March 31, 2022