
An official website of the United States government
An official website of the United States government
The .gov means it's official.
Federal government websites often end in .gov or .mil. Before sharing sensitive information,
make sure you're on a federal government site.
The site is secure.
The
https:// ensures that you are connecting to the official website and that any
information you provide is encrypted and transmitted securely.
Drive a motor vehicle to transport passengers on an unplanned basis and charge a fare, usually based on a meter. Excludes �Shuttle Drivers and Chauffeurs� (53-3053).
Employment estimate and mean wage estimates for Taxi Drivers:
| Employment (1) | Employment RSE (3) |
Mean hourly wage |
Mean annual wage (2) |
Wage RSE (3) |
|---|---|---|---|---|
| 13,950 | 4.0 % | $ 14.45 | $ 30,050 | 1.6 % |
Percentile wage estimates for Taxi Drivers:
| Percentile | 10% | 25% | 50% (Median) |
75% | 90% |
|---|---|---|---|---|---|
| Hourly Wage | $ 10.10 | $ 11.51 | $ 14.09 | $ 16.16 | $ 18.59 |
| Annual Wage (2) | $ 21,010 | $ 23,950 | $ 29,310 | $ 33,620 | $ 38,670 |
Industries with the highest published employment and wages for Taxi Drivers are provided. For a list of all industries with employment in Taxi Drivers, see the Create Customized Tables function.
Industries with the highest levels of employment in Taxi Drivers:
| Industry | Employment (1) | Percent of industry employment | Hourly mean wage | Annual mean wage (2) |
|---|---|---|---|---|
| Taxi and Limousine Service | 9,960 | 23.43 | $ 14.67 | $ 30,510 |
| Other Transit and Ground Passenger Transportation | 660 | 0.78 | $ 12.98 | $ 26,990 |
| Other Ambulatory Health Care Services | 470 | 0.15 | $ 16.69 | $ 34,710 |
| Management of Companies and Enterprises | 340 | 0.01 | $ 13.19 | $ 27,430 |
| Other Personal Services | 310 | 0.10 | $ 10.42 | $ 21,670 |
Industries with the highest concentration of employment in Taxi Drivers:
| Industry | Employment (1) | Percent of industry employment | Hourly mean wage | Annual mean wage (2) |
|---|---|---|---|---|
| Taxi and Limousine Service | 9,960 | 23.43 | $ 14.67 | $ 30,510 |
| Other Support Activities for Transportation | 270 | 0.81 | $ 15.61 | $ 32,470 |
| Other Transit and Ground Passenger Transportation | 660 | 0.78 | $ 12.98 | $ 26,990 |
| Other Ambulatory Health Care Services | 470 | 0.15 | $ 16.69 | $ 34,710 |
| Other Personal Services | 310 | 0.10 | $ 10.42 | $ 21,670 |
Top paying industries for Taxi Drivers:
| Industry | Employment (1) | Percent of industry employment | Hourly mean wage | Annual mean wage (2) |
|---|---|---|---|---|
| Other Ambulatory Health Care Services | 470 | 0.15 | $ 16.69 | $ 34,710 |
| Individual and Family Services | (8) | (8) | $ 16.52 | $ 34,360 |
| Other Support Activities for Transportation | 270 | 0.81 | $ 15.61 | $ 32,470 |
| Taxi and Limousine Service | 9,960 | 23.43 | $ 14.67 | $ 30,510 |
| Employment Services | 110 | (7) | $ 14.33 | $ 29,800 |
States and areas with the highest published employment, location quotients, and wages for Taxi Drivers are provided. For a list of all areas with employment in Taxi Drivers, see the Create Customized Tables function.
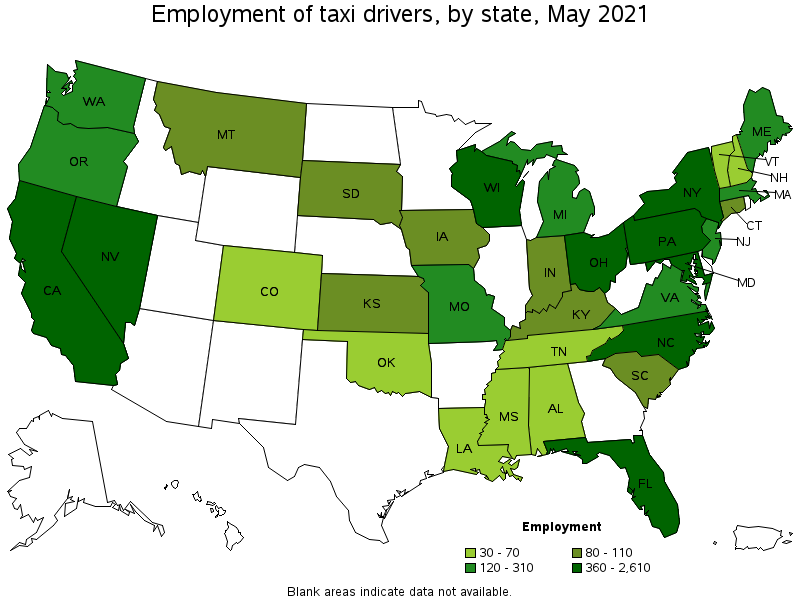
States with the highest employment level in Taxi Drivers:
| State | Employment (1) | Employment per thousand jobs | Location quotient (9) | Hourly mean wage | Annual mean wage (2) |
|---|---|---|---|---|---|
| Nevada | 2,610 | 2.02 | 20.44 | $ 15.03 | $ 31,270 |
| Wisconsin | 1,290 | 0.47 | 4.72 | $ 12.46 | $ 25,920 |
| New York | 1,160 | 0.13 | 1.35 | $ 15.87 | $ 33,010 |
| California | 1,150 | 0.07 | 0.70 | $ 15.71 | $ 32,680 |
| North Carolina | 910 | 0.21 | 2.08 | $ 13.28 | $ 27,620 |
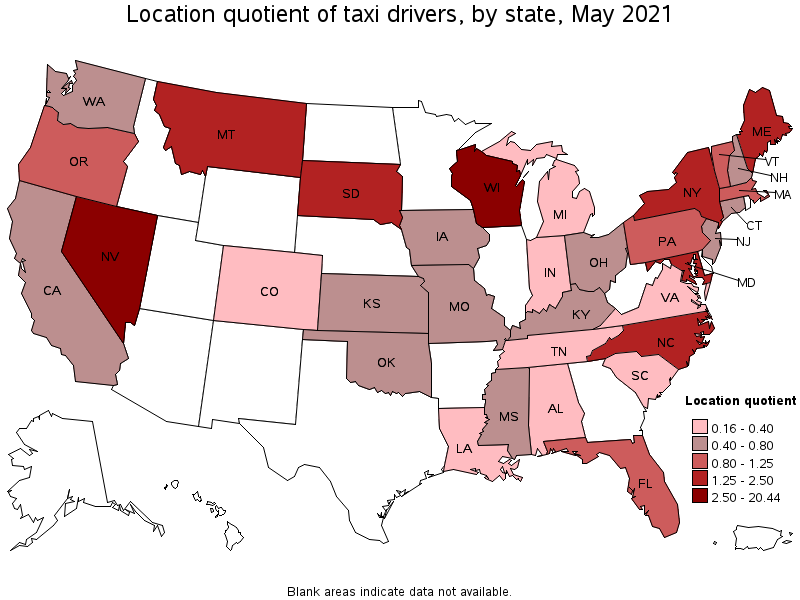
States with the highest concentration of jobs and location quotients in Taxi Drivers:
| State | Employment (1) | Employment per thousand jobs | Location quotient (9) | Hourly mean wage | Annual mean wage (2) |
|---|---|---|---|---|---|
| Nevada | 2,610 | 2.02 | 20.44 | $ 15.03 | $ 31,270 |
| Wisconsin | 1,290 | 0.47 | 4.72 | $ 12.46 | $ 25,920 |
| Maine | 150 | 0.24 | 2.47 | $ 14.71 | $ 30,600 |
| Montana | 100 | 0.22 | 2.18 | $ 10.35 | $ 21,520 |
| North Carolina | 910 | 0.21 | 2.08 | $ 13.28 | $ 27,620 |
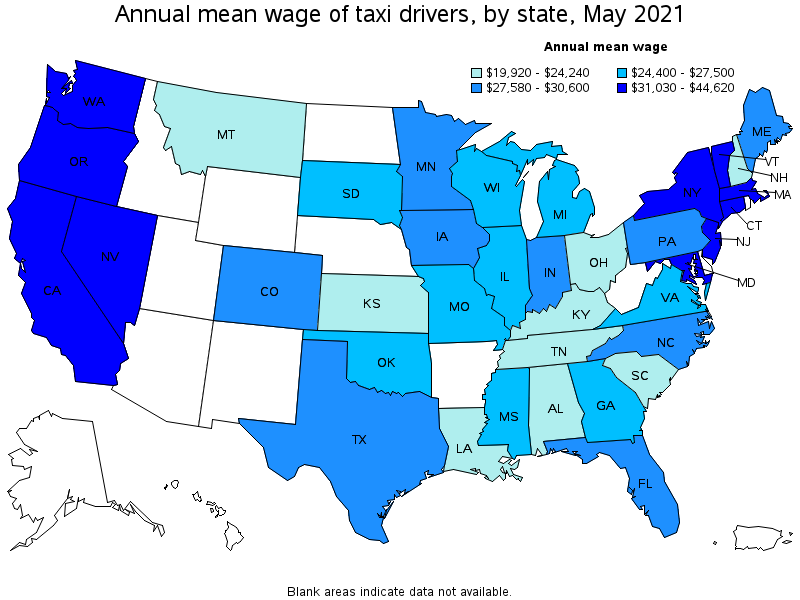
Top paying states for Taxi Drivers:
| State | Employment (1) | Employment per thousand jobs | Location quotient (9) | Hourly mean wage | Annual mean wage (2) |
|---|---|---|---|---|---|
| Vermont | 30 | 0.11 | 1.14 | $ 21.45 | $ 44,620 |
| New Jersey | 250 | 0.07 | 0.66 | $ 17.06 | $ 35,490 |
| Washington | 200 | 0.06 | 0.63 | $ 17.04 | $ 35,450 |
| Maryland | 400 | 0.16 | 1.59 | $ 16.95 | $ 35,250 |
| Massachusetts | 310 | 0.09 | 0.93 | $ 16.08 | $ 33,450 |
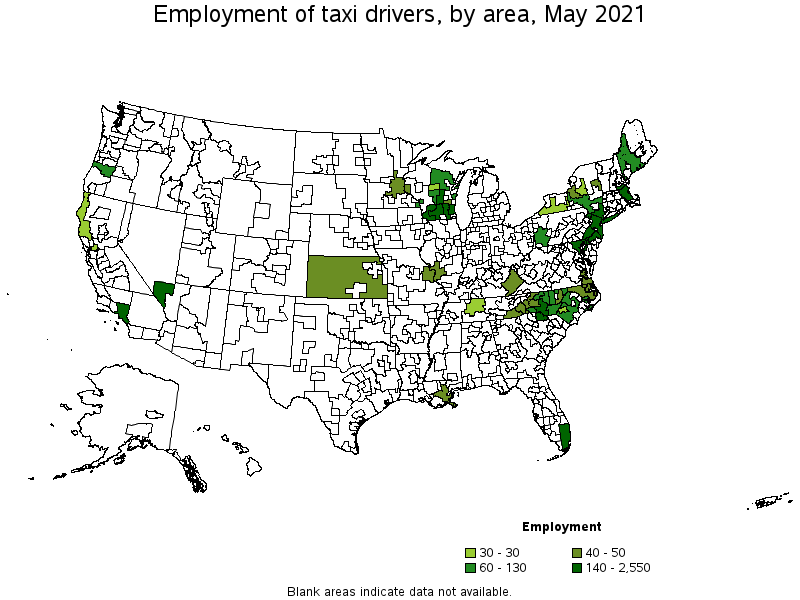
Metropolitan areas with the highest employment level in Taxi Drivers:
| Metropolitan area | Employment (1) | Employment per thousand jobs | Location quotient (9) | Hourly mean wage | Annual mean wage (2) |
|---|---|---|---|---|---|
| Las Vegas-Henderson-Paradise, NV | 2,550 | 2.77 | 27.99 | $ 15.09 | $ 31,400 |
| New York-Newark-Jersey City, NY-NJ-PA | 850 | 0.10 | 0.99 | $ 17.22 | $ 35,820 |
| Miami-Fort Lauderdale-West Palm Beach, FL | 560 | 0.23 | 2.28 | $ 14.46 | $ 30,080 |
| Philadelphia-Camden-Wilmington, PA-NJ-DE-MD | 390 | 0.15 | 1.48 | $ 14.35 | $ 29,840 |
| Milwaukee-Waukesha-West Allis, WI | 370 | 0.47 | 4.76 | $ 13.82 | $ 28,740 |
| Baltimore-Columbia-Towson, MD | 310 | 0.25 | 2.49 | $ 16.75 | $ 34,830 |
| Boston-Cambridge-Nashua, MA-NH | 250 | 0.10 | 0.96 | $ 16.12 | $ 33,520 |
| Madison, WI | 200 | 0.53 | 5.34 | $ 13.89 | $ 28,890 |
| Charlotte-Concord-Gastonia, NC-SC | 180 | 0.14 | 1.46 | $ 13.91 | $ 28,940 |
| Los Angeles-Long Beach-Anaheim, CA | 140 | 0.02 | 0.24 | $ 16.18 | $ 33,650 |
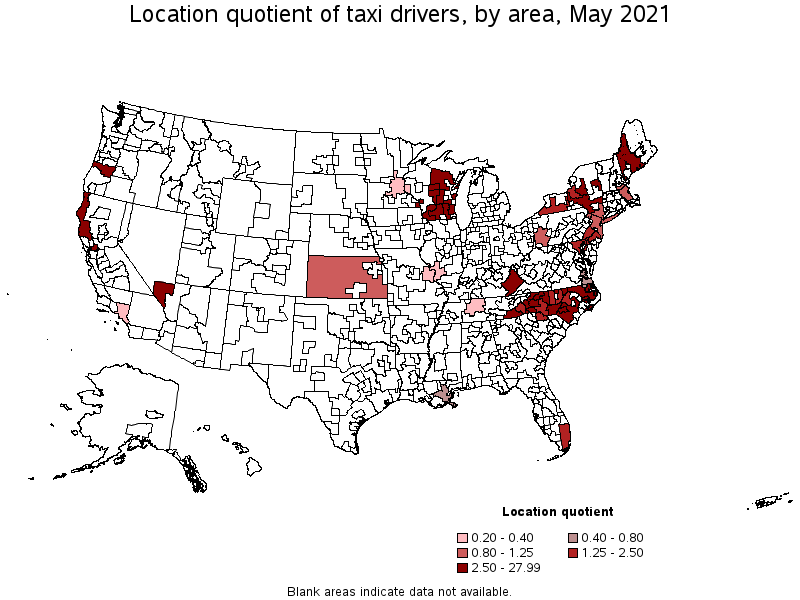
Metropolitan areas with the highest concentration of jobs and location quotients in Taxi Drivers:
| Metropolitan area | Employment (1) | Employment per thousand jobs | Location quotient (9) | Hourly mean wage | Annual mean wage (2) |
|---|---|---|---|---|---|
| Las Vegas-Henderson-Paradise, NV | 2,550 | 2.77 | 27.99 | $ 15.09 | $ 31,400 |
| Fond du Lac, WI | 50 | 1.11 | 11.16 | $ 11.64 | $ 24,200 |
| La Crosse-Onalaska, WI-MN | 70 | 1.03 | 10.36 | $ 11.51 | $ 23,940 |
| Glens Falls, NY | 40 | 0.78 | 7.89 | $ 13.57 | $ 28,230 |
| Madison, WI | 200 | 0.53 | 5.34 | $ 13.89 | $ 28,890 |
| Milwaukee-Waukesha-West Allis, WI | 370 | 0.47 | 4.76 | $ 13.82 | $ 28,740 |
| Wausau, WI | 30 | 0.47 | 4.71 | $ 12.95 | $ 26,940 |
| Eugene, OR | 60 | 0.39 | 3.91 | $ 14.43 | $ 30,020 |
| Hickory-Lenoir-Morganton, NC | 50 | 0.33 | 3.32 | $ 12.85 | $ 26,720 |
| Utica-Rome, NY | 30 | 0.28 | 2.82 | $ 14.29 | $ 29,730 |
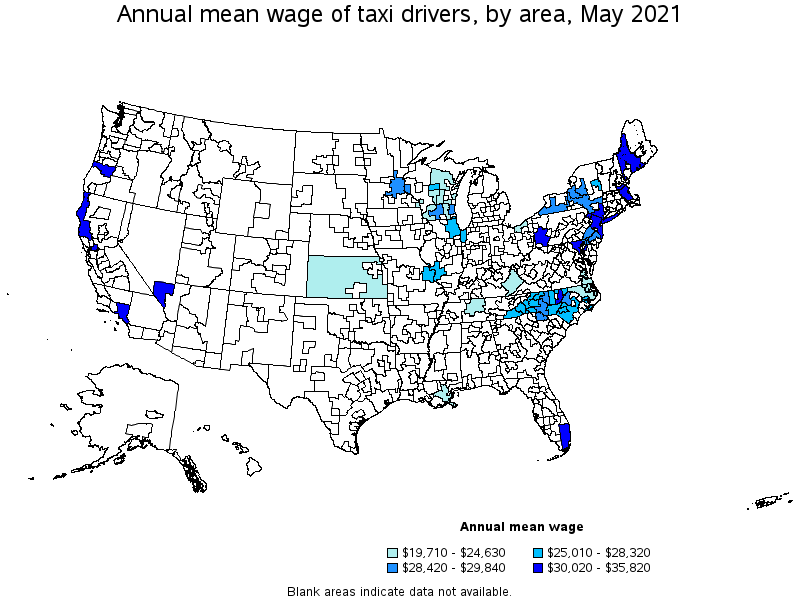
Top paying metropolitan areas for Taxi Drivers:
| Metropolitan area | Employment (1) | Employment per thousand jobs | Location quotient (9) | Hourly mean wage | Annual mean wage (2) |
|---|---|---|---|---|---|
| New York-Newark-Jersey City, NY-NJ-PA | 850 | 0.10 | 0.99 | $ 17.22 | $ 35,820 |
| Baltimore-Columbia-Towson, MD | 310 | 0.25 | 2.49 | $ 16.75 | $ 34,830 |
| Los Angeles-Long Beach-Anaheim, CA | 140 | 0.02 | 0.24 | $ 16.18 | $ 33,650 |
| Boston-Cambridge-Nashua, MA-NH | 250 | 0.10 | 0.96 | $ 16.12 | $ 33,520 |
| Vallejo-Fairfield, CA | 30 | 0.25 | 2.53 | $ 15.31 | $ 31,840 |
| Durham-Chapel Hill, NC | 50 | 0.17 | 1.71 | $ 15.16 | $ 31,540 |
| Las Vegas-Henderson-Paradise, NV | 2,550 | 2.77 | 27.99 | $ 15.09 | $ 31,400 |
| Pittsburgh, PA | 130 | 0.12 | 1.24 | $ 14.95 | $ 31,090 |
| Miami-Fort Lauderdale-West Palm Beach, FL | 560 | 0.23 | 2.28 | $ 14.46 | $ 30,080 |
| Eugene, OR | 60 | 0.39 | 3.91 | $ 14.43 | $ 30,020 |
Nonmetropolitan areas with the highest employment in Taxi Drivers:
| Nonmetropolitan area | Employment (1) | Employment per thousand jobs | Location quotient (9) | Hourly mean wage | Annual mean wage (2) |
|---|---|---|---|---|---|
| South Central Wisconsin nonmetropolitan area | 170 | 0.85 | 8.60 | $ 11.69 | $ 24,320 |
| Northeastern Wisconsin nonmetropolitan area | 110 | 0.58 | 5.84 | $ 10.90 | $ 22,670 |
| Southwest Maine nonmetropolitan area | 80 | 0.42 | 4.26 | $ 14.46 | $ 30,080 |
| Central East New York nonmetropolitan area | 70 | 0.49 | 4.98 | $ 13.78 | $ 28,650 |
| Piedmont North Carolina nonmetropolitan area | 70 | 0.29 | 2.95 | $ 12.59 | $ 26,190 |
Nonmetropolitan areas with the highest concentration of jobs and location quotients in Taxi Drivers:
| Nonmetropolitan area | Employment (1) | Employment per thousand jobs | Location quotient (9) | Hourly mean wage | Annual mean wage (2) |
|---|---|---|---|---|---|
| South Central Wisconsin nonmetropolitan area | 170 | 0.85 | 8.60 | $ 11.69 | $ 24,320 |
| Northeastern Wisconsin nonmetropolitan area | 110 | 0.58 | 5.84 | $ 10.90 | $ 22,670 |
| Central East New York nonmetropolitan area | 70 | 0.49 | 4.98 | $ 13.78 | $ 28,650 |
| East Kentucky nonmetropolitan area | 40 | 0.43 | 4.34 | $ 10.07 | $ 20,940 |
| Northeast Coastal North Carolina nonmetropolitan area | 40 | 0.42 | 4.27 | $ 11.59 | $ 24,120 |
Top paying nonmetropolitan areas for Taxi Drivers:
| Nonmetropolitan area | Employment (1) | Employment per thousand jobs | Location quotient (9) | Hourly mean wage | Annual mean wage (2) |
|---|---|---|---|---|---|
| North Coast Region of California nonmetropolitan area | 30 | 0.35 | 3.49 | $ 14.46 | $ 30,080 |
| Southwest Maine nonmetropolitan area | 80 | 0.42 | 4.26 | $ 14.46 | $ 30,080 |
| Southwest New York nonmetropolitan area | 30 | 0.21 | 2.09 | $ 13.95 | $ 29,020 |
| Central East New York nonmetropolitan area | 70 | 0.49 | 4.98 | $ 13.78 | $ 28,650 |
| Mountain North Carolina nonmetropolitan area | 40 | 0.29 | 2.94 | $ 13.20 | $ 27,460 |
These estimates are calculated with data collected from employers in all industry sectors, all metropolitan and nonmetropolitan areas, and all states and the District of Columbia. The top employment and wage figures are provided above. The complete list is available in the downloadable XLS files.
The percentile wage estimate is the value of a wage below which a certain percent of workers fall. The median wage is the 50th percentile wage estimate—50 percent of workers earn less than the median and 50 percent of workers earn more than the median. More about percentile wages.
(1) Estimates for detailed occupations do not sum to the totals because the totals include occupations not shown separately. Estimates do not include self-employed workers.
(2) Annual wages have been calculated by multiplying the hourly mean wage by a "year-round, full-time" hours figure of 2,080 hours; for those occupations where there is not an hourly wage published, the annual wage has been directly calculated from the reported survey data.
(3) The relative standard error (RSE) is a measure of the reliability of a survey statistic. The smaller the relative standard error, the more precise the estimate.
(7) The value is less than .005 percent of industry employment.
(8) Estimate not released.
(9) The location quotient is the ratio of the area concentration of occupational employment to the national average concentration. A location quotient greater than one indicates the occupation has a higher share of employment than average, and a location quotient less than one indicates the occupation is less prevalent in the area than average.
Other OEWS estimates and related information:
May 2021 National Occupational Employment and Wage Estimates
May 2021 State Occupational Employment and Wage Estimates
May 2021 Metropolitan and Nonmetropolitan Area Occupational Employment and Wage Estimates
May 2021 National Industry-Specific Occupational Employment and Wage Estimates
Last Modified Date: March 31, 2022