
An official website of the United States government
An official website of the United States government
The .gov means it's official.
Federal government websites often end in .gov or .mil. Before sharing sensitive information,
make sure you're on a federal government site.
The site is secure.
The
https:// ensures that you are connecting to the official website and that any
information you provide is encrypted and transmitted securely.
All motor vehicle operators not listed separately.
Employment estimate and mean wage estimates for Motor Vehicle Operators, All Other:
| Employment (1) | Employment RSE (3) |
Mean hourly wage |
Mean annual wage (2) |
Wage RSE (3) |
|---|---|---|---|---|
| 48,690 | 3.3 % | $ 17.51 | $ 36,410 | 1.7 % |
Percentile wage estimates for Motor Vehicle Operators, All Other:
| Percentile | 10% | 25% | 50% (Median) |
75% | 90% |
|---|---|---|---|---|---|
| Hourly Wage | $ 9.84 | $ 11.88 | $ 14.71 | $ 22.01 | $ 28.67 |
| Annual Wage (2) | $ 20,470 | $ 24,710 | $ 30,600 | $ 45,790 | $ 59,640 |
Industries with the highest published employment and wages for Motor Vehicle Operators, All Other are provided. For a list of all industries with employment in Motor Vehicle Operators, All Other, see the Create Customized Tables function.
Industries with the highest levels of employment in Motor Vehicle Operators, All Other:
| Industry | Employment (1) | Percent of industry employment | Hourly mean wage | Annual mean wage (2) |
|---|---|---|---|---|
| Automobile Dealers | 8,390 | 0.69 | $ 13.37 | $ 27,820 |
| Federal Executive Branch (OEWS Designation) | 4,870 | 0.23 | $ 25.02 | $ 52,040 |
| Automotive Equipment Rental and Leasing | 4,440 | 2.50 | $ 14.13 | $ 29,390 |
| Services to Buildings and Dwellings | 3,330 | 0.15 | $ 21.17 | $ 44,020 |
| Employment Services | 2,070 | 0.06 | $ 15.00 | $ 31,190 |
Industries with the highest concentration of employment in Motor Vehicle Operators, All Other:
| Industry | Employment (1) | Percent of industry employment | Hourly mean wage | Annual mean wage (2) |
|---|---|---|---|---|
| Automotive Equipment Rental and Leasing | 4,440 | 2.50 | $ 14.13 | $ 29,390 |
| Support Activities for Road Transportation | 1,600 | 1.51 | $ 21.38 | $ 44,470 |
| Support Activities for Water Transportation | 1,120 | 1.25 | $ 28.87 | $ 60,050 |
| Support Activities for Rail Transportation | 340 | 1.03 | $ 18.87 | $ 39,240 |
| Other Support Activities for Transportation | 340 | 1.03 | $ 14.95 | $ 31,100 |
Top paying industries for Motor Vehicle Operators, All Other:
| Industry | Employment (1) | Percent of industry employment | Hourly mean wage | Annual mean wage (2) |
|---|---|---|---|---|
| Electric Power Generation, Transmission and Distribution | (8) | (8) | $ 43.01 | $ 89,450 |
| Management, Scientific, and Technical Consulting Services | (8) | (8) | $ 30.80 | $ 64,050 |
| Support Activities for Water Transportation | 1,120 | 1.25 | $ 28.87 | $ 60,050 |
| Waste Treatment and Disposal | (8) | (8) | $ 26.20 | $ 54,500 |
| State Government, excluding schools and hospitals (OEWS Designation) | 1,340 | 0.06 | $ 25.86 | $ 53,780 |
States and areas with the highest published employment, location quotients, and wages for Motor Vehicle Operators, All Other are provided. For a list of all areas with employment in Motor Vehicle Operators, All Other, see the Create Customized Tables function.
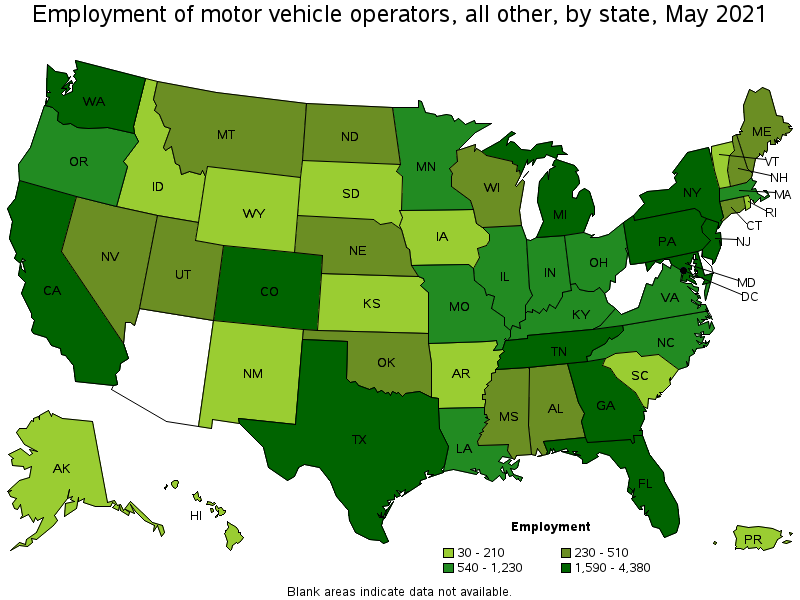
States with the highest employment level in Motor Vehicle Operators, All Other:
| State | Employment (1) | Employment per thousand jobs | Location quotient (9) | Hourly mean wage | Annual mean wage (2) |
|---|---|---|---|---|---|
| Florida | 4,380 | 0.51 | 1.47 | $ 12.72 | $ 26,470 |
| California | 3,740 | 0.23 | 0.65 | $ 25.16 | $ 52,340 |
| Texas | 3,110 | 0.25 | 0.73 | $ 14.42 | $ 29,990 |
| Maryland | 3,030 | 1.19 | 3.44 | $ 17.98 | $ 37,390 |
| Colorado | 2,740 | 1.04 | 3.02 | $ 16.26 | $ 33,810 |
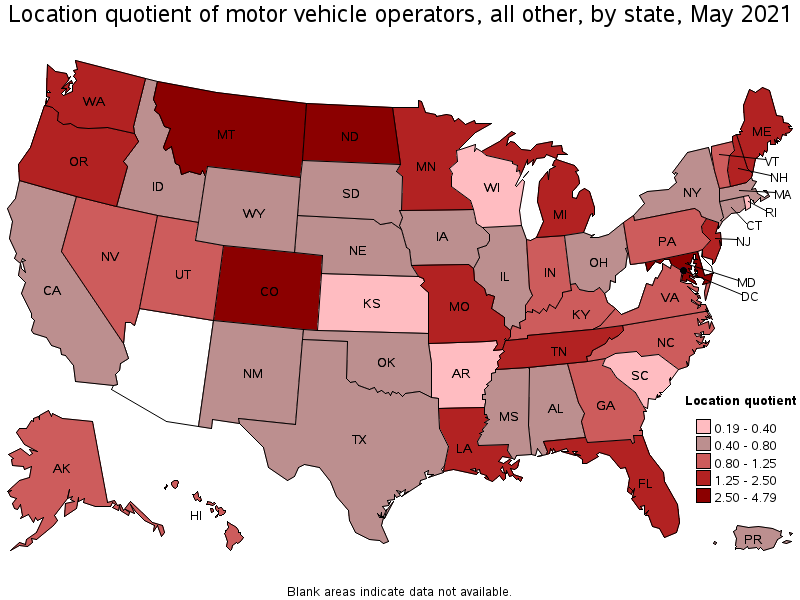
States with the highest concentration of jobs and location quotients in Motor Vehicle Operators, All Other:
| State | Employment (1) | Employment per thousand jobs | Location quotient (9) | Hourly mean wage | Annual mean wage (2) |
|---|---|---|---|---|---|
| District of Columbia | 1,100 | 1.66 | 4.79 | $ 28.97 | $ 60,260 |
| Maryland | 3,030 | 1.19 | 3.44 | $ 17.98 | $ 37,390 |
| Montana | 510 | 1.08 | 3.12 | $ 17.01 | $ 35,380 |
| Colorado | 2,740 | 1.04 | 3.02 | $ 16.26 | $ 33,810 |
| North Dakota | 390 | 1.00 | 2.88 | $ 14.77 | $ 30,710 |
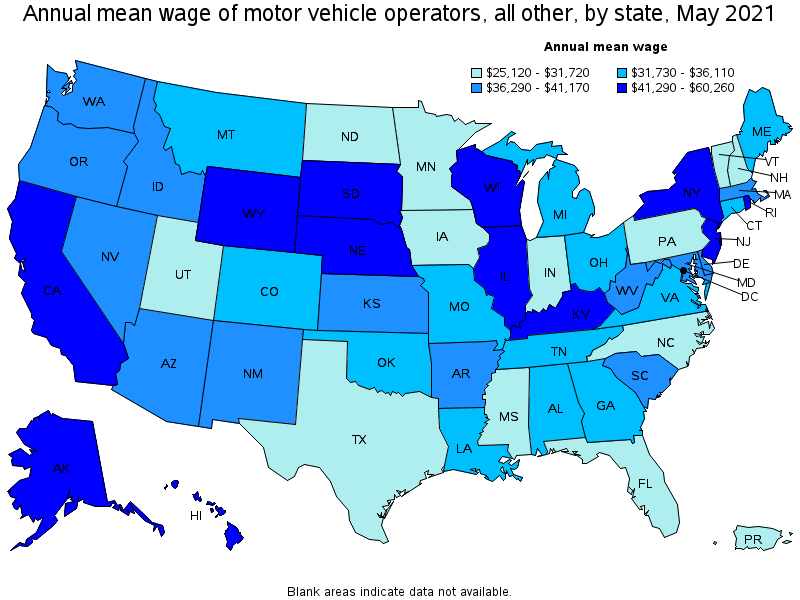
Top paying states for Motor Vehicle Operators, All Other:
| State | Employment (1) | Employment per thousand jobs | Location quotient (9) | Hourly mean wage | Annual mean wage (2) |
|---|---|---|---|---|---|
| District of Columbia | 1,100 | 1.66 | 4.79 | $ 28.97 | $ 60,260 |
| Alaska | 110 | 0.37 | 1.07 | $ 27.74 | $ 57,700 |
| California | 3,740 | 0.23 | 0.65 | $ 25.16 | $ 52,340 |
| Hawaii | 210 | 0.39 | 1.11 | $ 24.39 | $ 50,740 |
| Nebraska | 250 | 0.26 | 0.76 | $ 23.95 | $ 49,820 |
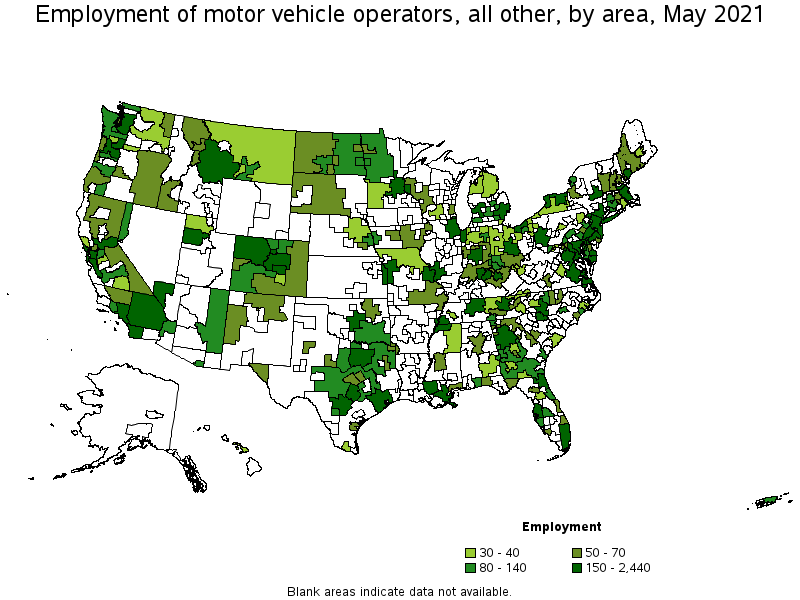
Metropolitan areas with the highest employment level in Motor Vehicle Operators, All Other:
| Metropolitan area | Employment (1) | Employment per thousand jobs | Location quotient (9) | Hourly mean wage | Annual mean wage (2) |
|---|---|---|---|---|---|
| New York-Newark-Jersey City, NY-NJ-PA | 2,440 | 0.28 | 0.81 | $ 23.37 | $ 48,600 |
| Washington-Arlington-Alexandria, DC-VA-MD-WV | 2,290 | 0.78 | 2.26 | $ 23.02 | $ 47,880 |
| Baltimore-Columbia-Towson, MD | 1,970 | 1.57 | 4.55 | $ 18.75 | $ 38,990 |
| Denver-Aurora-Lakewood, CO | 1,570 | 1.07 | 3.10 | $ 16.67 | $ 34,670 |
| Miami-Fort Lauderdale-West Palm Beach, FL | 1,140 | 0.46 | 1.34 | $ 13.54 | $ 28,160 |
| Los Angeles-Long Beach-Anaheim, CA | 1,010 | 0.18 | 0.51 | $ 23.73 | $ 49,360 |
| Detroit-Warren-Dearborn, MI | 970 | 0.54 | 1.56 | $ 16.56 | $ 34,440 |
| Philadelphia-Camden-Wilmington, PA-NJ-DE-MD | 910 | 0.34 | 0.99 | $ 15.60 | $ 32,450 |
| Portland-Vancouver-Hillsboro, OR-WA | 850 | 0.76 | 2.20 | $ 19.69 | $ 40,950 |
| Minneapolis-St. Paul-Bloomington, MN-WI | 850 | 0.47 | 1.35 | $ 15.08 | $ 31,370 |
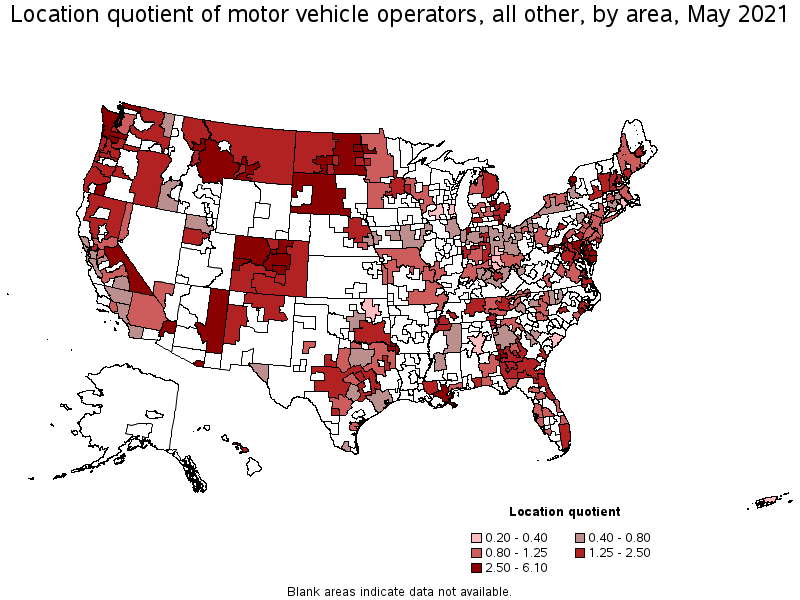
Metropolitan areas with the highest concentration of jobs and location quotients in Motor Vehicle Operators, All Other:
| Metropolitan area | Employment (1) | Employment per thousand jobs | Location quotient (9) | Hourly mean wage | Annual mean wage (2) |
|---|---|---|---|---|---|
| Watertown-Fort Drum, NY | 80 | 2.11 | 6.10 | $ 19.70 | $ 40,980 |
| Jacksonville, NC | 80 | 1.70 | 4.91 | $ 24.40 | $ 50,760 |
| Baltimore-Columbia-Towson, MD | 1,970 | 1.57 | 4.55 | $ 18.75 | $ 38,990 |
| Billings, MT | 130 | 1.54 | 4.44 | $ 15.00 | $ 31,190 |
| Chambersburg-Waynesboro, PA | 90 | 1.53 | 4.41 | $ 21.97 | $ 45,700 |
| Bismarck, ND | 90 | 1.28 | 3.70 | $ 15.02 | $ 31,240 |
| Greeley, CO | 120 | 1.20 | 3.47 | $ 16.27 | $ 33,850 |
| Monroe, MI | 40 | 1.17 | 3.40 | $ 17.31 | $ 36,000 |
| Saginaw, MI | 90 | 1.13 | 3.28 | $ 15.97 | $ 33,220 |
| Missoula, MT | 70 | 1.10 | 3.20 | $ 16.21 | $ 33,720 |
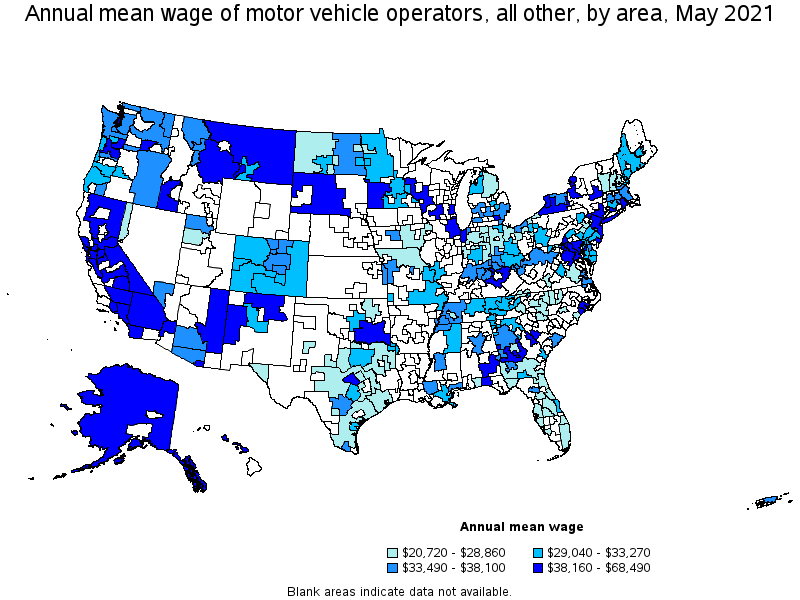
Top paying metropolitan areas for Motor Vehicle Operators, All Other:
| Metropolitan area | Employment (1) | Employment per thousand jobs | Location quotient (9) | Hourly mean wage | Annual mean wage (2) |
|---|---|---|---|---|---|
| Vallejo-Fairfield, CA | 60 | 0.50 | 1.45 | $ 32.93 | $ 68,490 |
| San Jose-Sunnyvale-Santa Clara, CA | 210 | 0.20 | 0.56 | $ 30.58 | $ 63,600 |
| Stockton-Lodi, CA | 80 | 0.32 | 0.92 | $ 27.22 | $ 56,610 |
| San Francisco-Oakland-Hayward, CA | 520 | 0.23 | 0.67 | $ 26.90 | $ 55,940 |
| Bremerton-Silverdale, WA | 60 | 0.75 | 2.17 | $ 26.35 | $ 54,800 |
| Urban Honolulu, HI | (8) | (8) | (8) | $ 25.96 | $ 53,990 |
| Riverside-San Bernardino-Ontario, CA | 440 | 0.29 | 0.84 | $ 25.81 | $ 53,690 |
| Milwaukee-Waukesha-West Allis, WI | 60 | 0.07 | 0.21 | $ 25.60 | $ 53,240 |
| Fresno, CA | 110 | 0.28 | 0.81 | $ 24.56 | $ 51,080 |
| Jacksonville, NC | 80 | 1.70 | 4.91 | $ 24.40 | $ 50,760 |
Nonmetropolitan areas with the highest employment in Motor Vehicle Operators, All Other:
| Nonmetropolitan area | Employment (1) | Employment per thousand jobs | Location quotient (9) | Hourly mean wage | Annual mean wage (2) |
|---|---|---|---|---|---|
| Southwest Montana nonmetropolitan area | 200 | 1.43 | 4.13 | $ 18.77 | $ 39,050 |
| Northwest Colorado nonmetropolitan area | 180 | 1.56 | 4.52 | $ 14.04 | $ 29,190 |
| Western Washington nonmetropolitan area | 120 | 1.03 | 2.98 | $ 16.33 | $ 33,970 |
| Hill Country Region of Texas nonmetropolitan area | 110 | 0.59 | 1.70 | $ 11.84 | $ 24,630 |
| South Georgia nonmetropolitan area | 100 | 0.52 | 1.52 | $ 13.75 | $ 28,600 |
Nonmetropolitan areas with the highest concentration of jobs and location quotients in Motor Vehicle Operators, All Other:
| Nonmetropolitan area | Employment (1) | Employment per thousand jobs | Location quotient (9) | Hourly mean wage | Annual mean wage (2) |
|---|---|---|---|---|---|
| Northwest Colorado nonmetropolitan area | 180 | 1.56 | 4.52 | $ 14.04 | $ 29,190 |
| Maryland nonmetropolitan area | 80 | 1.48 | 4.29 | $ 14.85 | $ 30,890 |
| East North Dakota nonmetropolitan area | 90 | 1.43 | 4.15 | $ 16.40 | $ 34,110 |
| Southwest Montana nonmetropolitan area | 200 | 1.43 | 4.13 | $ 18.77 | $ 39,050 |
| Western Washington nonmetropolitan area | 120 | 1.03 | 2.98 | $ 16.33 | $ 33,970 |
Top paying nonmetropolitan areas for Motor Vehicle Operators, All Other:
| Nonmetropolitan area | Employment (1) | Employment per thousand jobs | Location quotient (9) | Hourly mean wage | Annual mean wage (2) |
|---|---|---|---|---|---|
| Alaska nonmetropolitan area | (8) | (8) | (8) | $ 24.70 | $ 51,380 |
| Eastern Sierra-Mother Lode Region of California nonmetropolitan area | 50 | 0.91 | 2.64 | $ 24.41 | $ 50,780 |
| North Valley-Northern Mountains Region of California nonmetropolitan area | 60 | 0.60 | 1.75 | $ 23.17 | $ 48,190 |
| Western Wisconsin nonmetropolitan area | 50 | 0.35 | 1.02 | $ 22.94 | $ 47,710 |
| Northern New Mexico nonmetropolitan area | 50 | 0.67 | 1.93 | $ 22.59 | $ 46,990 |
These estimates are calculated with data collected from employers in all industry sectors, all metropolitan and nonmetropolitan areas, and all states and the District of Columbia. The top employment and wage figures are provided above. The complete list is available in the downloadable XLS files.
The percentile wage estimate is the value of a wage below which a certain percent of workers fall. The median wage is the 50th percentile wage estimate—50 percent of workers earn less than the median and 50 percent of workers earn more than the median. More about percentile wages.
(1) Estimates for detailed occupations do not sum to the totals because the totals include occupations not shown separately. Estimates do not include self-employed workers.
(2) Annual wages have been calculated by multiplying the hourly mean wage by a "year-round, full-time" hours figure of 2,080 hours; for those occupations where there is not an hourly wage published, the annual wage has been directly calculated from the reported survey data.
(3) The relative standard error (RSE) is a measure of the reliability of a survey statistic. The smaller the relative standard error, the more precise the estimate.
(8) Estimate not released.
(9) The location quotient is the ratio of the area concentration of occupational employment to the national average concentration. A location quotient greater than one indicates the occupation has a higher share of employment than average, and a location quotient less than one indicates the occupation is less prevalent in the area than average.
Other OEWS estimates and related information:
May 2021 National Occupational Employment and Wage Estimates
May 2021 State Occupational Employment and Wage Estimates
May 2021 Metropolitan and Nonmetropolitan Area Occupational Employment and Wage Estimates
May 2021 National Industry-Specific Occupational Employment and Wage Estimates
Last Modified Date: March 31, 2022