
An official website of the United States government
An official website of the United States government
The .gov means it's official.
Federal government websites often end in .gov or .mil. Before sharing sensitive information,
make sure you're on a federal government site.
The site is secure.
The
https:// ensures that you are connecting to the official website and that any
information you provide is encrypted and transmitted securely.
Drive electric, diesel-electric, steam, or gas-turbine-electric locomotives to transport passengers or freight. Interpret train orders, electronic or manual signals, and railroad rules and regulations. Excludes �Engineers� (17-2011 through 17-2199).
Employment estimate and mean wage estimates for Locomotive Engineers:
| Employment (1) | Employment RSE (3) |
Mean hourly wage |
Mean annual wage (2) |
Wage RSE (3) |
|---|---|---|---|---|
| 38,980 | 1.3 % | $ 35.07 | $ 72,940 | 1.0 % |
Percentile wage estimates for Locomotive Engineers:
| Percentile | 10% | 25% | 50% (Median) |
75% | 90% |
|---|---|---|---|---|---|
| Hourly Wage | $ 23.45 | $ 30.01 | $ 38.34 | $ 39.45 | $ 40.44 |
| Annual Wage (2) | $ 48,780 | $ 62,410 | $ 79,740 | $ 82,050 | $ 84,120 |
Industries with the highest published employment and wages for Locomotive Engineers are provided. For a list of all industries with employment in Locomotive Engineers, see the Create Customized Tables function.
Industries with the highest levels of employment in Locomotive Engineers:
| Industry | Employment (1) | Percent of industry employment | Hourly mean wage | Annual mean wage (2) |
|---|---|---|---|---|
| Rail Transportation | 37,480 | 17.05 | $ 35.33 | $ 73,490 |
| Support Activities for Rail Transportation | 400 | 1.22 | $ 22.42 | $ 46,640 |
| Local Government, excluding schools and hospitals (OEWS Designation) | 160 | 0.00 | $ 36.53 | $ 75,980 |
| State Government, excluding schools and hospitals (OEWS Designation) | 110 | 0.00 | $ 40.94 | $ 85,150 |
| Scenic and Sightseeing Transportation, Land | 60 | 0.82 | $ 20.01 | $ 41,630 |
Industries with the highest concentration of employment in Locomotive Engineers:
| Industry | Employment (1) | Percent of industry employment | Hourly mean wage | Annual mean wage (2) |
|---|---|---|---|---|
| Rail Transportation | 37,480 | 17.05 | $ 35.33 | $ 73,490 |
| Support Activities for Rail Transportation | 400 | 1.22 | $ 22.42 | $ 46,640 |
| Scenic and Sightseeing Transportation, Land | 60 | 0.82 | $ 20.01 | $ 41,630 |
| Iron and Steel Mills and Ferroalloy Manufacturing | 50 | 0.06 | $ 35.36 | $ 73,550 |
| Farm Product Raw Material Merchant Wholesalers | 30 | 0.05 | $ 38.16 | $ 79,370 |
Top paying industries for Locomotive Engineers:
| Industry | Employment (1) | Percent of industry employment | Hourly mean wage | Annual mean wage (2) |
|---|---|---|---|---|
| State Government, excluding schools and hospitals (OEWS Designation) | 110 | (7) | $ 40.94 | $ 85,150 |
| Farm Product Raw Material Merchant Wholesalers | 30 | 0.05 | $ 38.16 | $ 79,370 |
| Local Government, excluding schools and hospitals (OEWS Designation) | 160 | (7) | $ 36.53 | $ 75,980 |
| Iron and Steel Mills and Ferroalloy Manufacturing | 50 | 0.06 | $ 35.36 | $ 73,550 |
| Rail Transportation | 37,480 | 17.05 | $ 35.33 | $ 73,490 |
States and areas with the highest published employment, location quotients, and wages for Locomotive Engineers are provided. For a list of all areas with employment in Locomotive Engineers, see the Create Customized Tables function.
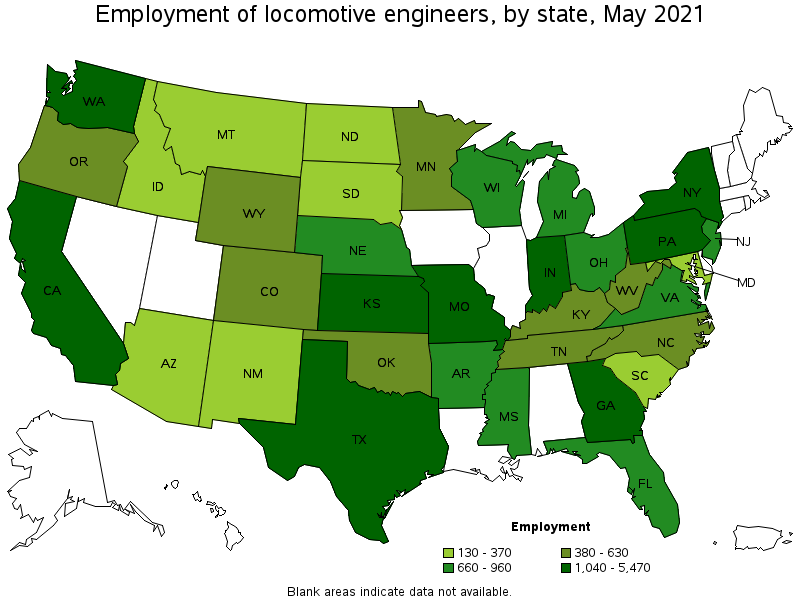
States with the highest employment level in Locomotive Engineers:
| State | Employment (1) | Employment per thousand jobs | Location quotient (9) | Hourly mean wage | Annual mean wage (2) |
|---|---|---|---|---|---|
| Texas | 5,470 | 0.45 | 1.62 | $ 36.60 | $ 76,120 |
| New York | 2,420 | 0.28 | 1.01 | $ 34.15 | $ 71,040 |
| California | 1,940 | 0.12 | 0.42 | $ 36.88 | $ 76,710 |
| Pennsylvania | 1,800 | 0.32 | 1.16 | $ 29.93 | $ 62,250 |
| Georgia | 1,540 | 0.35 | 1.27 | $ 36.69 | $ 76,320 |
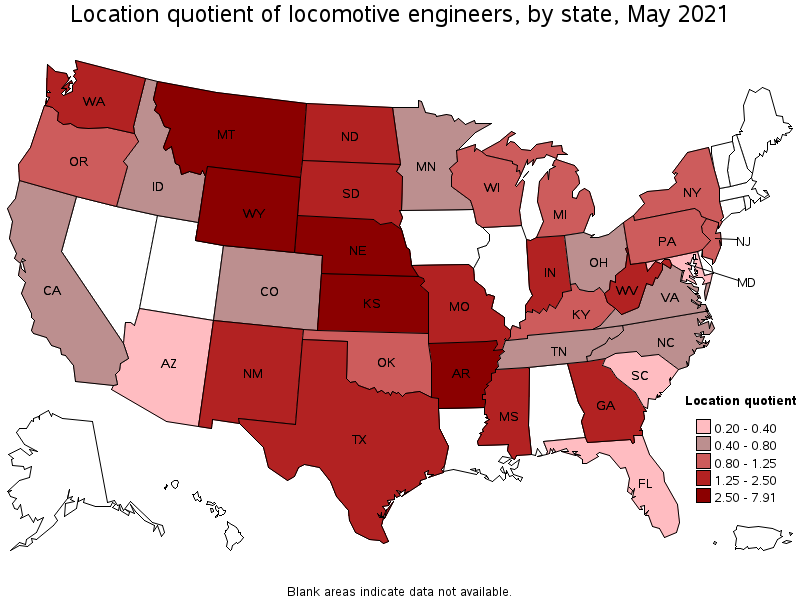
States with the highest concentration of jobs and location quotients in Locomotive Engineers:
| State | Employment (1) | Employment per thousand jobs | Location quotient (9) | Hourly mean wage | Annual mean wage (2) |
|---|---|---|---|---|---|
| Wyoming | 570 | 2.19 | 7.91 | $ 40.28 | $ 83,780 |
| Nebraska | 880 | 0.92 | 3.32 | $ 37.41 | $ 77,810 |
| Kansas | 1,220 | 0.91 | 3.29 | $ 35.10 | $ 73,010 |
| Montana | 370 | 0.78 | 2.81 | $ 37.40 | $ 77,790 |
| Arkansas | 830 | 0.69 | 2.51 | $ 35.40 | $ 73,630 |
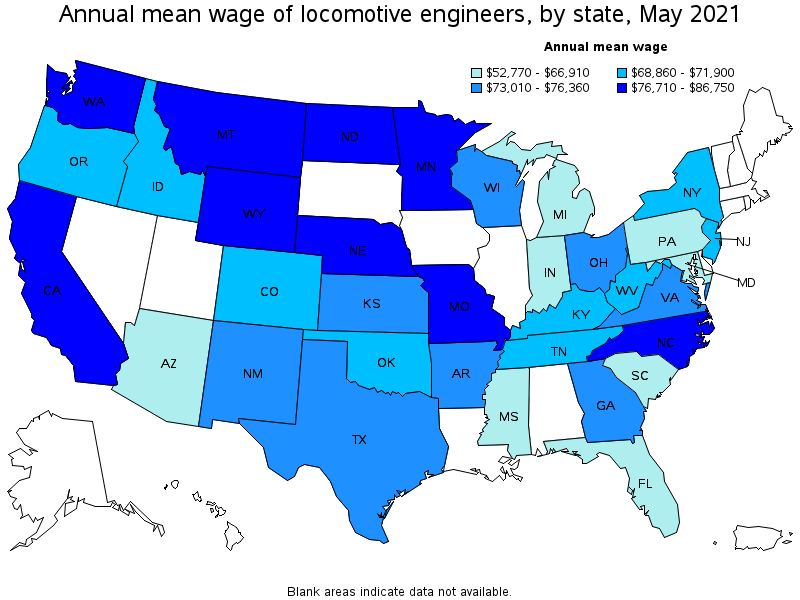
Top paying states for Locomotive Engineers:
| State | Employment (1) | Employment per thousand jobs | Location quotient (9) | Hourly mean wage | Annual mean wage (2) |
|---|---|---|---|---|---|
| Washington | 1,320 | 0.41 | 1.49 | $ 41.71 | $ 86,750 |
| Wyoming | 570 | 2.19 | 7.91 | $ 40.28 | $ 83,780 |
| North Dakota | 260 | 0.66 | 2.38 | $ 39.49 | $ 82,140 |
| Missouri | 1,040 | 0.38 | 1.38 | $ 39.10 | $ 81,340 |
| North Carolina | 530 | 0.12 | 0.44 | $ 37.86 | $ 78,750 |
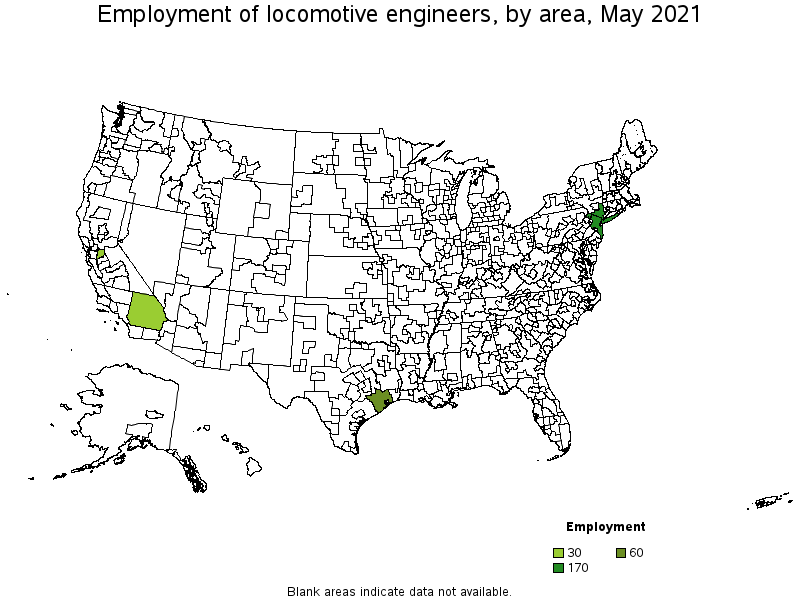
Metropolitan areas with the highest employment level in Locomotive Engineers:
| Metropolitan area | Employment (1) | Employment per thousand jobs | Location quotient (9) | Hourly mean wage | Annual mean wage (2) |
|---|---|---|---|---|---|
| New York-Newark-Jersey City, NY-NJ-PA | 170 | 0.02 | 0.07 | $ 34.56 | $ 71,880 |
| Houston-The Woodlands-Sugar Land, TX | 60 | 0.02 | 0.08 | $ 20.71 | $ 43,070 |
| Stockton-Lodi, CA | 30 | 0.14 | 0.49 | $ 30.90 | $ 64,270 |
| Riverside-San Bernardino-Ontario, CA | 30 | 0.02 | 0.07 | $ 20.15 | $ 41,910 |
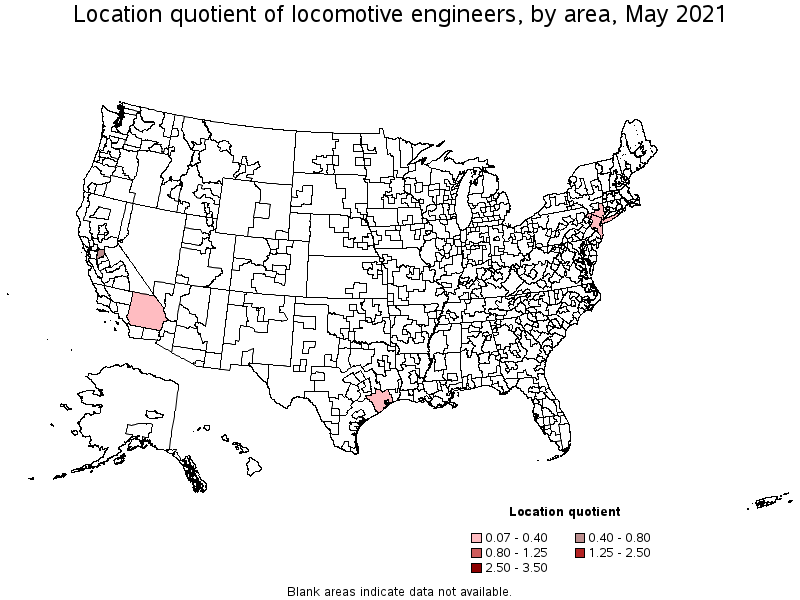
Metropolitan areas with the highest concentration of jobs and location quotients in Locomotive Engineers:
| Metropolitan area | Employment (1) | Employment per thousand jobs | Location quotient (9) | Hourly mean wage | Annual mean wage (2) |
|---|---|---|---|---|---|
| Stockton-Lodi, CA | 30 | 0.14 | 0.49 | $ 30.90 | $ 64,270 |
| Houston-The Woodlands-Sugar Land, TX | 60 | 0.02 | 0.08 | $ 20.71 | $ 43,070 |
| New York-Newark-Jersey City, NY-NJ-PA | 170 | 0.02 | 0.07 | $ 34.56 | $ 71,880 |
| Riverside-San Bernardino-Ontario, CA | 30 | 0.02 | 0.07 | $ 20.15 | $ 41,910 |
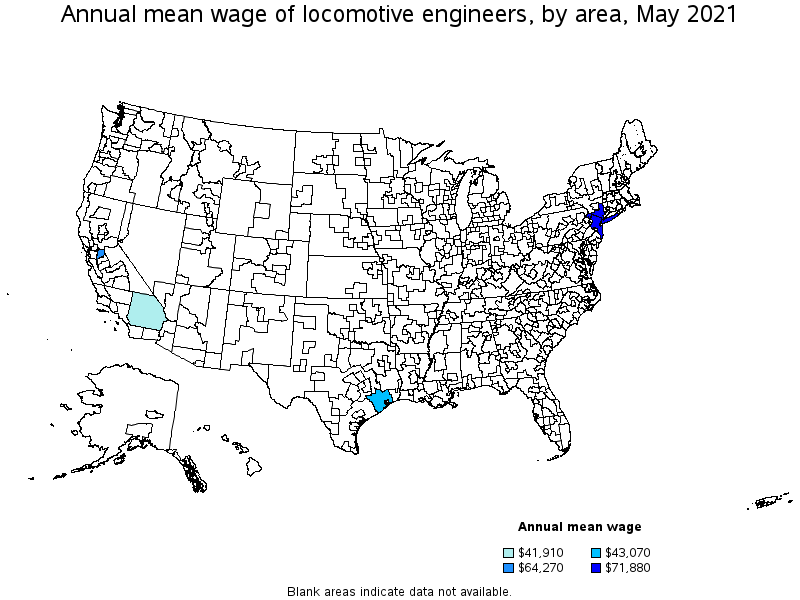
Top paying metropolitan areas for Locomotive Engineers:
| Metropolitan area | Employment (1) | Employment per thousand jobs | Location quotient (9) | Hourly mean wage | Annual mean wage (2) |
|---|---|---|---|---|---|
| New York-Newark-Jersey City, NY-NJ-PA | 170 | 0.02 | 0.07 | $ 34.56 | $ 71,880 |
| Stockton-Lodi, CA | 30 | 0.14 | 0.49 | $ 30.90 | $ 64,270 |
| Houston-The Woodlands-Sugar Land, TX | 60 | 0.02 | 0.08 | $ 20.71 | $ 43,070 |
| Riverside-San Bernardino-Ontario, CA | 30 | 0.02 | 0.07 | $ 20.15 | $ 41,910 |
These estimates are calculated with data collected from employers in all industry sectors, all metropolitan and nonmetropolitan areas, and all states and the District of Columbia. The top employment and wage figures are provided above. The complete list is available in the downloadable XLS files.
The percentile wage estimate is the value of a wage below which a certain percent of workers fall. The median wage is the 50th percentile wage estimate—50 percent of workers earn less than the median and 50 percent of workers earn more than the median. More about percentile wages.
(1) Estimates for detailed occupations do not sum to the totals because the totals include occupations not shown separately. Estimates do not include self-employed workers.
(2) Annual wages have been calculated by multiplying the hourly mean wage by a "year-round, full-time" hours figure of 2,080 hours; for those occupations where there is not an hourly wage published, the annual wage has been directly calculated from the reported survey data.
(3) The relative standard error (RSE) is a measure of the reliability of a survey statistic. The smaller the relative standard error, the more precise the estimate.
(7) The value is less than .005 percent of industry employment.
(9) The location quotient is the ratio of the area concentration of occupational employment to the national average concentration. A location quotient greater than one indicates the occupation has a higher share of employment than average, and a location quotient less than one indicates the occupation is less prevalent in the area than average.
Other OEWS estimates and related information:
May 2021 National Occupational Employment and Wage Estimates
May 2021 State Occupational Employment and Wage Estimates
May 2021 Metropolitan and Nonmetropolitan Area Occupational Employment and Wage Estimates
May 2021 National Industry-Specific Occupational Employment and Wage Estimates
Last Modified Date: March 31, 2022