
An official website of the United States government
An official website of the United States government
The .gov means it's official.
Federal government websites often end in .gov or .mil. Before sharing sensitive information,
make sure you're on a federal government site.
The site is secure.
The
https:// ensures that you are connecting to the official website and that any
information you provide is encrypted and transmitted securely.
Park vehicles or issue tickets for customers in a parking lot or garage. May park or tend vehicles in environments such as a car dealership or rental car facility. May collect fee.
Employment estimate and mean wage estimates for Parking Attendants:
| Employment (1) | Employment RSE (3) |
Mean hourly wage |
Mean annual wage (2) |
Wage RSE (3) |
|---|---|---|---|---|
| 91,160 | 3.6 % | $ 14.04 | $ 29,210 | 0.9 % |
Percentile wage estimates for Parking Attendants:
| Percentile | 10% | 25% | 50% (Median) |
75% | 90% |
|---|---|---|---|---|---|
| Hourly Wage | $ 9.60 | $ 11.26 | $ 14.06 | $ 14.96 | $ 18.18 |
| Annual Wage (2) | $ 19,970 | $ 23,410 | $ 29,240 | $ 31,110 | $ 37,800 |
Industries with the highest published employment and wages for Parking Attendants are provided. For a list of all industries with employment in Parking Attendants, see the Create Customized Tables function.
Industries with the highest levels of employment in Parking Attendants:
| Industry | Employment (1) | Percent of industry employment | Hourly mean wage | Annual mean wage (2) |
|---|---|---|---|---|
| Other Personal Services | 44,050 | 14.83 | $ 14.22 | $ 29,580 |
| Automobile Dealers | 15,970 | 1.31 | $ 13.91 | $ 28,930 |
| Traveler Accommodation | 4,160 | 0.30 | $ 12.07 | $ 25,110 |
| Employment Services | 3,460 | 0.10 | $ 11.87 | $ 24,690 |
| Automotive Equipment Rental and Leasing | 3,210 | 1.81 | $ 12.14 | $ 25,250 |
Industries with the highest concentration of employment in Parking Attendants:
| Industry | Employment (1) | Percent of industry employment | Hourly mean wage | Annual mean wage (2) |
|---|---|---|---|---|
| Other Personal Services | 44,050 | 14.83 | $ 14.22 | $ 29,580 |
| Automotive Equipment Rental and Leasing | 3,210 | 1.81 | $ 12.14 | $ 25,250 |
| Automobile Dealers | 15,970 | 1.31 | $ 13.91 | $ 28,930 |
| Promoters of Performing Arts, Sports, and Similar Events | 910 | 1.17 | $ 13.50 | $ 28,090 |
| Gambling Industries | 780 | 0.43 | $ 15.02 | $ 31,250 |
Top paying industries for Parking Attendants:
| Industry | Employment (1) | Percent of industry employment | Hourly mean wage | Annual mean wage (2) |
|---|---|---|---|---|
| Support Activities for Air Transportation | 120 | 0.06 | $ 21.07 | $ 43,830 |
| Motion Picture and Video Industries | 480 | 0.15 | $ 17.89 | $ 37,200 |
| Civic and Social Organizations | 150 | 0.06 | $ 17.52 | $ 36,440 |
| Beverage Manufacturing | 40 | 0.02 | $ 16.74 | $ 34,820 |
| Business, Professional, Labor, Political, and Similar Organizations | 1,080 | 0.26 | $ 16.28 | $ 33,870 |
States and areas with the highest published employment, location quotients, and wages for Parking Attendants are provided. For a list of all areas with employment in Parking Attendants, see the Create Customized Tables function.
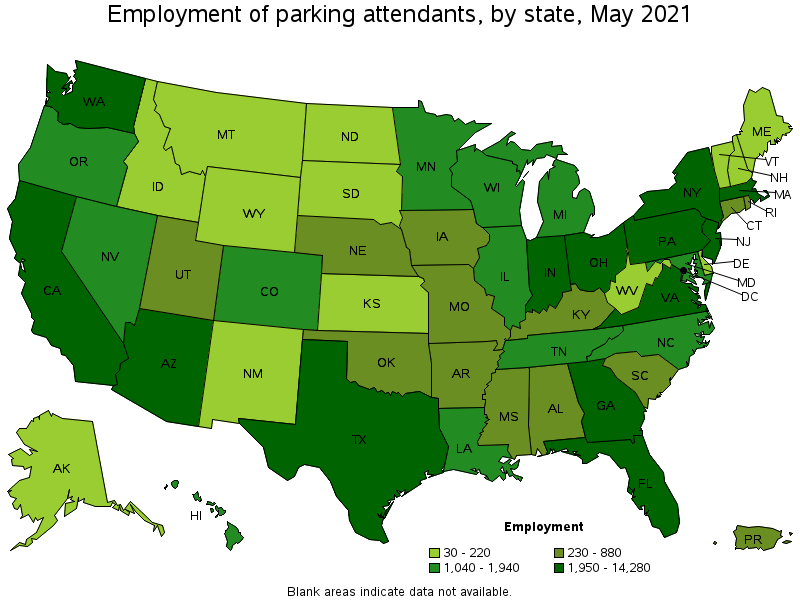
States with the highest employment level in Parking Attendants:
| State | Employment (1) | Employment per thousand jobs | Location quotient (9) | Hourly mean wage | Annual mean wage (2) |
|---|---|---|---|---|---|
| California | 14,280 | 0.86 | 1.34 | $ 16.14 | $ 33,570 |
| New York | 11,350 | 1.31 | 2.02 | $ 16.52 | $ 34,360 |
| Florida | 9,840 | 1.14 | 1.77 | $ 11.60 | $ 24,130 |
| Texas | 7,860 | 0.64 | 0.99 | $ 11.61 | $ 24,150 |
| New Jersey | 4,060 | 1.06 | 1.63 | $ 13.98 | $ 29,070 |
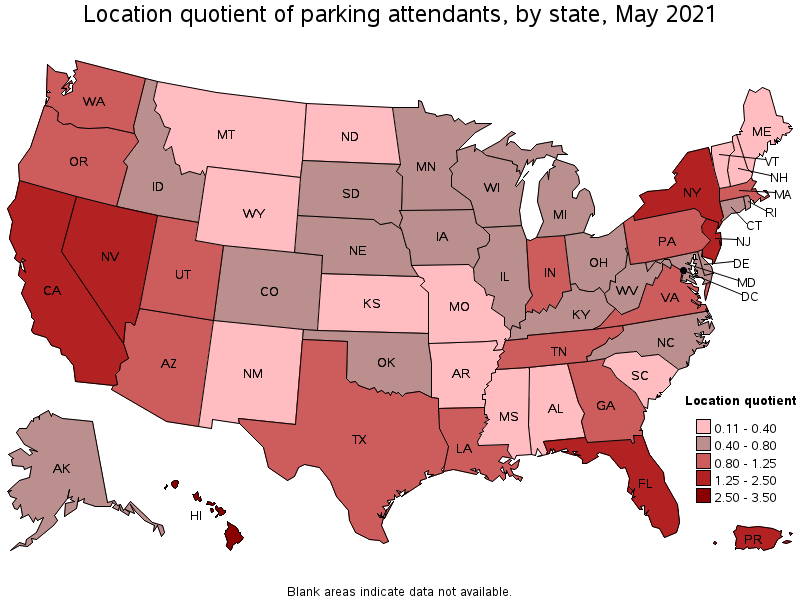
States with the highest concentration of jobs and location quotients in Parking Attendants:
| State | Employment (1) | Employment per thousand jobs | Location quotient (9) | Hourly mean wage | Annual mean wage (2) |
|---|---|---|---|---|---|
| Hawaii | 1,200 | 2.19 | 3.38 | $ 13.48 | $ 28,030 |
| District of Columbia | 1,260 | 1.90 | 2.93 | $ 15.84 | $ 32,940 |
| New York | 11,350 | 1.31 | 2.02 | $ 16.52 | $ 34,360 |
| Florida | 9,840 | 1.14 | 1.77 | $ 11.60 | $ 24,130 |
| New Jersey | 4,060 | 1.06 | 1.63 | $ 13.98 | $ 29,070 |
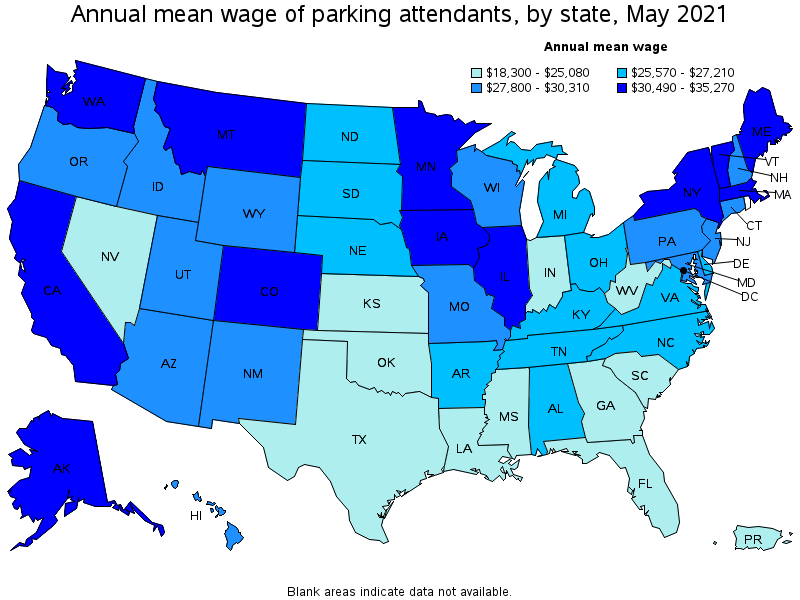
Top paying states for Parking Attendants:
| State | Employment (1) | Employment per thousand jobs | Location quotient (9) | Hourly mean wage | Annual mean wage (2) |
|---|---|---|---|---|---|
| Montana | 30 | 0.07 | 0.11 | $ 16.96 | $ 35,270 |
| Massachusetts | 2,290 | 0.67 | 1.04 | $ 16.72 | $ 34,780 |
| Illinois | 1,940 | 0.35 | 0.53 | $ 16.72 | $ 34,770 |
| New York | 11,350 | 1.31 | 2.02 | $ 16.52 | $ 34,360 |
| Washington | 2,100 | 0.66 | 1.01 | $ 16.43 | $ 34,170 |
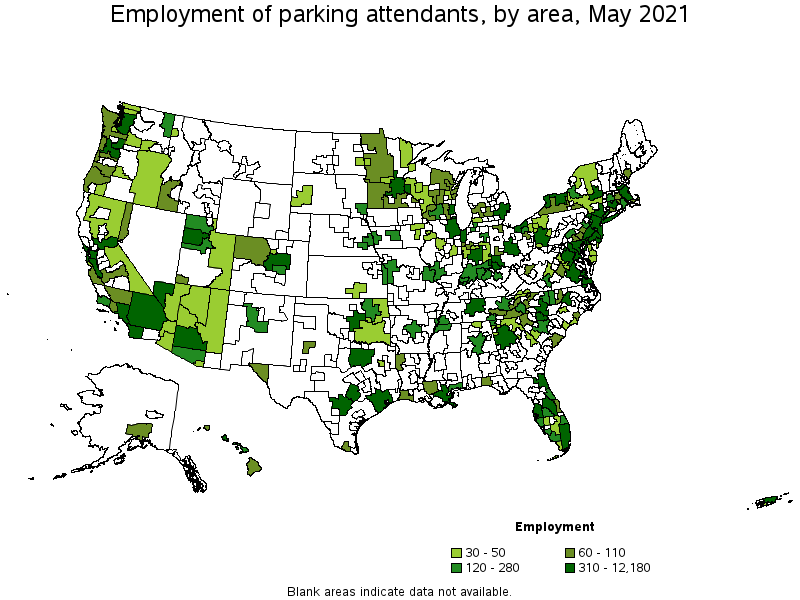
Metropolitan areas with the highest employment level in Parking Attendants:
| Metropolitan area | Employment (1) | Employment per thousand jobs | Location quotient (9) | Hourly mean wage | Annual mean wage (2) |
|---|---|---|---|---|---|
| New York-Newark-Jersey City, NY-NJ-PA | 12,180 | 1.40 | 2.17 | $ 16.34 | $ 33,980 |
| Los Angeles-Long Beach-Anaheim, CA | 7,980 | 1.40 | 2.16 | $ 15.44 | $ 32,100 |
| Miami-Fort Lauderdale-West Palm Beach, FL | 5,050 | 2.06 | 3.18 | $ 11.84 | $ 24,620 |
| Dallas-Fort Worth-Arlington, TX | 3,110 | 0.87 | 1.34 | $ 11.65 | $ 24,240 |
| Washington-Arlington-Alexandria, DC-VA-MD-WV | 2,470 | 0.84 | 1.30 | $ 15.16 | $ 31,520 |
| San Francisco-Oakland-Hayward, CA | 2,440 | 1.09 | 1.69 | $ 18.71 | $ 38,920 |
| Philadelphia-Camden-Wilmington, PA-NJ-DE-MD | 2,250 | 0.85 | 1.31 | $ 13.98 | $ 29,080 |
| Houston-The Woodlands-Sugar Land, TX | 2,250 | 0.78 | 1.20 | $ 11.39 | $ 23,700 |
| Atlanta-Sandy Springs-Roswell, GA | 2,000 | 0.77 | 1.19 | $ 12.43 | $ 25,850 |
| Boston-Cambridge-Nashua, MA-NH | 1,820 | 0.70 | 1.09 | $ 16.80 | $ 34,940 |
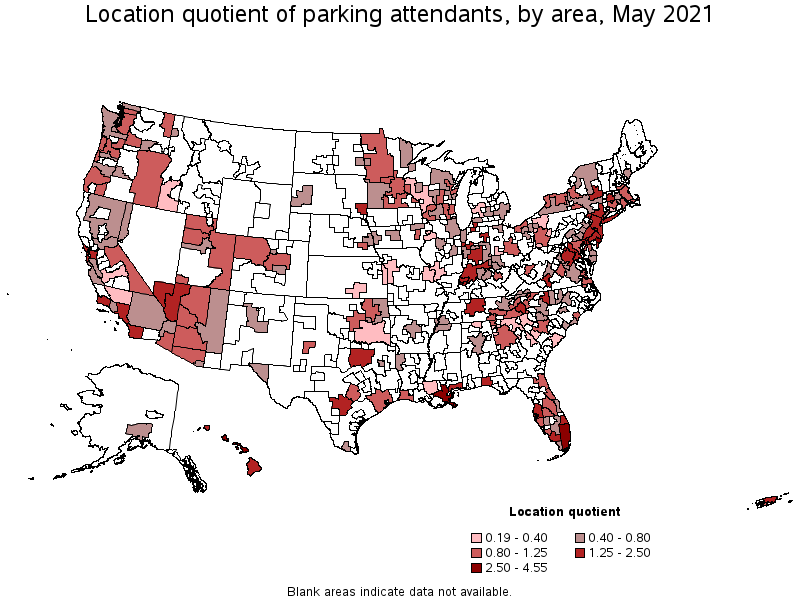
Metropolitan areas with the highest concentration of jobs and location quotients in Parking Attendants:
| Metropolitan area | Employment (1) | Employment per thousand jobs | Location quotient (9) | Hourly mean wage | Annual mean wage (2) |
|---|---|---|---|---|---|
| Kahului-Wailuku-Lahaina, HI | 190 | 2.95 | 4.55 | $ 13.74 | $ 28,590 |
| Atlantic City-Hammonton, NJ | 310 | 2.70 | 4.17 | $ 13.57 | $ 28,230 |
| Urban Honolulu, HI | 900 | 2.28 | 3.53 | $ 13.33 | $ 27,730 |
| Miami-Fort Lauderdale-West Palm Beach, FL | 5,050 | 2.06 | 3.18 | $ 11.84 | $ 24,620 |
| New Orleans-Metairie, LA | 890 | 1.76 | 2.73 | $ 11.25 | $ 23,390 |
| New York-Newark-Jersey City, NY-NJ-PA | 12,180 | 1.40 | 2.17 | $ 16.34 | $ 33,980 |
| Los Angeles-Long Beach-Anaheim, CA | 7,980 | 1.40 | 2.16 | $ 15.44 | $ 32,100 |
| Las Vegas-Henderson-Paradise, NV | 1,070 | 1.16 | 1.80 | $ 11.52 | $ 23,950 |
| San Diego-Carlsbad, CA | 1,580 | 1.14 | 1.76 | $ 16.41 | $ 34,140 |
| Tampa-St. Petersburg-Clearwater, FL | 1,460 | 1.13 | 1.75 | $ 11.67 | $ 24,270 |
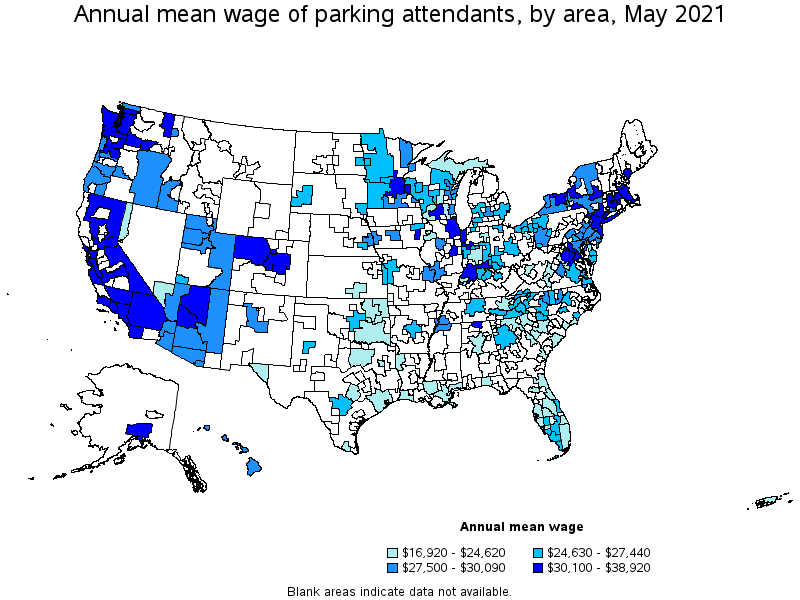
Top paying metropolitan areas for Parking Attendants:
| Metropolitan area | Employment (1) | Employment per thousand jobs | Location quotient (9) | Hourly mean wage | Annual mean wage (2) |
|---|---|---|---|---|---|
| San Francisco-Oakland-Hayward, CA | 2,440 | 1.09 | 1.69 | $ 18.71 | $ 38,920 |
| San Jose-Sunnyvale-Santa Clara, CA | 380 | 0.35 | 0.54 | $ 18.11 | $ 37,670 |
| Seattle-Tacoma-Bellevue, WA | 1,540 | 0.80 | 1.24 | $ 17.03 | $ 35,420 |
| Iowa City, IA | 50 | 0.53 | 0.82 | $ 17.02 | $ 35,400 |
| Worcester, MA-CT | 110 | 0.39 | 0.61 | $ 16.98 | $ 35,310 |
| Barnstable Town, MA | 60 | 0.65 | 1.01 | $ 16.93 | $ 35,220 |
| Boston-Cambridge-Nashua, MA-NH | 1,820 | 0.70 | 1.09 | $ 16.80 | $ 34,940 |
| Chicago-Naperville-Elgin, IL-IN-WI | 1,810 | 0.43 | 0.66 | $ 16.78 | $ 34,910 |
| Santa Cruz-Watsonville, CA | 30 | 0.37 | 0.58 | $ 16.54 | $ 34,400 |
| San Diego-Carlsbad, CA | 1,580 | 1.14 | 1.76 | $ 16.41 | $ 34,140 |
Nonmetropolitan areas with the highest employment in Parking Attendants:
| Nonmetropolitan area | Employment (1) | Employment per thousand jobs | Location quotient (9) | Hourly mean wage | Annual mean wage (2) |
|---|---|---|---|---|---|
| Southern Indiana nonmetropolitan area | 150 | 0.84 | 1.30 | $ 15.28 | $ 31,780 |
| South Central Wisconsin nonmetropolitan area | 110 | 0.57 | 0.88 | $ 11.78 | $ 24,500 |
| Hawaii / Kauai nonmetropolitan area | 110 | 1.22 | 1.89 | $ 14.22 | $ 29,570 |
| Northwest Minnesota nonmetropolitan area | 90 | 0.51 | 0.80 | $ 12.48 | $ 25,970 |
| East Tennessee nonmetropolitan area | 90 | 0.70 | 1.08 | $ 13.18 | $ 27,410 |
Nonmetropolitan areas with the highest concentration of jobs and location quotients in Parking Attendants:
| Nonmetropolitan area | Employment (1) | Employment per thousand jobs | Location quotient (9) | Hourly mean wage | Annual mean wage (2) |
|---|---|---|---|---|---|
| Hawaii / Kauai nonmetropolitan area | 110 | 1.22 | 1.89 | $ 14.22 | $ 29,570 |
| Southern Indiana nonmetropolitan area | 150 | 0.84 | 1.30 | $ 15.28 | $ 31,780 |
| Northwest Colorado nonmetropolitan area | 90 | 0.73 | 1.13 | $ 15.46 | $ 32,170 |
| Eastern Sierra-Mother Lode Region of California nonmetropolitan area | 40 | 0.71 | 1.10 | $ 16.14 | $ 33,580 |
| East Tennessee nonmetropolitan area | 90 | 0.70 | 1.08 | $ 13.18 | $ 27,410 |
Top paying nonmetropolitan areas for Parking Attendants:
| Nonmetropolitan area | Employment (1) | Employment per thousand jobs | Location quotient (9) | Hourly mean wage | Annual mean wage (2) |
|---|---|---|---|---|---|
| Eastern Sierra-Mother Lode Region of California nonmetropolitan area | 40 | 0.71 | 1.10 | $ 16.14 | $ 33,580 |
| North Valley-Northern Mountains Region of California nonmetropolitan area | 30 | 0.32 | 0.49 | $ 15.50 | $ 32,240 |
| Northwest Colorado nonmetropolitan area | 90 | 0.73 | 1.13 | $ 15.46 | $ 32,170 |
| Southern Indiana nonmetropolitan area | 150 | 0.84 | 1.30 | $ 15.28 | $ 31,780 |
| Western Washington nonmetropolitan area | 60 | 0.48 | 0.74 | $ 15.09 | $ 31,390 |
These estimates are calculated with data collected from employers in all industry sectors, all metropolitan and nonmetropolitan areas, and all states and the District of Columbia. The top employment and wage figures are provided above. The complete list is available in the downloadable XLS files.
The percentile wage estimate is the value of a wage below which a certain percent of workers fall. The median wage is the 50th percentile wage estimate—50 percent of workers earn less than the median and 50 percent of workers earn more than the median. More about percentile wages.
(1) Estimates for detailed occupations do not sum to the totals because the totals include occupations not shown separately. Estimates do not include self-employed workers.
(2) Annual wages have been calculated by multiplying the hourly mean wage by a "year-round, full-time" hours figure of 2,080 hours; for those occupations where there is not an hourly wage published, the annual wage has been directly calculated from the reported survey data.
(3) The relative standard error (RSE) is a measure of the reliability of a survey statistic. The smaller the relative standard error, the more precise the estimate.
(9) The location quotient is the ratio of the area concentration of occupational employment to the national average concentration. A location quotient greater than one indicates the occupation has a higher share of employment than average, and a location quotient less than one indicates the occupation is less prevalent in the area than average.
Other OEWS estimates and related information:
May 2021 National Occupational Employment and Wage Estimates
May 2021 State Occupational Employment and Wage Estimates
May 2021 Metropolitan and Nonmetropolitan Area Occupational Employment and Wage Estimates
May 2021 National Industry-Specific Occupational Employment and Wage Estimates
Last Modified Date: March 31, 2022