
An official website of the United States government
An official website of the United States government
The .gov means it's official.
Federal government websites often end in .gov or .mil. Before sharing sensitive information,
make sure you're on a federal government site.
The site is secure.
The
https:// ensures that you are connecting to the official website and that any
information you provide is encrypted and transmitted securely.
Wash or otherwise clean vehicles, machinery, and other equipment. Use such materials as water, cleaning agents, brushes, cloths, and hoses. Excludes �Janitors and Cleaners, Except Maids and Housekeeping Cleaners� (37-2011).
Employment estimate and mean wage estimates for Cleaners of Vehicles and Equipment:
| Employment (1) | Employment RSE (3) |
Mean hourly wage |
Mean annual wage (2) |
Wage RSE (3) |
|---|---|---|---|---|
| 351,960 | 0.7 % | $ 14.69 | $ 30,550 | 0.3 % |
Percentile wage estimates for Cleaners of Vehicles and Equipment:
| Percentile | 10% | 25% | 50% (Median) |
75% | 90% |
|---|---|---|---|---|---|
| Hourly Wage | $ 10.52 | $ 11.62 | $ 14.08 | $ 16.65 | $ 18.67 |
| Annual Wage (2) | $ 21,890 | $ 24,180 | $ 29,280 | $ 34,620 | $ 38,830 |
Industries with the highest published employment and wages for Cleaners of Vehicles and Equipment are provided. For a list of all industries with employment in Cleaners of Vehicles and Equipment, see the Create Customized Tables function.
Industries with the highest levels of employment in Cleaners of Vehicles and Equipment:
| Industry | Employment (1) | Percent of industry employment | Hourly mean wage | Annual mean wage (2) |
|---|---|---|---|---|
| Automotive Repair and Maintenance | 142,860 | 15.57 | $ 13.19 | $ 27,420 |
| Automobile Dealers | 80,870 | 6.63 | $ 14.39 | $ 29,940 |
| Automotive Equipment Rental and Leasing | 16,950 | 9.53 | $ 14.17 | $ 29,470 |
| Services to Buildings and Dwellings | 11,120 | 0.52 | $ 16.33 | $ 33,960 |
| Local Government, excluding schools and hospitals (OEWS Designation) | 6,820 | 0.13 | $ 27.21 | $ 56,600 |
Industries with the highest concentration of employment in Cleaners of Vehicles and Equipment:
| Industry | Employment (1) | Percent of industry employment | Hourly mean wage | Annual mean wage (2) |
|---|---|---|---|---|
| Automotive Repair and Maintenance | 142,860 | 15.57 | $ 13.19 | $ 27,420 |
| Automotive Equipment Rental and Leasing | 16,950 | 9.53 | $ 14.17 | $ 29,470 |
| Automobile Dealers | 80,870 | 6.63 | $ 14.39 | $ 29,940 |
| Support Activities for Rail Transportation | 1,270 | 3.91 | $ 17.45 | $ 36,290 |
| Other Motor Vehicle Dealers | 5,940 | 3.63 | $ 14.61 | $ 30,390 |
Top paying industries for Cleaners of Vehicles and Equipment:
| Industry | Employment (1) | Percent of industry employment | Hourly mean wage | Annual mean wage (2) |
|---|---|---|---|---|
| Local Government, excluding schools and hospitals (OEWS Designation) | 6,820 | 0.13 | $ 27.21 | $ 56,600 |
| Petroleum and Coal Products Manufacturing | 40 | 0.04 | $ 26.15 | $ 54,380 |
| Federal Executive Branch (OEWS Designation) | 240 | 0.01 | $ 25.17 | $ 52,350 |
| Couriers and Express Delivery Services | 2,300 | 0.25 | $ 24.69 | $ 51,350 |
| Other Heavy and Civil Engineering Construction | 40 | 0.03 | $ 24.16 | $ 50,250 |
States and areas with the highest published employment, location quotients, and wages for Cleaners of Vehicles and Equipment are provided. For a list of all areas with employment in Cleaners of Vehicles and Equipment, see the Create Customized Tables function.
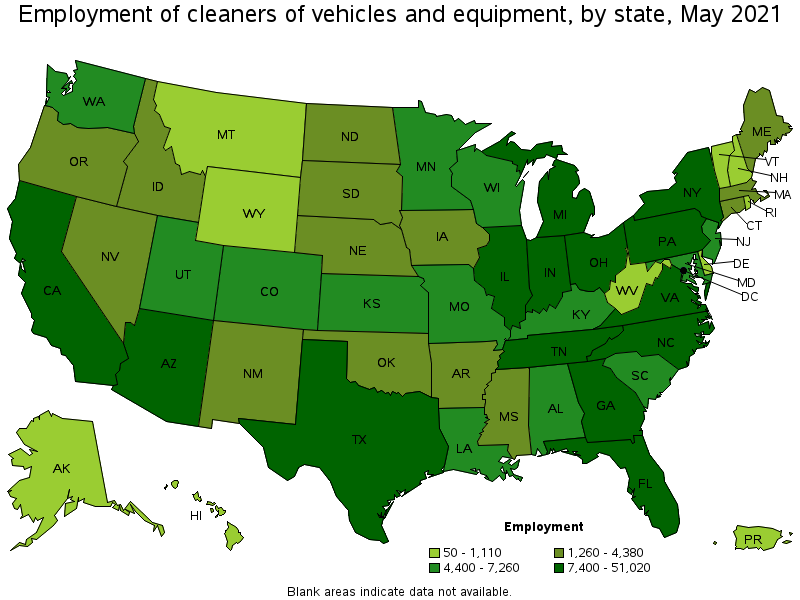
States with the highest employment level in Cleaners of Vehicles and Equipment:
| State | Employment (1) | Employment per thousand jobs | Location quotient (9) | Hourly mean wage | Annual mean wage (2) |
|---|---|---|---|---|---|
| California | 51,020 | 3.09 | 1.24 | $ 16.24 | $ 33,770 |
| Texas | 37,610 | 3.08 | 1.23 | $ 13.20 | $ 27,460 |
| Florida | 21,260 | 2.47 | 0.99 | $ 13.36 | $ 27,780 |
| New York | 19,280 | 2.22 | 0.89 | $ 19.47 | $ 40,500 |
| Ohio | 13,820 | 2.66 | 1.06 | $ 14.68 | $ 30,530 |
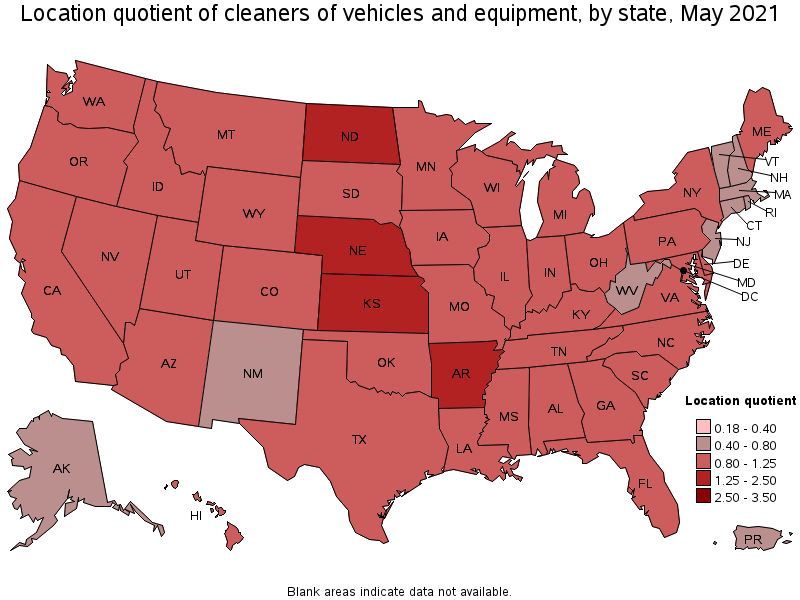
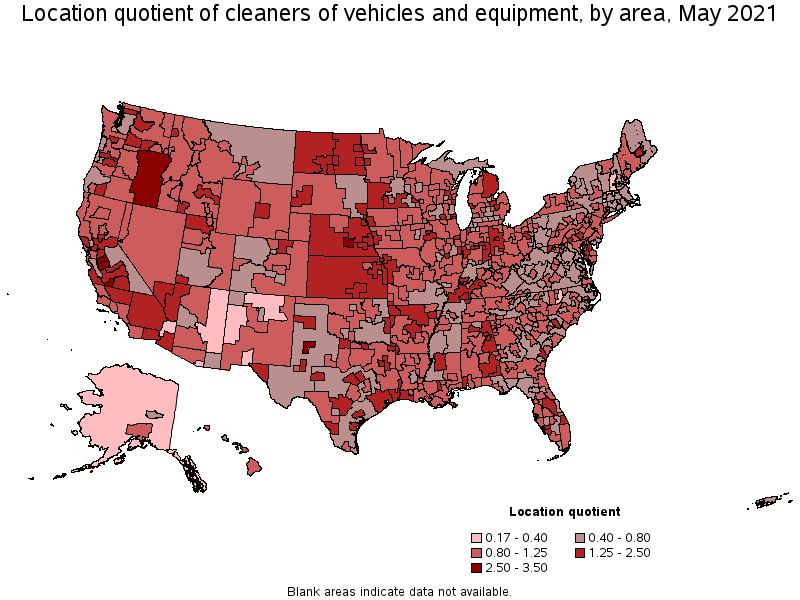
States with the highest concentration of jobs and location quotients in Cleaners of Vehicles and Equipment:
| State | Employment (1) | Employment per thousand jobs | Location quotient (9) | Hourly mean wage | Annual mean wage (2) |
|---|---|---|---|---|---|
| Kansas | 5,560 | 4.15 | 1.66 | $ 13.60 | $ 28,300 |
| Nebraska | 3,970 | 4.14 | 1.66 | $ 15.15 | $ 31,520 |
| North Dakota | 1,540 | 3.91 | 1.56 | $ 14.66 | $ 30,490 |
| Arkansas | 4,120 | 3.46 | 1.38 | $ 14.06 | $ 29,240 |
| California | 51,020 | 3.09 | 1.24 | $ 16.24 | $ 33,770 |
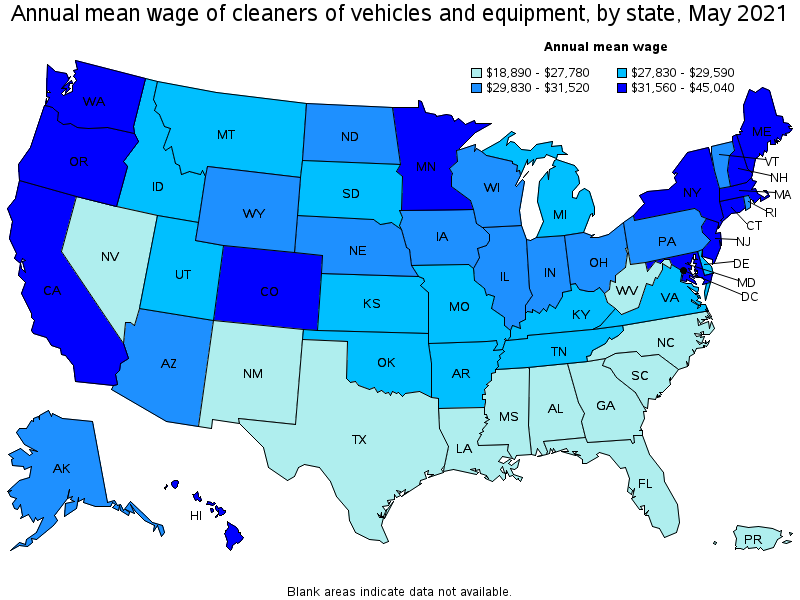
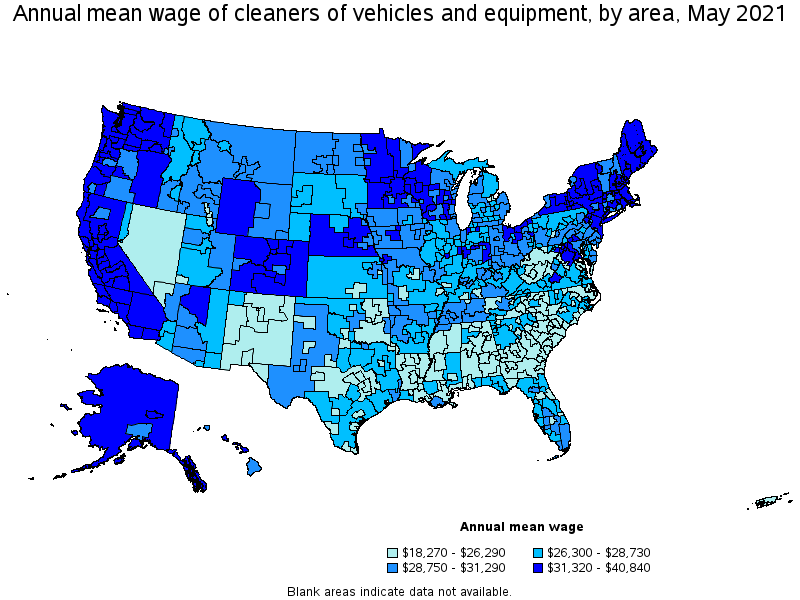
Top paying states for Cleaners of Vehicles and Equipment:
| State | Employment (1) | Employment per thousand jobs | Location quotient (9) | Hourly mean wage | Annual mean wage (2) |
|---|---|---|---|---|---|
| District of Columbia | 300 | 0.46 | 0.18 | $ 21.65 | $ 45,040 |
| New York | 19,280 | 2.22 | 0.89 | $ 19.47 | $ 40,500 |
| Washington | 7,190 | 2.24 | 0.90 | $ 17.24 | $ 35,860 |
| Massachusetts | 4,250 | 1.25 | 0.50 | $ 16.56 | $ 34,440 |
| New Hampshire | 970 | 1.53 | 0.61 | $ 16.49 | $ 34,290 |
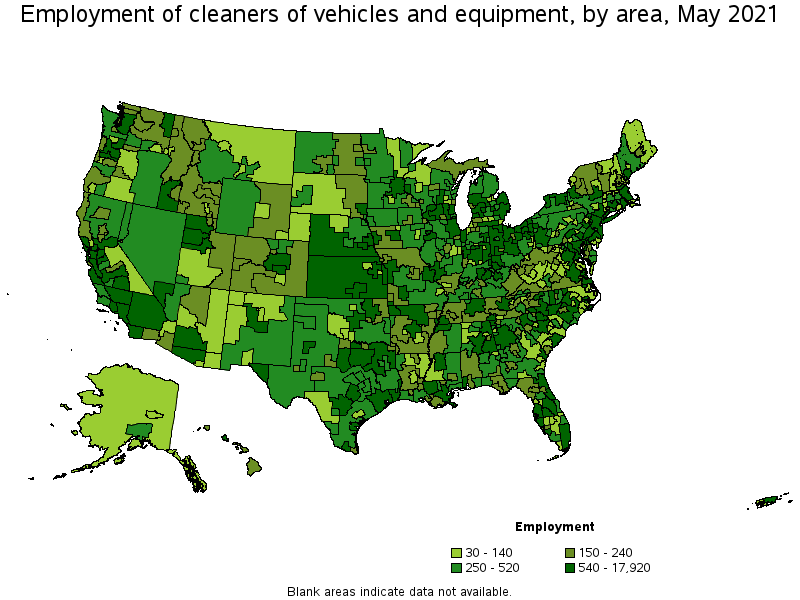
Metropolitan areas with the highest employment level in Cleaners of Vehicles and Equipment:
| Metropolitan area | Employment (1) | Employment per thousand jobs | Location quotient (9) | Hourly mean wage | Annual mean wage (2) |
|---|---|---|---|---|---|
| New York-Newark-Jersey City, NY-NJ-PA | 17,920 | 2.06 | 0.83 | $ 19.64 | $ 40,840 |
| Los Angeles-Long Beach-Anaheim, CA | 17,040 | 2.98 | 1.19 | $ 15.70 | $ 32,660 |
| Dallas-Fort Worth-Arlington, TX | 10,420 | 2.90 | 1.16 | $ 13.65 | $ 28,390 |
| Chicago-Naperville-Elgin, IL-IN-WI | 9,830 | 2.32 | 0.93 | $ 14.97 | $ 31,130 |
| Houston-The Woodlands-Sugar Land, TX | 9,280 | 3.20 | 1.28 | $ 13.62 | $ 28,330 |
| Atlanta-Sandy Springs-Roswell, GA | 6,710 | 2.59 | 1.04 | $ 13.38 | $ 27,830 |
| Riverside-San Bernardino-Ontario, CA | 5,910 | 3.86 | 1.55 | $ 15.58 | $ 32,400 |
| San Francisco-Oakland-Hayward, CA | 5,680 | 2.53 | 1.01 | $ 18.74 | $ 38,980 |
| Phoenix-Mesa-Scottsdale, AZ | 5,610 | 2.65 | 1.06 | $ 14.92 | $ 31,020 |
| Philadelphia-Camden-Wilmington, PA-NJ-DE-MD | 5,450 | 2.05 | 0.82 | $ 14.80 | $ 30,770 |
Metropolitan areas with the highest concentration of jobs and location quotients in Cleaners of Vehicles and Equipment:
| Metropolitan area | Employment (1) | Employment per thousand jobs | Location quotient (9) | Hourly mean wage | Annual mean wage (2) |
|---|---|---|---|---|---|
| Grand Island, NE | 310 | 7.64 | 3.06 | $ 15.50 | $ 32,240 |
| Merced, CA | 490 | 6.80 | 2.72 | $ 15.99 | $ 33,260 |
| Lubbock, TX | 940 | 6.58 | 2.63 | $ 12.11 | $ 25,180 |
| Modesto, CA | 1,170 | 6.46 | 2.58 | $ 16.14 | $ 33,560 |
| Hanford-Corcoran, CA | 270 | 6.37 | 2.55 | $ 16.39 | $ 34,080 |
| Lima, OH | 300 | 6.07 | 2.43 | $ 14.73 | $ 30,640 |
| Decatur, IL | 260 | 5.81 | 2.33 | $ 16.14 | $ 33,570 |
| Hammond, LA | 250 | 5.67 | 2.27 | $ 12.42 | $ 25,820 |
| Topeka, KS | 600 | 5.61 | 2.25 | $ 14.28 | $ 29,700 |
| Carson City, NV | 170 | 5.55 | 2.22 | $ 12.79 | $ 26,590 |
Top paying metropolitan areas for Cleaners of Vehicles and Equipment:
| Metropolitan area | Employment (1) | Employment per thousand jobs | Location quotient (9) | Hourly mean wage | Annual mean wage (2) |
|---|---|---|---|---|---|
| New York-Newark-Jersey City, NY-NJ-PA | 17,920 | 2.06 | 0.83 | $ 19.64 | $ 40,840 |
| San Francisco-Oakland-Hayward, CA | 5,680 | 2.53 | 1.01 | $ 18.74 | $ 38,980 |
| San Jose-Sunnyvale-Santa Clara, CA | 2,110 | 1.97 | 0.79 | $ 18.64 | $ 38,780 |
| Ames, IA | 90 | 2.09 | 0.84 | $ 18.33 | $ 38,120 |
| Seattle-Tacoma-Bellevue, WA | 3,700 | 1.93 | 0.77 | $ 17.83 | $ 37,080 |
| Barnstable Town, MA | 140 | 1.45 | 0.58 | $ 17.73 | $ 36,870 |
| Bremerton-Silverdale, WA | 170 | 1.98 | 0.79 | $ 17.70 | $ 36,810 |
| Portsmouth, NH-ME | 160 | 1.76 | 0.70 | $ 17.49 | $ 36,380 |
| Napa, CA | 110 | 1.66 | 0.66 | $ 17.32 | $ 36,030 |
| Portland-South Portland, ME | 580 | 2.92 | 1.17 | $ 17.23 | $ 35,840 |
Nonmetropolitan areas with the highest employment in Cleaners of Vehicles and Equipment:
| Nonmetropolitan area | Employment (1) | Employment per thousand jobs | Location quotient (9) | Hourly mean wage | Annual mean wage (2) |
|---|---|---|---|---|---|
| Kansas nonmetropolitan area | 1,400 | 3.74 | 1.50 | $ 13.51 | $ 28,100 |
| West Northwestern Ohio nonmetropolitan area | 940 | 3.94 | 1.58 | $ 14.82 | $ 30,830 |
| North Northeastern Ohio nonmetropolitan area (noncontiguous) | 900 | 2.86 | 1.14 | $ 15.15 | $ 31,510 |
| North Texas Region of Texas nonmetropolitan area | 710 | 2.67 | 1.07 | $ 13.18 | $ 27,410 |
| South Nebraska nonmetropolitan area | 700 | 4.84 | 1.94 | $ 15.41 | $ 32,050 |
Nonmetropolitan areas with the highest concentration of jobs and location quotients in Cleaners of Vehicles and Equipment:
| Nonmetropolitan area | Employment (1) | Employment per thousand jobs | Location quotient (9) | Hourly mean wage | Annual mean wage (2) |
|---|---|---|---|---|---|
| Eastern Oregon nonmetropolitan area | 440 | 6.25 | 2.50 | $ 15.66 | $ 32,580 |
| Northeast Nebraska nonmetropolitan area | 510 | 5.59 | 2.24 | $ 15.70 | $ 32,650 |
| South Nebraska nonmetropolitan area | 700 | 4.84 | 1.94 | $ 15.41 | $ 32,050 |
| North Arkansas nonmetropolitan area | 540 | 4.82 | 1.93 | $ 14.28 | $ 29,710 |
| West North Dakota nonmetropolitan area | 440 | 4.13 | 1.65 | $ 14.72 | $ 30,620 |
Top paying nonmetropolitan areas for Cleaners of Vehicles and Equipment:
| Nonmetropolitan area | Employment (1) | Employment per thousand jobs | Location quotient (9) | Hourly mean wage | Annual mean wage (2) |
|---|---|---|---|---|---|
| Western Washington nonmetropolitan area | 340 | 2.86 | 1.15 | $ 17.22 | $ 35,810 |
| Eastern and Southern Colorado nonmetropolitan area | 180 | 2.72 | 1.09 | $ 17.17 | $ 35,720 |
| Eastern Washington nonmetropolitan area | 200 | 2.10 | 0.84 | $ 16.74 | $ 34,820 |
| Massachusetts nonmetropolitan area | 40 | 0.66 | 0.27 | $ 16.65 | $ 34,640 |
| Southwest New York nonmetropolitan area | 450 | 2.68 | 1.07 | $ 16.44 | $ 34,190 |
These estimates are calculated with data collected from employers in all industry sectors, all metropolitan and nonmetropolitan areas, and all states and the District of Columbia. The top employment and wage figures are provided above. The complete list is available in the downloadable XLS files.
The percentile wage estimate is the value of a wage below which a certain percent of workers fall. The median wage is the 50th percentile wage estimate—50 percent of workers earn less than the median and 50 percent of workers earn more than the median. More about percentile wages.
(1) Estimates for detailed occupations do not sum to the totals because the totals include occupations not shown separately. Estimates do not include self-employed workers.
(2) Annual wages have been calculated by multiplying the hourly mean wage by a "year-round, full-time" hours figure of 2,080 hours; for those occupations where there is not an hourly wage published, the annual wage has been directly calculated from the reported survey data.
(3) The relative standard error (RSE) is a measure of the reliability of a survey statistic. The smaller the relative standard error, the more precise the estimate.
(9) The location quotient is the ratio of the area concentration of occupational employment to the national average concentration. A location quotient greater than one indicates the occupation has a higher share of employment than average, and a location quotient less than one indicates the occupation is less prevalent in the area than average.
Other OEWS estimates and related information:
May 2021 National Occupational Employment and Wage Estimates
May 2021 State Occupational Employment and Wage Estimates
May 2021 Metropolitan and Nonmetropolitan Area Occupational Employment and Wage Estimates
May 2021 National Industry-Specific Occupational Employment and Wage Estimates
Last Modified Date: March 31, 2022