
An official website of the United States government
An official website of the United States government
The .gov means it's official.
Federal government websites often end in .gov or .mil. Before sharing sensitive information,
make sure you're on a federal government site.
The site is secure.
The
https:// ensures that you are connecting to the official website and that any
information you provide is encrypted and transmitted securely.
Plan, direct, or coordinate marketing policies and programs, such as determining the demand for products and services offered by a firm and its competitors, and identify potential customers. Develop pricing strategies with the goal of maximizing the firm�s profits or share of the market while ensuring the firm�s customers are satisfied. Oversee product development or monitor trends that indicate the need for new products and services.
Employment estimate and mean wage estimates for Marketing Managers:
| Employment (1) | Employment RSE (3) |
Mean hourly wage |
Mean annual wage (2) |
Wage RSE (3) |
|---|---|---|---|---|
| 278,690 | 1.0 % | $ 73.77 | $ 153,440 | 0.5 % |
Percentile wage estimates for Marketing Managers:
| Percentile | 10% | 25% | 50% (Median) |
75% | 90% |
|---|---|---|---|---|---|
| Hourly Wage | $ 37.35 | $ 48.08 | $ 64.92 | $ 92.56 | (5) |
| Annual Wage (2) | $ 77,680 | $ 100,010 | $ 135,030 | $ 192,520 | (5) |
Industries with the highest published employment and wages for Marketing Managers are provided. For a list of all industries with employment in Marketing Managers, see the Create Customized Tables function.
Industries with the highest levels of employment in Marketing Managers:
| Industry | Employment (1) | Percent of industry employment | Hourly mean wage | Annual mean wage (2) |
|---|---|---|---|---|
| Management of Companies and Enterprises | 40,110 | 1.58 | $ 77.85 | $ 161,920 |
| Management, Scientific, and Technical Consulting Services | 21,630 | 1.39 | $ 73.74 | $ 153,380 |
| Computer Systems Design and Related Services | 18,930 | 0.84 | $ 81.02 | $ 168,520 |
| Credit Intermediation and Related Activities (5221 and 5223 only) | 9,360 | 0.47 | $ 74.58 | $ 155,130 |
| Other Information Services | 9,340 | 2.57 | $ 91.97 | $ 191,300 |
Industries with the highest concentration of employment in Marketing Managers:
| Industry | Employment (1) | Percent of industry employment | Hourly mean wage | Annual mean wage (2) |
|---|---|---|---|---|
| Other Information Services | 9,340 | 2.57 | $ 91.97 | $ 191,300 |
| Lessors of Nonfinancial Intangible Assets (except Copyrighted Works) | 500 | 2.57 | $ 67.30 | $ 139,980 |
| Advertising, Public Relations, and Related Services | 8,980 | 2.06 | $ 77.86 | $ 161,940 |
| Software Publishers | 8,420 | 1.60 | $ 82.56 | $ 171,720 |
| Sound Recording Industries | 280 | 1.60 | $ 59.94 | $ 124,660 |
Top paying industries for Marketing Managers:
| Industry | Employment (1) | Percent of industry employment | Hourly mean wage | Annual mean wage (2) |
|---|---|---|---|---|
| Oil and Gas Extraction | 200 | 0.19 | $ 101.96 | $ 212,080 |
| Pipeline Transportation of Natural Gas | 60 | 0.21 | $ 95.09 | $ 197,780 |
| Cable and Other Subscription Programming | 460 | 0.98 | $ 94.02 | $ 195,560 |
| Scientific Research and Development Services | 6,480 | 0.81 | $ 92.93 | $ 193,290 |
| Other Information Services | 9,340 | 2.57 | $ 91.97 | $ 191,300 |
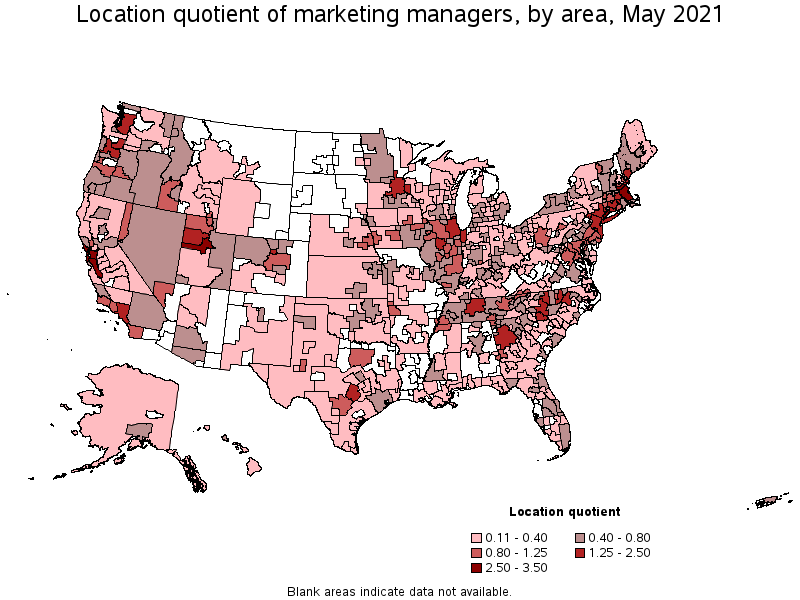
States and areas with the highest published employment, location quotients, and wages for Marketing Managers are provided. For a list of all areas with employment in Marketing Managers, see the Create Customized Tables function.
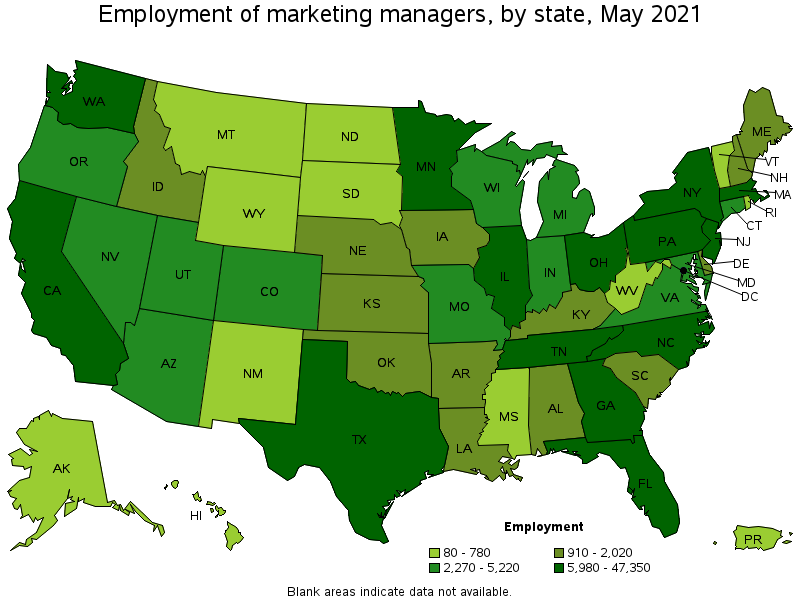
States with the highest employment level in Marketing Managers:
| State | Employment (1) | Employment per thousand jobs | Location quotient (9) | Hourly mean wage | Annual mean wage (2) |
|---|---|---|---|---|---|
| California | 47,350 | 2.86 | 1.45 | $ 84.21 | $ 175,150 |
| New York | 25,090 | 2.89 | 1.46 | $ 91.71 | $ 190,760 |
| Illinois | 22,310 | 3.97 | 2.01 | $ 66.83 | $ 139,010 |
| Texas | 20,410 | 1.67 | 0.84 | $ 68.05 | $ 141,550 |
| Massachusetts | 15,900 | 4.68 | 2.37 | $ 78.09 | $ 162,420 |
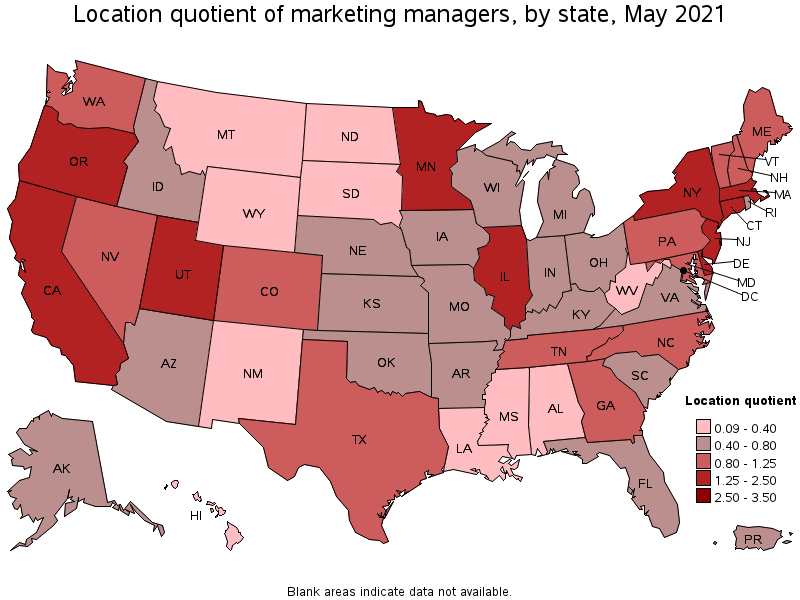
States with the highest concentration of jobs and location quotients in Marketing Managers:
| State | Employment (1) | Employment per thousand jobs | Location quotient (9) | Hourly mean wage | Annual mean wage (2) |
|---|---|---|---|---|---|
| Massachusetts | 15,900 | 4.68 | 2.37 | $ 78.09 | $ 162,420 |
| District of Columbia | 2,690 | 4.06 | 2.05 | $ 80.06 | $ 166,530 |
| Illinois | 22,310 | 3.97 | 2.01 | $ 66.83 | $ 139,010 |
| Connecticut | 5,220 | 3.32 | 1.68 | $ 74.46 | $ 154,870 |
| Delaware | 1,270 | 2.92 | 1.48 | $ 82.41 | $ 171,420 |
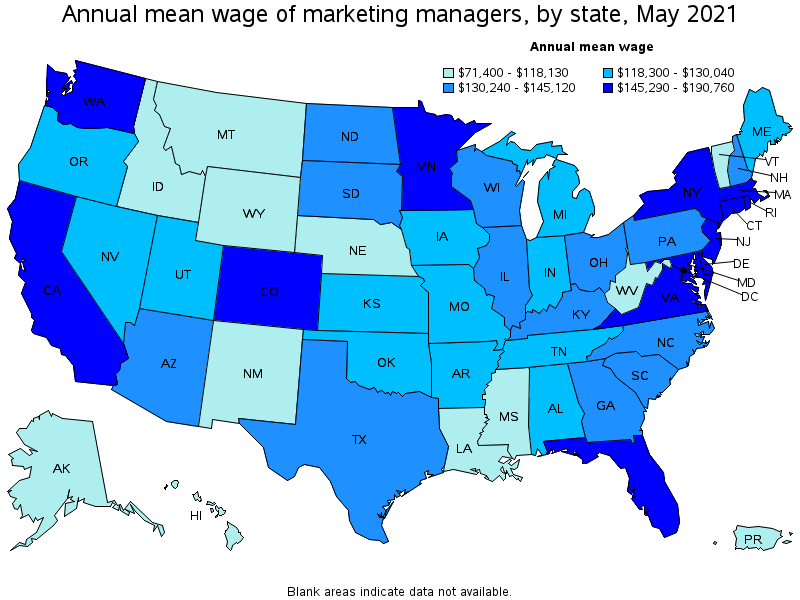
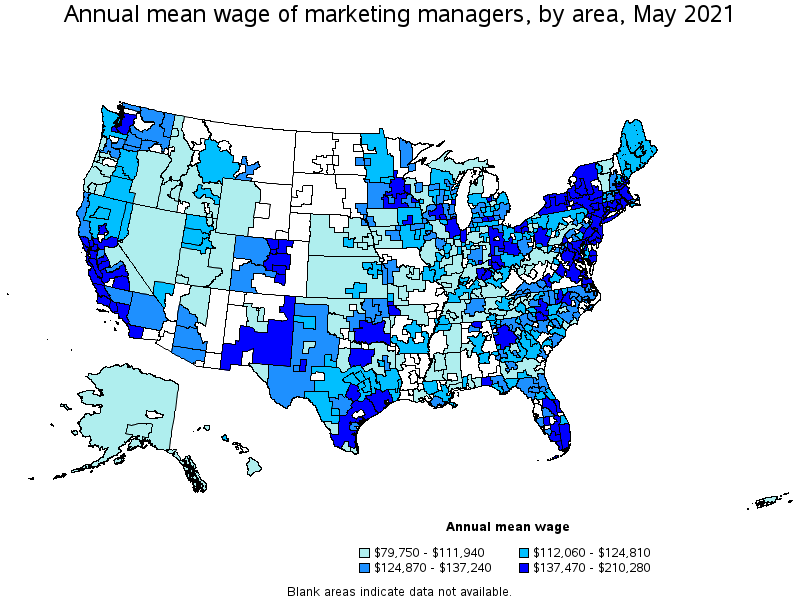
Top paying states for Marketing Managers:
| State | Employment (1) | Employment per thousand jobs | Location quotient (9) | Hourly mean wage | Annual mean wage (2) |
|---|---|---|---|---|---|
| New York | 25,090 | 2.89 | 1.46 | $ 91.71 | $ 190,760 |
| New Jersey | 11,030 | 2.86 | 1.45 | $ 86.21 | $ 179,320 |
| California | 47,350 | 2.86 | 1.45 | $ 84.21 | $ 175,150 |
| Delaware | 1,270 | 2.92 | 1.48 | $ 82.41 | $ 171,420 |
| Virginia | 4,610 | 1.23 | 0.62 | $ 81.73 | $ 169,990 |
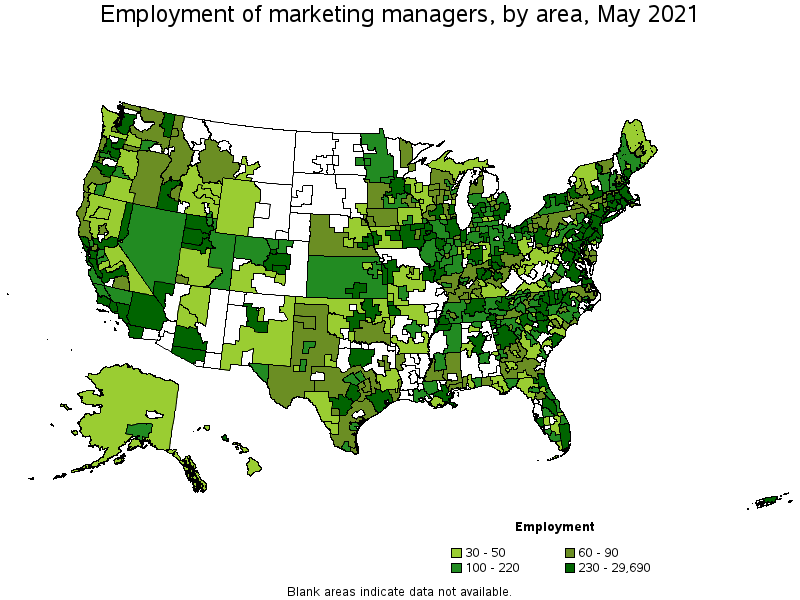
Metropolitan areas with the highest employment level in Marketing Managers:
| Metropolitan area | Employment (1) | Employment per thousand jobs | Location quotient (9) | Hourly mean wage | Annual mean wage (2) |
|---|---|---|---|---|---|
| New York-Newark-Jersey City, NY-NJ-PA | 29,690 | 3.42 | 1.73 | $ 91.98 | $ 191,310 |
| Chicago-Naperville-Elgin, IL-IN-WI | 18,600 | 4.39 | 2.22 | $ 68.61 | $ 142,720 |
| Los Angeles-Long Beach-Anaheim, CA | 17,020 | 2.98 | 1.50 | $ 77.77 | $ 161,750 |
| Boston-Cambridge-Nashua, MA-NH | 13,920 | 5.38 | 2.72 | $ 78.95 | $ 164,210 |
| San Francisco-Oakland-Hayward, CA | 11,640 | 5.19 | 2.63 | $ 95.61 | $ 198,870 |
| Dallas-Fort Worth-Arlington, TX | 7,740 | 2.16 | 1.09 | $ 70.97 | $ 147,610 |
| San Jose-Sunnyvale-Santa Clara, CA | 7,140 | 6.68 | 3.38 | $ 101.10 | $ 210,280 |
| Atlanta-Sandy Springs-Roswell, GA | 6,920 | 2.67 | 1.35 | $ 70.55 | $ 146,740 |
| Washington-Arlington-Alexandria, DC-VA-MD-WV | 6,780 | 2.31 | 1.17 | $ 82.81 | $ 172,240 |
| Minneapolis-St. Paul-Bloomington, MN-WI | 6,230 | 3.42 | 1.73 | $ 76.99 | $ 160,140 |
Metropolitan areas with the highest concentration of jobs and location quotients in Marketing Managers:
| Metropolitan area | Employment (1) | Employment per thousand jobs | Location quotient (9) | Hourly mean wage | Annual mean wage (2) |
|---|---|---|---|---|---|
| San Jose-Sunnyvale-Santa Clara, CA | 7,140 | 6.68 | 3.38 | $ 101.10 | $ 210,280 |
| Boston-Cambridge-Nashua, MA-NH | 13,920 | 5.38 | 2.72 | $ 78.95 | $ 164,210 |
| Bridgeport-Stamford-Norwalk, CT | 1,960 | 5.21 | 2.63 | $ 80.86 | $ 168,180 |
| San Francisco-Oakland-Hayward, CA | 11,640 | 5.19 | 2.63 | $ 95.61 | $ 198,870 |
| Provo-Orem, UT | 1,370 | 5.02 | 2.54 | $ 56.64 | $ 117,800 |
| Durham-Chapel Hill, NC | 1,430 | 4.57 | 2.31 | $ 72.88 | $ 151,580 |
| Chicago-Naperville-Elgin, IL-IN-WI | 18,600 | 4.39 | 2.22 | $ 68.61 | $ 142,720 |
| Trenton, NJ | 910 | 4.00 | 2.02 | $ 85.54 | $ 177,920 |
| Portland-Vancouver-Hillsboro, OR-WA | 4,220 | 3.76 | 1.90 | $ 64.96 | $ 135,110 |
| Portland-South Portland, ME | 710 | 3.58 | 1.81 | $ 59.60 | $ 123,980 |
Top paying metropolitan areas for Marketing Managers:
| Metropolitan area | Employment (1) | Employment per thousand jobs | Location quotient (9) | Hourly mean wage | Annual mean wage (2) |
|---|---|---|---|---|---|
| San Jose-Sunnyvale-Santa Clara, CA | 7,140 | 6.68 | 3.38 | $ 101.10 | $ 210,280 |
| San Francisco-Oakland-Hayward, CA | 11,640 | 5.19 | 2.63 | $ 95.61 | $ 198,870 |
| New York-Newark-Jersey City, NY-NJ-PA | 29,690 | 3.42 | 1.73 | $ 91.98 | $ 191,310 |
| Kingston, NY | 30 | 0.59 | 0.30 | $ 87.17 | $ 181,320 |
| Trenton, NJ | 910 | 4.00 | 2.02 | $ 85.54 | $ 177,920 |
| Washington-Arlington-Alexandria, DC-VA-MD-WV | 6,780 | 2.31 | 1.17 | $ 82.81 | $ 172,240 |
| Boulder, CO | 480 | 2.62 | 1.32 | $ 81.78 | $ 170,100 |
| Seattle-Tacoma-Bellevue, WA | 5,520 | 2.88 | 1.46 | $ 81.22 | $ 168,930 |
| Bridgeport-Stamford-Norwalk, CT | 1,960 | 5.21 | 2.63 | $ 80.86 | $ 168,180 |
| Fort Collins, CO | 210 | 1.29 | 0.65 | $ 80.61 | $ 167,660 |
Nonmetropolitan areas with the highest employment in Marketing Managers:
| Nonmetropolitan area | Employment (1) | Employment per thousand jobs | Location quotient (9) | Hourly mean wage | Annual mean wage (2) |
|---|---|---|---|---|---|
| Southeast Iowa nonmetropolitan area | 250 | 1.17 | 0.59 | $ 55.64 | $ 115,720 |
| East Central Illinois nonmetropolitan area | 220 | 1.93 | 0.98 | $ 46.58 | $ 96,890 |
| Piedmont North Carolina nonmetropolitan area | 200 | 0.82 | 0.41 | $ 57.12 | $ 118,810 |
| Northwest Illinois nonmetropolitan area | 200 | 1.58 | 0.80 | $ 48.46 | $ 100,790 |
| West Central Illinois nonmetropolitan area | 200 | 1.24 | 0.63 | $ 49.46 | $ 102,870 |
Nonmetropolitan areas with the highest concentration of jobs and location quotients in Marketing Managers:
| Nonmetropolitan area | Employment (1) | Employment per thousand jobs | Location quotient (9) | Hourly mean wage | Annual mean wage (2) |
|---|---|---|---|---|---|
| East Central Illinois nonmetropolitan area | 220 | 1.93 | 0.98 | $ 46.58 | $ 96,890 |
| Connecticut nonmetropolitan area | 60 | 1.80 | 0.91 | $ 67.95 | $ 141,330 |
| Northwest Illinois nonmetropolitan area | 200 | 1.58 | 0.80 | $ 48.46 | $ 100,790 |
| Northern Vermont nonmetropolitan area | 90 | 1.43 | 0.72 | $ 48.72 | $ 101,340 |
| West Central-Southwest New Hampshire nonmetropolitan area | 120 | 1.24 | 0.63 | $ 62.58 | $ 130,160 |
Top paying nonmetropolitan areas for Marketing Managers:
| Nonmetropolitan area | Employment (1) | Employment per thousand jobs | Location quotient (9) | Hourly mean wage | Annual mean wage (2) |
|---|---|---|---|---|---|
| Southwest New York nonmetropolitan area | 160 | 0.94 | 0.47 | $ 85.77 | $ 178,410 |
| Central East New York nonmetropolitan area | 70 | 0.44 | 0.22 | $ 82.04 | $ 170,650 |
| Capital/Northern New York nonmetropolitan area | 50 | 0.40 | 0.20 | $ 77.51 | $ 161,220 |
| South Florida nonmetropolitan area | 30 | 0.44 | 0.22 | $ 73.36 | $ 152,590 |
| Eastern New Mexico nonmetropolitan area | 50 | 0.32 | 0.16 | $ 72.11 | $ 149,980 |
These estimates are calculated with data collected from employers in all industry sectors, all metropolitan and nonmetropolitan areas, and all states and the District of Columbia. The top employment and wage figures are provided above. The complete list is available in the downloadable XLS files.
The percentile wage estimate is the value of a wage below which a certain percent of workers fall. The median wage is the 50th percentile wage estimate—50 percent of workers earn less than the median and 50 percent of workers earn more than the median. More about percentile wages.
(1) Estimates for detailed occupations do not sum to the totals because the totals include occupations not shown separately. Estimates do not include self-employed workers.
(2) Annual wages have been calculated by multiplying the hourly mean wage by a "year-round, full-time" hours figure of 2,080 hours; for those occupations where there is not an hourly wage published, the annual wage has been directly calculated from the reported survey data.
(3) The relative standard error (RSE) is a measure of the reliability of a survey statistic. The smaller the relative standard error, the more precise the estimate.
(5) This wage is equal to or greater than $100.00 per hour or $208,000 per year.
(9) The location quotient is the ratio of the area concentration of occupational employment to the national average concentration. A location quotient greater than one indicates the occupation has a higher share of employment than average, and a location quotient less than one indicates the occupation is less prevalent in the area than average.
Other OEWS estimates and related information:
May 2021 National Occupational Employment and Wage Estimates
May 2021 State Occupational Employment and Wage Estimates
May 2021 Metropolitan and Nonmetropolitan Area Occupational Employment and Wage Estimates
May 2021 National Industry-Specific Occupational Employment and Wage Estimates
Last Modified Date: March 31, 2022