
An official website of the United States government
An official website of the United States government
The .gov means it's official.
Federal government websites often end in .gov or .mil. Before sharing sensitive information,
make sure you're on a federal government site.
The site is secure.
The
https:// ensures that you are connecting to the official website and that any
information you provide is encrypted and transmitted securely.
Plan, direct, or coordinate activities to solicit and maintain funds for special projects or nonprofit organizations.
Employment estimate and mean wage estimates for Fundraising Managers:
| Employment (1) | Employment RSE (3) |
Mean hourly wage |
Mean annual wage (2) |
Wage RSE (3) |
|---|---|---|---|---|
| 23,190 | 1.8 % | $ 57.40 | $ 119,400 | 0.8 % |
Percentile wage estimates for Fundraising Managers:
| Percentile | 10% | 25% | 50% (Median) |
75% | 90% |
|---|---|---|---|---|---|
| Hourly Wage | $ 29.04 | $ 37.10 | $ 48.47 | $ 72.56 | $ 98.29 |
| Annual Wage (2) | $ 60,400 | $ 77,170 | $ 100,810 | $ 150,920 | $ 204,430 |
Industries with the highest published employment and wages for Fundraising Managers are provided. For a list of all industries with employment in Fundraising Managers, see the Create Customized Tables function.
Industries with the highest levels of employment in Fundraising Managers:
| Industry | Employment (1) | Percent of industry employment | Hourly mean wage | Annual mean wage (2) |
|---|---|---|---|---|
| Colleges, Universities, and Professional Schools | 4,960 | 0.17 | $ 60.92 | $ 126,710 |
| Grantmaking and Giving Services | 3,830 | 2.74 | $ 59.42 | $ 123,590 |
| Social Advocacy Organizations | 1,590 | 0.71 | $ 54.49 | $ 113,330 |
| General Medical and Surgical Hospitals | 1,200 | 0.02 | $ 66.51 | $ 138,340 |
| Individual and Family Services | 1,110 | 0.04 | $ 40.73 | $ 84,720 |
Industries with the highest concentration of employment in Fundraising Managers:
| Industry | Employment (1) | Percent of industry employment | Hourly mean wage | Annual mean wage (2) |
|---|---|---|---|---|
| Grantmaking and Giving Services | 3,830 | 2.74 | $ 59.42 | $ 123,590 |
| Social Advocacy Organizations | 1,590 | 0.71 | $ 54.49 | $ 113,330 |
| Museums, Historical Sites, and Similar Institutions | 590 | 0.45 | $ 56.38 | $ 117,270 |
| Community Food and Housing, and Emergency and Other Relief Services | 670 | 0.35 | $ 45.40 | $ 94,440 |
| Performing Arts Companies | 240 | 0.35 | $ 49.23 | $ 102,400 |
Top paying industries for Fundraising Managers:
| Industry | Employment (1) | Percent of industry employment | Hourly mean wage | Annual mean wage (2) |
|---|---|---|---|---|
| Spectator Sports | 60 | 0.06 | $ 88.31 | $ 183,680 |
| Advertising, Public Relations, and Related Services | 50 | 0.01 | $ 82.69 | $ 172,000 |
| Specialty (except Psychiatric and Substance Abuse) Hospitals | 240 | 0.09 | $ 81.50 | $ 169,510 |
| Securities, Commodity Contracts, and Other Financial Investments and Related Activities | 40 | (7) | $ 78.64 | $ 163,570 |
| Insurance Carriers | 40 | (7) | $ 76.51 | $ 159,130 |
States and areas with the highest published employment, location quotients, and wages for Fundraising Managers are provided. For a list of all areas with employment in Fundraising Managers, see the Create Customized Tables function.
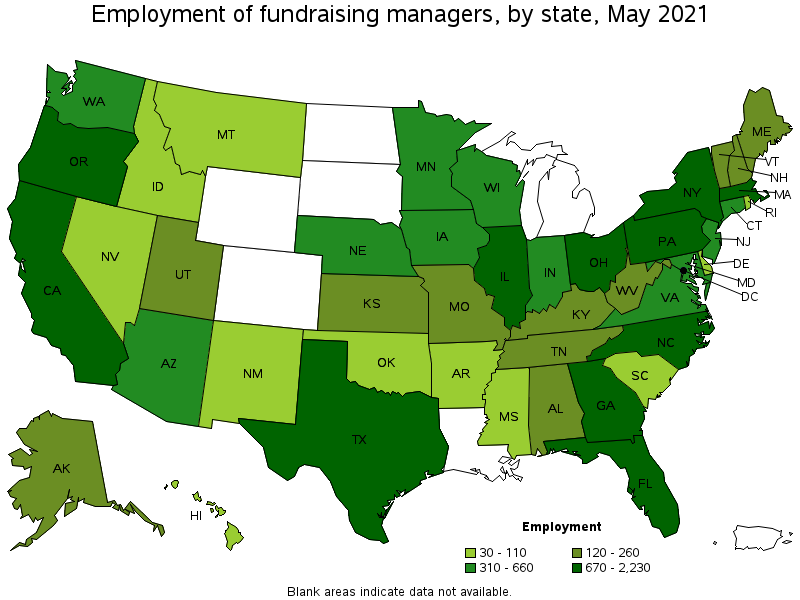
States with the highest employment level in Fundraising Managers:
| State | Employment (1) | Employment per thousand jobs | Location quotient (9) | Hourly mean wage | Annual mean wage (2) |
|---|---|---|---|---|---|
| California | 2,230 | 0.13 | 0.82 | $ 62.97 | $ 130,970 |
| Texas | 2,190 | 0.18 | 1.09 | $ 52.53 | $ 109,270 |
| New York | 1,980 | 0.23 | 1.39 | $ 82.81 | $ 172,240 |
| Illinois | 1,540 | 0.27 | 1.66 | $ 49.84 | $ 103,680 |
| Massachusetts | 1,250 | 0.37 | 2.23 | $ 71.22 | $ 148,150 |
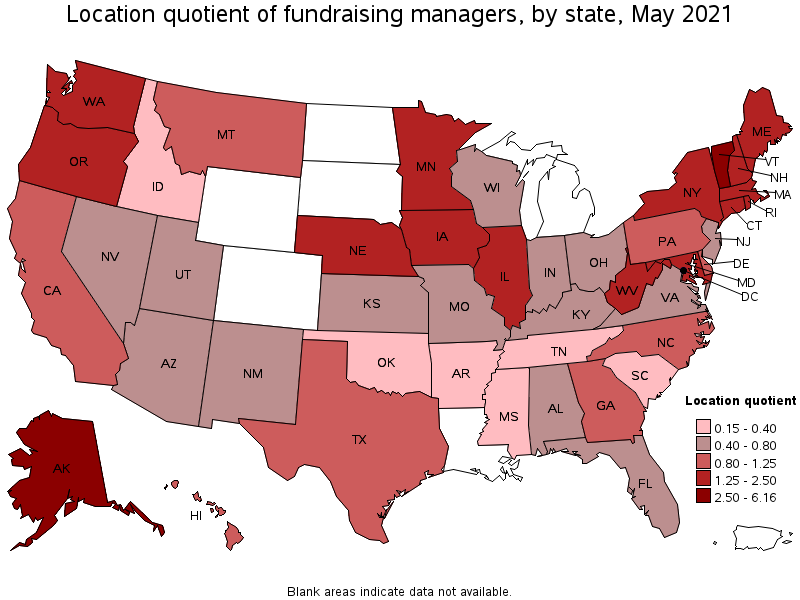
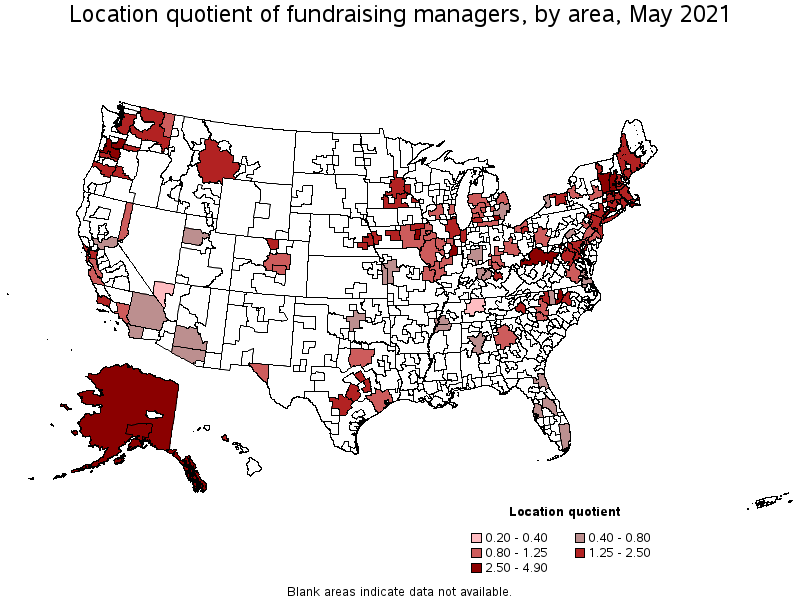
States with the highest concentration of jobs and location quotients in Fundraising Managers:
| State | Employment (1) | Employment per thousand jobs | Location quotient (9) | Hourly mean wage | Annual mean wage (2) |
|---|---|---|---|---|---|
| District of Columbia | 670 | 1.01 | 6.16 | $ 72.64 | $ 151,100 |
| Alaska | 140 | 0.48 | 2.91 | $ 38.09 | $ 79,230 |
| Vermont | 120 | 0.42 | 2.58 | $ 48.07 | $ 99,990 |
| Connecticut | 630 | 0.40 | 2.42 | $ 55.33 | $ 115,080 |
| Oregon | 720 | 0.40 | 2.40 | $ 40.93 | $ 85,130 |
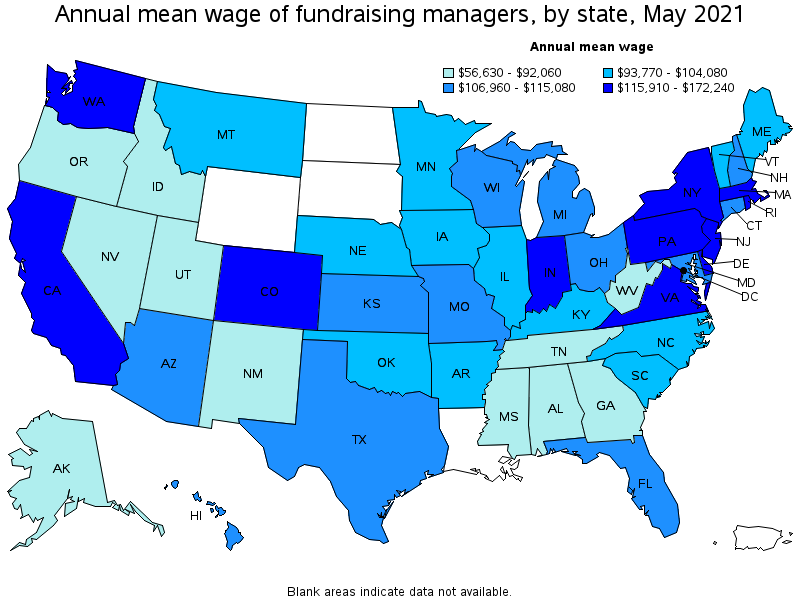
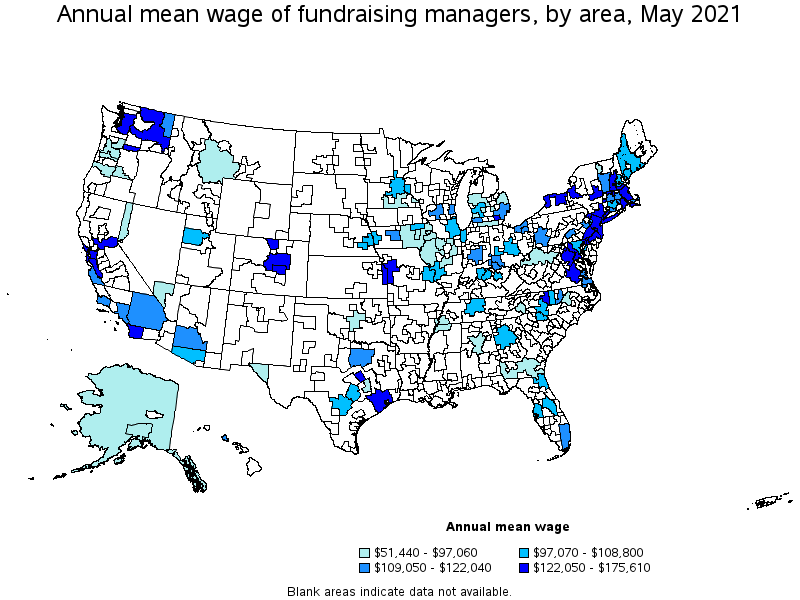
Top paying states for Fundraising Managers:
| State | Employment (1) | Employment per thousand jobs | Location quotient (9) | Hourly mean wage | Annual mean wage (2) |
|---|---|---|---|---|---|
| New York | 1,980 | 0.23 | 1.39 | $ 82.81 | $ 172,240 |
| Rhode Island | 100 | 0.23 | 1.37 | $ 75.07 | $ 156,140 |
| New Jersey | 490 | 0.13 | 0.78 | $ 74.96 | $ 155,910 |
| District of Columbia | 670 | 1.01 | 6.16 | $ 72.64 | $ 151,100 |
| Massachusetts | 1,250 | 0.37 | 2.23 | $ 71.22 | $ 148,150 |
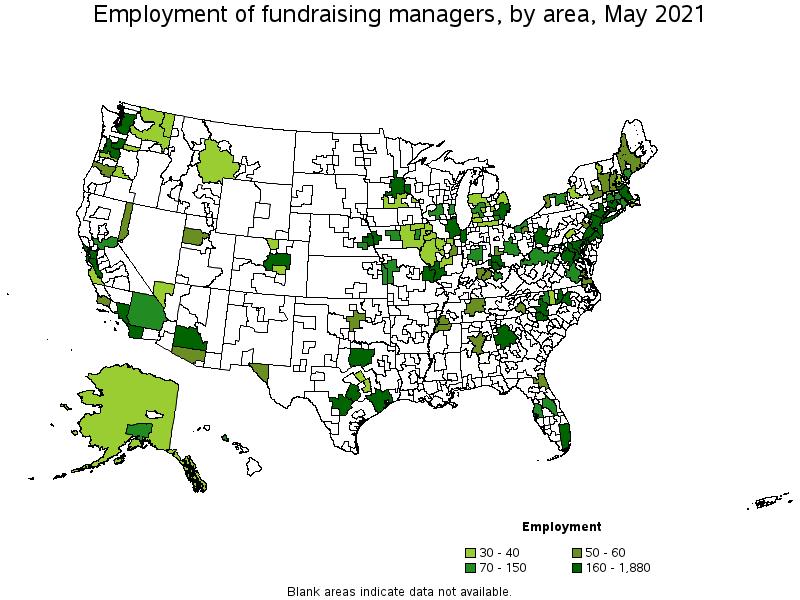
Metropolitan areas with the highest employment level in Fundraising Managers:
| Metropolitan area | Employment (1) | Employment per thousand jobs | Location quotient (9) | Hourly mean wage | Annual mean wage (2) |
|---|---|---|---|---|---|
| New York-Newark-Jersey City, NY-NJ-PA | 1,880 | 0.22 | 1.32 | $ 84.43 | $ 175,610 |
| Chicago-Naperville-Elgin, IL-IN-WI | 1,230 | 0.29 | 1.77 | $ 52.31 | $ 108,800 |
| Washington-Arlington-Alexandria, DC-VA-MD-WV | 1,000 | 0.34 | 2.06 | $ 70.59 | $ 146,820 |
| Boston-Cambridge-Nashua, MA-NH | 990 | 0.38 | 2.33 | $ 74.03 | $ 153,980 |
| Los Angeles-Long Beach-Anaheim, CA | 790 | 0.14 | 0.84 | $ 58.36 | $ 121,400 |
| Dallas-Fort Worth-Arlington, TX | 640 | 0.18 | 1.08 | $ 57.40 | $ 119,400 |
| San Francisco-Oakland-Hayward, CA | 570 | 0.25 | 1.54 | $ 72.09 | $ 149,940 |
| Houston-The Woodlands-Sugar Land, TX | 550 | 0.19 | 1.16 | $ 59.39 | $ 123,540 |
| Philadelphia-Camden-Wilmington, PA-NJ-DE-MD | 500 | 0.19 | 1.14 | $ 60.07 | $ 124,950 |
| Portland-Vancouver-Hillsboro, OR-WA | 500 | 0.44 | 2.69 | $ 43.36 | $ 90,190 |
Metropolitan areas with the highest concentration of jobs and location quotients in Fundraising Managers:
| Metropolitan area | Employment (1) | Employment per thousand jobs | Location quotient (9) | Hourly mean wage | Annual mean wage (2) |
|---|---|---|---|---|---|
| Iowa City, IA | 70 | 0.79 | 4.81 | $ 43.60 | $ 90,700 |
| Ann Arbor, MI | 140 | 0.67 | 4.08 | $ 62.62 | $ 130,250 |
| New Haven, CT | 160 | 0.57 | 3.47 | $ 54.75 | $ 113,870 |
| Durham-Chapel Hill, NC | 180 | 0.57 | 3.44 | $ 53.59 | $ 111,470 |
| Anchorage, AK | 90 | 0.55 | 3.34 | $ 37.11 | $ 77,180 |
| Champaign-Urbana, IL | 50 | 0.53 | 3.24 | $ 44.18 | $ 91,890 |
| Portland-Vancouver-Hillsboro, OR-WA | 500 | 0.44 | 2.69 | $ 43.36 | $ 90,190 |
| Bridgeport-Stamford-Norwalk, CT | 160 | 0.44 | 2.67 | $ 63.20 | $ 131,460 |
| Lincoln, NE | 70 | 0.41 | 2.49 | $ 51.62 | $ 107,360 |
| Eugene, OR | 60 | 0.41 | 2.47 | $ 36.31 | $ 75,520 |
Top paying metropolitan areas for Fundraising Managers:
| Metropolitan area | Employment (1) | Employment per thousand jobs | Location quotient (9) | Hourly mean wage | Annual mean wage (2) |
|---|---|---|---|---|---|
| New York-Newark-Jersey City, NY-NJ-PA | 1,880 | 0.22 | 1.32 | $ 84.43 | $ 175,610 |
| Syracuse, NY | 40 | 0.16 | 0.97 | $ 74.86 | $ 155,700 |
| Boston-Cambridge-Nashua, MA-NH | 990 | 0.38 | 2.33 | $ 74.03 | $ 153,980 |
| Providence-Warwick, RI-MA | 110 | 0.21 | 1.28 | $ 72.48 | $ 150,760 |
| San Francisco-Oakland-Hayward, CA | 570 | 0.25 | 1.54 | $ 72.09 | $ 149,940 |
| Washington-Arlington-Alexandria, DC-VA-MD-WV | 1,000 | 0.34 | 2.06 | $ 70.59 | $ 146,820 |
| Buffalo-Cheektowaga-Niagara Falls, NY | 50 | 0.10 | 0.63 | $ 69.63 | $ 144,820 |
| Rochester, NY | 120 | 0.25 | 1.53 | $ 69.34 | $ 144,220 |
| Albany-Schenectady-Troy, NY | 60 | 0.15 | 0.94 | $ 67.40 | $ 140,190 |
| Seattle-Tacoma-Bellevue, WA | 490 | 0.26 | 1.56 | $ 67.32 | $ 140,030 |
Nonmetropolitan areas with the highest employment in Fundraising Managers:
| Nonmetropolitan area | Employment (1) | Employment per thousand jobs | Location quotient (9) | Hourly mean wage | Annual mean wage (2) |
|---|---|---|---|---|---|
| Northern West Virginia nonmetropolitan area | 100 | 0.81 | 4.90 | $ 24.73 | $ 51,440 |
| West Central-Southwest New Hampshire nonmetropolitan area | 60 | 0.60 | 3.67 | $ 60.79 | $ 126,430 |
| Southern Vermont nonmetropolitan area | 60 | 0.59 | 3.58 | $ 54.01 | $ 112,330 |
| Southwest Maine nonmetropolitan area | 50 | 0.27 | 1.64 | $ 50.90 | $ 105,870 |
| Alaska nonmetropolitan area | 40 | 0.42 | 2.54 | $ 39.05 | $ 81,220 |
Nonmetropolitan areas with the highest concentration of jobs and location quotients in Fundraising Managers:
| Nonmetropolitan area | Employment (1) | Employment per thousand jobs | Location quotient (9) | Hourly mean wage | Annual mean wage (2) |
|---|---|---|---|---|---|
| Northern West Virginia nonmetropolitan area | 100 | 0.81 | 4.90 | $ 24.73 | $ 51,440 |
| Massachusetts nonmetropolitan area | 40 | 0.63 | 3.82 | $ 60.82 | $ 126,500 |
| West Central-Southwest New Hampshire nonmetropolitan area | 60 | 0.60 | 3.67 | $ 60.79 | $ 126,430 |
| Southern Vermont nonmetropolitan area | 60 | 0.59 | 3.58 | $ 54.01 | $ 112,330 |
| Alaska nonmetropolitan area | 40 | 0.42 | 2.54 | $ 39.05 | $ 81,220 |
Top paying nonmetropolitan areas for Fundraising Managers:
| Nonmetropolitan area | Employment (1) | Employment per thousand jobs | Location quotient (9) | Hourly mean wage | Annual mean wage (2) |
|---|---|---|---|---|---|
| Eastern Washington nonmetropolitan area | 30 | 0.35 | 2.14 | $ 61.71 | $ 128,360 |
| Massachusetts nonmetropolitan area | 40 | 0.63 | 3.82 | $ 60.82 | $ 126,500 |
| West Central-Southwest New Hampshire nonmetropolitan area | 60 | 0.60 | 3.67 | $ 60.79 | $ 126,430 |
| Southern Vermont nonmetropolitan area | 60 | 0.59 | 3.58 | $ 54.01 | $ 112,330 |
| Southwest Maine nonmetropolitan area | 50 | 0.27 | 1.64 | $ 50.90 | $ 105,870 |
These estimates are calculated with data collected from employers in all industry sectors, all metropolitan and nonmetropolitan areas, and all states and the District of Columbia. The top employment and wage figures are provided above. The complete list is available in the downloadable XLS files.
The percentile wage estimate is the value of a wage below which a certain percent of workers fall. The median wage is the 50th percentile wage estimate—50 percent of workers earn less than the median and 50 percent of workers earn more than the median. More about percentile wages.
(1) Estimates for detailed occupations do not sum to the totals because the totals include occupations not shown separately. Estimates do not include self-employed workers.
(2) Annual wages have been calculated by multiplying the hourly mean wage by a "year-round, full-time" hours figure of 2,080 hours; for those occupations where there is not an hourly wage published, the annual wage has been directly calculated from the reported survey data.
(3) The relative standard error (RSE) is a measure of the reliability of a survey statistic. The smaller the relative standard error, the more precise the estimate.
(7) The value is less than .005 percent of industry employment.
(9) The location quotient is the ratio of the area concentration of occupational employment to the national average concentration. A location quotient greater than one indicates the occupation has a higher share of employment than average, and a location quotient less than one indicates the occupation is less prevalent in the area than average.
Other OEWS estimates and related information:
May 2021 National Occupational Employment and Wage Estimates
May 2021 State Occupational Employment and Wage Estimates
May 2021 Metropolitan and Nonmetropolitan Area Occupational Employment and Wage Estimates
May 2021 National Industry-Specific Occupational Employment and Wage Estimates
Last Modified Date: March 31, 2022