
An official website of the United States government
An official website of the United States government
The .gov means it's official.
Federal government websites often end in .gov or .mil. Before sharing sensitive information,
make sure you're on a federal government site.
The site is secure.
The
https:// ensures that you are connecting to the official website and that any
information you provide is encrypted and transmitted securely.
Plan, direct, or coordinate activities in such fields as electronic data processing, information systems, systems analysis, and computer programming. Excludes �Computer Occupations� (15-1211 through 15-1299).
Employment estimate and mean wage estimates for Computer and Information Systems Managers:
| Employment (1) | Employment RSE (3) |
Mean hourly wage |
Mean annual wage (2) |
Wage RSE (3) |
|---|---|---|---|---|
| 485,190 | 0.9 % | $ 78.33 | $ 162,930 | 0.3 % |
Percentile wage estimates for Computer and Information Systems Managers:
| Percentile | 10% | 25% | 50% (Median) |
75% | 90% |
|---|---|---|---|---|---|
| Hourly Wage | $ 45.78 | $ 59.05 | $ 76.45 | $ 95.56 | (5) |
| Annual Wage (2) | $ 95,220 | $ 122,820 | $ 159,010 | $ 198,750 | (5) |
Industries with the highest published employment and wages for Computer and Information Systems Managers are provided. For a list of all industries with employment in Computer and Information Systems Managers, see the Create Customized Tables function.
Industries with the highest levels of employment in Computer and Information Systems Managers:
| Industry | Employment (1) | Percent of industry employment | Hourly mean wage | Annual mean wage (2) |
|---|---|---|---|---|
| Computer Systems Design and Related Services | 113,870 | 5.02 | $ 80.20 | $ 166,810 |
| Management of Companies and Enterprises | 48,910 | 1.93 | $ 79.23 | $ 164,800 |
| Software Publishers | 23,500 | 4.46 | $ 83.06 | $ 172,770 |
| Management, Scientific, and Technical Consulting Services | 20,150 | 1.30 | $ 82.80 | $ 172,220 |
| Insurance Carriers | 18,380 | 1.53 | $ 78.32 | $ 162,910 |
Industries with the highest concentration of employment in Computer and Information Systems Managers:
| Industry | Employment (1) | Percent of industry employment | Hourly mean wage | Annual mean wage (2) |
|---|---|---|---|---|
| Computer Systems Design and Related Services | 113,870 | 5.02 | $ 80.20 | $ 166,810 |
| Software Publishers | 23,500 | 4.46 | $ 83.06 | $ 172,770 |
| Data Processing, Hosting, and Related Services | 16,360 | 4.32 | $ 84.04 | $ 174,790 |
| Other Information Services | 13,300 | 3.67 | $ 105.92 | $ 220,320 |
| Monetary Authorities-Central Bank | 520 | 2.47 | $ 84.62 | $ 176,010 |
Top paying industries for Computer and Information Systems Managers:
| Industry | Employment (1) | Percent of industry employment | Hourly mean wage | Annual mean wage (2) |
|---|---|---|---|---|
| Other Information Services | 13,300 | 3.67 | $ 105.92 | $ 220,320 |
| Computer and Peripheral Equipment Manufacturing | 2,830 | 1.82 | $ 97.37 | $ 202,530 |
| Natural Gas Distribution | 370 | 0.33 | $ 94.63 | $ 196,840 |
| Other Support Activities for Transportation | 50 | 0.16 | $ 93.60 | $ 194,680 |
| Securities, Commodity Contracts, and Other Financial Investments and Related Activities | 10,170 | 1.06 | $ 93.18 | $ 193,810 |
States and areas with the highest published employment, location quotients, and wages for Computer and Information Systems Managers are provided. For a list of all areas with employment in Computer and Information Systems Managers, see the Create Customized Tables function.
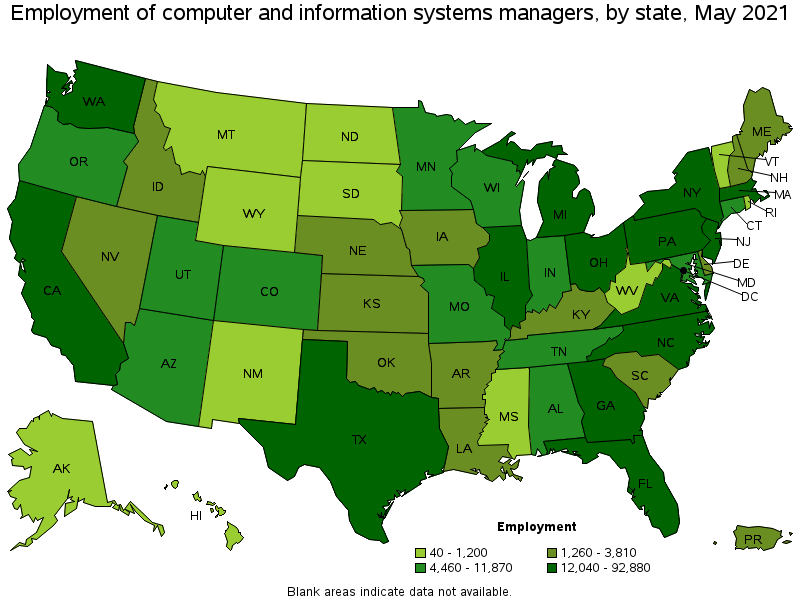
States with the highest employment level in Computer and Information Systems Managers:
| State | Employment (1) | Employment per thousand jobs | Location quotient (9) | Hourly mean wage | Annual mean wage (2) |
|---|---|---|---|---|---|
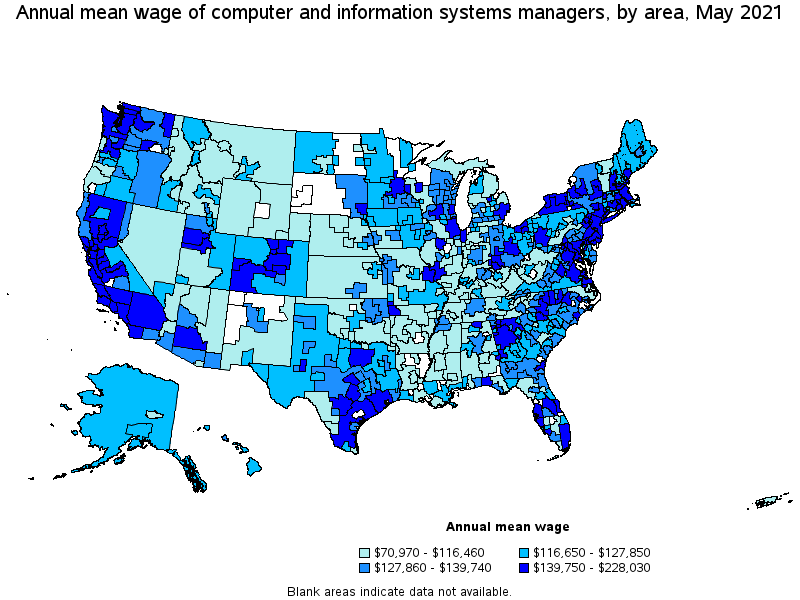
| California | 92,880 | 5.62 | 1.63 | $ 93.03 | $ 193,500 |
| Texas | 40,270 | 3.29 | 0.96 | $ 74.45 | $ 154,860 |
| New York | 29,360 | 3.39 | 0.98 | $ 94.18 | $ 195,900 |
| Florida | 22,670 | 2.63 | 0.76 | $ 70.34 | $ 146,310 |
| Massachusetts | 21,690 | 6.39 | 1.86 | $ 81.00 | $ 168,490 |
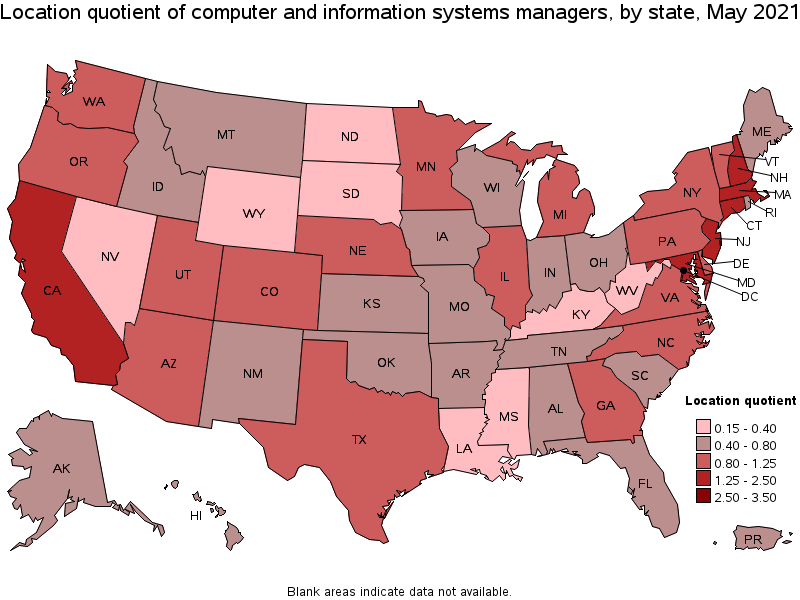
States with the highest concentration of jobs and location quotients in Computer and Information Systems Managers:
| State | Employment (1) | Employment per thousand jobs | Location quotient (9) | Hourly mean wage | Annual mean wage (2) |
|---|---|---|---|---|---|
| District of Columbia | 5,060 | 7.65 | 2.22 | $ 84.62 | $ 176,000 |
| Massachusetts | 21,690 | 6.39 | 1.86 | $ 81.00 | $ 168,490 |
| Connecticut | 9,870 | 6.28 | 1.82 | $ 72.93 | $ 151,700 |
| New Hampshire | 3,810 | 5.99 | 1.74 | $ 69.87 | $ 145,340 |
| California | 92,880 | 5.62 | 1.63 | $ 93.03 | $ 193,500 |
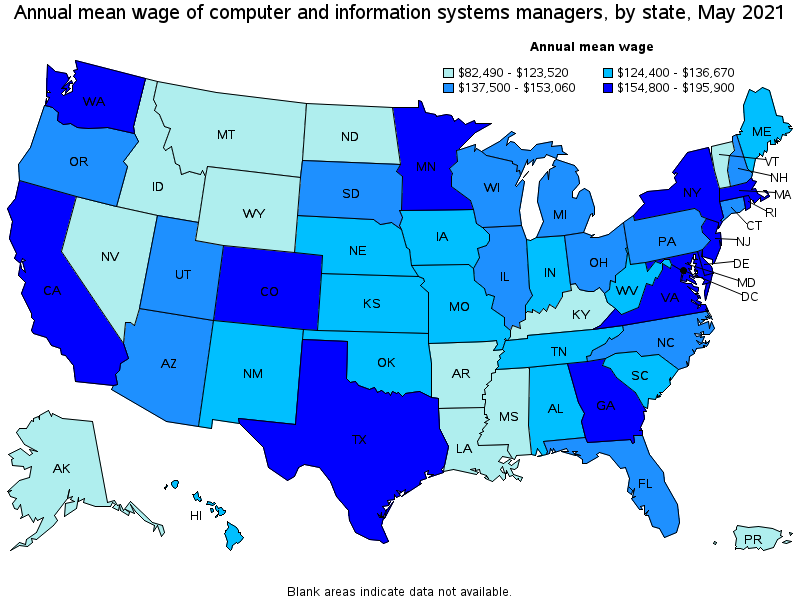
Top paying states for Computer and Information Systems Managers:
| State | Employment (1) | Employment per thousand jobs | Location quotient (9) | Hourly mean wage | Annual mean wage (2) |
|---|---|---|---|---|---|
| New York | 29,360 | 3.39 | 0.98 | $ 94.18 | $ 195,900 |
| California | 92,880 | 5.62 | 1.63 | $ 93.03 | $ 193,500 |
| New Jersey | 19,700 | 5.12 | 1.49 | $ 91.13 | $ 189,540 |
| Washington | 13,720 | 4.28 | 1.24 | $ 85.64 | $ 178,130 |
| District of Columbia | 5,060 | 7.65 | 2.22 | $ 84.62 | $ 176,000 |
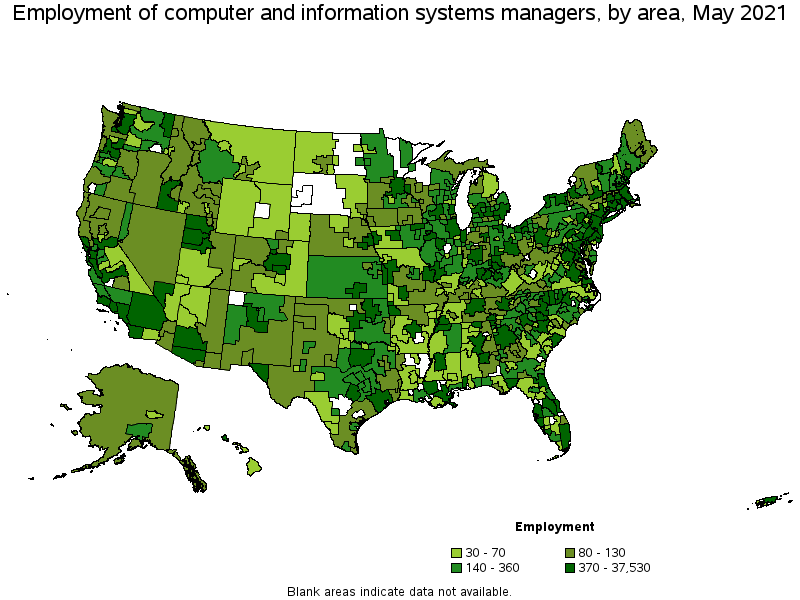
Metropolitan areas with the highest employment level in Computer and Information Systems Managers:
| Metropolitan area | Employment (1) | Employment per thousand jobs | Location quotient (9) | Hourly mean wage | Annual mean wage (2) |
|---|---|---|---|---|---|
| New York-Newark-Jersey City, NY-NJ-PA | 37,530 | 4.32 | 1.26 | $ 97.50 | $ 202,800 |
| San Francisco-Oakland-Hayward, CA | 25,690 | 11.46 | 3.33 | $ 101.67 | $ 211,470 |
| Los Angeles-Long Beach-Anaheim, CA | 24,140 | 4.22 | 1.23 | $ 83.11 | $ 172,880 |
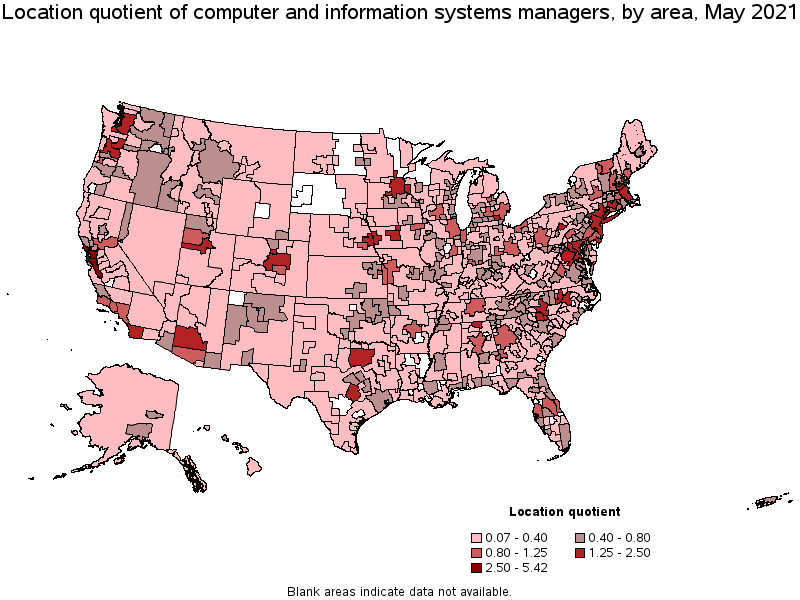
| San Jose-Sunnyvale-Santa Clara, CA | 19,930 | 18.65 | 5.42 | $ 109.63 | $ 228,030 |
| Boston-Cambridge-Nashua, MA-NH | 19,180 | 7.42 | 2.15 | $ 82.70 | $ 172,010 |
| Washington-Arlington-Alexandria, DC-VA-MD-WV | 17,620 | 6.01 | 1.75 | $ 85.32 | $ 177,460 |
| Dallas-Fort Worth-Arlington, TX | 15,980 | 4.45 | 1.29 | $ 76.45 | $ 159,010 |
| Chicago-Naperville-Elgin, IL-IN-WI | 15,130 | 3.57 | 1.04 | $ 75.59 | $ 157,220 |
| Seattle-Tacoma-Bellevue, WA | 11,220 | 5.85 | 1.70 | $ 89.04 | $ 185,210 |
| Atlanta-Sandy Springs-Roswell, GA | 10,640 | 4.11 | 1.19 | $ 78.11 | $ 162,470 |
Metropolitan areas with the highest concentration of jobs and location quotients in Computer and Information Systems Managers:
| Metropolitan area | Employment (1) | Employment per thousand jobs | Location quotient (9) | Hourly mean wage | Annual mean wage (2) |
|---|---|---|---|---|---|
| San Jose-Sunnyvale-Santa Clara, CA | 19,930 | 18.65 | 5.42 | $ 109.63 | $ 228,030 |
| San Francisco-Oakland-Hayward, CA | 25,690 | 11.46 | 3.33 | $ 101.67 | $ 211,470 |
| Durham-Chapel Hill, NC | 2,670 | 8.55 | 2.48 | $ 73.04 | $ 151,910 |
| Hartford-West Hartford-East Hartford, CT | 4,100 | 7.53 | 2.19 | $ 73.30 | $ 152,470 |
| Boston-Cambridge-Nashua, MA-NH | 19,180 | 7.42 | 2.15 | $ 82.70 | $ 172,010 |
| Dover-Durham, NH-ME | 340 | 6.93 | 2.01 | $ 65.41 | $ 136,040 |
| Bridgeport-Stamford-Norwalk, CT | 2,570 | 6.84 | 1.99 | $ 81.04 | $ 168,570 |
| Trenton, NJ | 1,550 | 6.84 | 1.99 | $ 85.33 | $ 177,490 |
| Austin-Round Rock, TX | 6,930 | 6.46 | 1.88 | $ 76.65 | $ 159,430 |
| Huntsville, AL | 1,390 | 6.02 | 1.75 | $ 67.94 | $ 141,310 |
Top paying metropolitan areas for Computer and Information Systems Managers:
| Metropolitan area | Employment (1) | Employment per thousand jobs | Location quotient (9) | Hourly mean wage | Annual mean wage (2) |
|---|---|---|---|---|---|
| San Jose-Sunnyvale-Santa Clara, CA | 19,930 | 18.65 | 5.42 | $ 109.63 | $ 228,030 |
| San Francisco-Oakland-Hayward, CA | 25,690 | 11.46 | 3.33 | $ 101.67 | $ 211,470 |
| New York-Newark-Jersey City, NY-NJ-PA | 37,530 | 4.32 | 1.26 | $ 97.50 | $ 202,800 |
| Seattle-Tacoma-Bellevue, WA | 11,220 | 5.85 | 1.70 | $ 89.04 | $ 185,210 |
| Boulder, CO | 890 | 4.89 | 1.42 | $ 87.06 | $ 181,080 |
| Santa Cruz-Watsonville, CA | 250 | 2.66 | 0.77 | $ 86.08 | $ 179,040 |
| Trenton, NJ | 1,550 | 6.84 | 1.99 | $ 85.33 | $ 177,490 |
| Washington-Arlington-Alexandria, DC-VA-MD-WV | 17,620 | 6.01 | 1.75 | $ 85.32 | $ 177,460 |
| Denver-Aurora-Lakewood, CO | 6,920 | 4.72 | 1.37 | $ 84.12 | $ 174,970 |
| San Diego-Carlsbad, CA | 7,220 | 5.19 | 1.51 | $ 83.51 | $ 173,700 |
Nonmetropolitan areas with the highest employment in Computer and Information Systems Managers:
| Nonmetropolitan area | Employment (1) | Employment per thousand jobs | Location quotient (9) | Hourly mean wage | Annual mean wage (2) |
|---|---|---|---|---|---|
| Kansas nonmetropolitan area | 330 | 0.89 | 0.26 | $ 53.28 | $ 110,820 |
| Balance of Lower Peninsula of Michigan nonmetropolitan area | 330 | 1.29 | 0.37 | $ 53.12 | $ 110,500 |
| Piedmont North Carolina nonmetropolitan area | 310 | 1.27 | 0.37 | $ 65.02 | $ 135,250 |
| West Central-Southwest New Hampshire nonmetropolitan area | 300 | 3.07 | 0.89 | $ 70.05 | $ 145,690 |
| Southwest Montana nonmetropolitan area | 290 | 2.06 | 0.60 | $ 54.11 | $ 112,550 |
Nonmetropolitan areas with the highest concentration of jobs and location quotients in Computer and Information Systems Managers:
| Nonmetropolitan area | Employment (1) | Employment per thousand jobs | Location quotient (9) | Hourly mean wage | Annual mean wage (2) |
|---|---|---|---|---|---|
| West Central-Southwest New Hampshire nonmetropolitan area | 300 | 3.07 | 0.89 | $ 70.05 | $ 145,690 |
| Northern Vermont nonmetropolitan area | 200 | 3.06 | 0.89 | $ 52.74 | $ 109,690 |
| Central New Hampshire nonmetropolitan area | 240 | 2.67 | 0.78 | $ 60.29 | $ 125,400 |
| Southern Vermont nonmetropolitan area | 240 | 2.50 | 0.73 | $ 47.00 | $ 97,760 |
| Northern New Mexico nonmetropolitan area | 180 | 2.36 | 0.69 | (8) | (8) |
Top paying nonmetropolitan areas for Computer and Information Systems Managers:
| Nonmetropolitan area | Employment (1) | Employment per thousand jobs | Location quotient (9) | Hourly mean wage | Annual mean wage (2) |
|---|---|---|---|---|---|
| Southwest New York nonmetropolitan area | 170 | 1.04 | 0.30 | $ 71.25 | $ 148,200 |
| West Central-Southwest New Hampshire nonmetropolitan area | 300 | 3.07 | 0.89 | $ 70.05 | $ 145,690 |
| North Valley-Northern Mountains Region of California nonmetropolitan area | 110 | 1.08 | 0.31 | $ 69.92 | $ 145,440 |
| Southwest Colorado nonmetropolitan area | 80 | 0.84 | 0.24 | $ 69.53 | $ 144,620 |
| Western Washington nonmetropolitan area | 100 | 0.87 | 0.25 | $ 68.85 | $ 143,210 |
These estimates are calculated with data collected from employers in all industry sectors, all metropolitan and nonmetropolitan areas, and all states and the District of Columbia. The top employment and wage figures are provided above. The complete list is available in the downloadable XLS files.
The percentile wage estimate is the value of a wage below which a certain percent of workers fall. The median wage is the 50th percentile wage estimate—50 percent of workers earn less than the median and 50 percent of workers earn more than the median. More about percentile wages.
(1) Estimates for detailed occupations do not sum to the totals because the totals include occupations not shown separately. Estimates do not include self-employed workers.
(2) Annual wages have been calculated by multiplying the hourly mean wage by a "year-round, full-time" hours figure of 2,080 hours; for those occupations where there is not an hourly wage published, the annual wage has been directly calculated from the reported survey data.
(3) The relative standard error (RSE) is a measure of the reliability of a survey statistic. The smaller the relative standard error, the more precise the estimate.
(5) This wage is equal to or greater than $100.00 per hour or $208,000 per year.
(8) Estimate not released.
(9) The location quotient is the ratio of the area concentration of occupational employment to the national average concentration. A location quotient greater than one indicates the occupation has a higher share of employment than average, and a location quotient less than one indicates the occupation is less prevalent in the area than average.
Other OEWS estimates and related information:
May 2021 National Occupational Employment and Wage Estimates
May 2021 State Occupational Employment and Wage Estimates
May 2021 Metropolitan and Nonmetropolitan Area Occupational Employment and Wage Estimates
May 2021 National Industry-Specific Occupational Employment and Wage Estimates
Last Modified Date: March 31, 2022