
An official website of the United States government
An official website of the United States government
The .gov means it's official.
Federal government websites often end in .gov or .mil. Before sharing sensitive information,
make sure you're on a federal government site.
The site is secure.
The
https:// ensures that you are connecting to the official website and that any
information you provide is encrypted and transmitted securely.
Analyze and coordinate the ongoing logistical functions of a firm or organization. Responsible for the entire life cycle of a product, including acquisition, distribution, internal allocation, delivery, and final disposal of resources. Excludes �Transportation, Storage, and Distribution Managers� (11-3071) and �Project Management Specialists� (13-1082).
Employment estimate and mean wage estimates for Logisticians:
| Employment (1) | Employment RSE (3) |
Mean hourly wage |
Mean annual wage (2) |
Wage RSE (3) |
|---|---|---|---|---|
| 189,320 | 1.0 % | $ 38.09 | $ 79,230 | 0.5 % |
Percentile wage estimates for Logisticians:
| Percentile | 10% | 25% | 50% (Median) |
75% | 90% |
|---|---|---|---|---|---|
| Hourly Wage | $ 21.71 | $ 28.72 | $ 37.03 | $ 47.44 | $ 58.84 |
| Annual Wage (2) | $ 45,160 | $ 59,740 | $ 77,030 | $ 98,680 | $ 122,390 |
Industries with the highest published employment and wages for Logisticians are provided. For a list of all industries with employment in Logisticians, see the Create Customized Tables function.
Industries with the highest levels of employment in Logisticians:
| Industry | Employment (1) | Percent of industry employment | Hourly mean wage | Annual mean wage (2) |
|---|---|---|---|---|
| Federal Executive Branch (OEWS Designation) | 32,140 | 1.52 | $ 44.32 | $ 92,180 |
| Management of Companies and Enterprises | 20,700 | 0.81 | $ 40.64 | $ 84,530 |
| Management, Scientific, and Technical Consulting Services | 14,390 | 0.93 | $ 33.96 | $ 70,650 |
| Aerospace Product and Parts Manufacturing | 7,520 | 1.60 | $ 43.14 | $ 89,720 |
| Freight Transportation Arrangement | 6,230 | 2.67 | $ 28.02 | $ 58,290 |
Industries with the highest concentration of employment in Logisticians:
| Industry | Employment (1) | Percent of industry employment | Hourly mean wage | Annual mean wage (2) |
|---|---|---|---|---|
| Freight Transportation Arrangement | 6,230 | 2.67 | $ 28.02 | $ 58,290 |
| Aerospace Product and Parts Manufacturing | 7,520 | 1.60 | $ 43.14 | $ 89,720 |
| Federal Executive Branch (OEWS Designation) | 32,140 | 1.52 | $ 44.32 | $ 92,180 |
| Deep Sea, Coastal, and Great Lakes Water Transportation | 400 | 1.24 | $ 41.46 | $ 86,240 |
| Communications Equipment Manufacturing | 990 | 1.17 | $ 33.48 | $ 69,630 |
Top paying industries for Logisticians:
| Industry | Employment (1) | Percent of industry employment | Hourly mean wage | Annual mean wage (2) |
|---|---|---|---|---|
| Oil and Gas Extraction | 330 | 0.31 | $ 61.55 | $ 128,020 |
| Computer and Peripheral Equipment Manufacturing | 1,230 | 0.79 | $ 54.83 | $ 114,050 |
| Educational Support Services | 90 | 0.04 | $ 53.13 | $ 110,520 |
| Petroleum and Coal Products Manufacturing | 820 | 0.79 | $ 51.95 | $ 108,060 |
| Data Processing, Hosting, and Related Services | 490 | 0.13 | $ 50.58 | $ 105,210 |
States and areas with the highest published employment, location quotients, and wages for Logisticians are provided. For a list of all areas with employment in Logisticians, see the Create Customized Tables function.
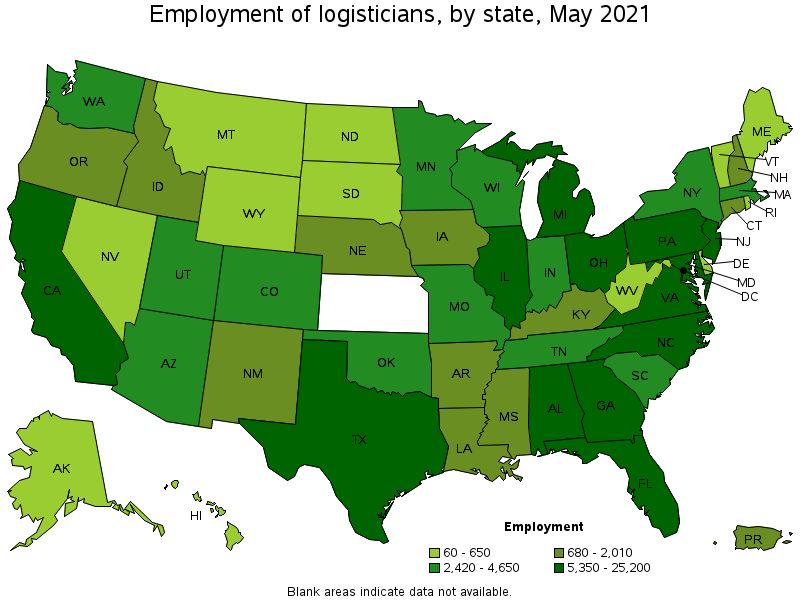
States with the highest employment level in Logisticians:
| State | Employment (1) | Employment per thousand jobs | Location quotient (9) | Hourly mean wage | Annual mean wage (2) |
|---|---|---|---|---|---|
| California | 25,200 | 1.52 | 1.13 | $ 42.72 | $ 88,870 |
| Texas | 13,320 | 1.09 | 0.81 | $ 36.86 | $ 76,660 |
| Illinois | 11,460 | 2.04 | 1.52 | $ 32.37 | $ 67,320 |
| Georgia | 9,800 | 2.24 | 1.67 | $ 34.75 | $ 72,290 |
| Florida | 9,380 | 1.09 | 0.81 | $ 33.32 | $ 69,310 |
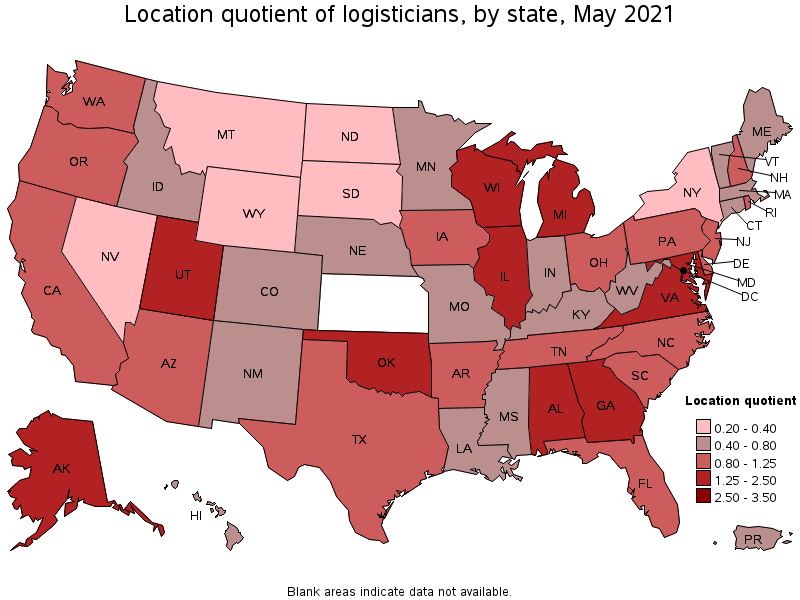
States with the highest concentration of jobs and location quotients in Logisticians:
| State | Employment (1) | Employment per thousand jobs | Location quotient (9) | Hourly mean wage | Annual mean wage (2) |
|---|---|---|---|---|---|
| Alabama | 5,350 | 2.78 | 2.07 | $ 41.26 | $ 85,820 |
| Virginia | 8,840 | 2.35 | 1.75 | $ 40.10 | $ 83,400 |
| Georgia | 9,800 | 2.24 | 1.67 | $ 34.75 | $ 72,290 |
| Maryland | 5,600 | 2.20 | 1.64 | $ 47.89 | $ 99,600 |
| Oklahoma | 3,380 | 2.17 | 1.62 | $ 38.39 | $ 79,860 |
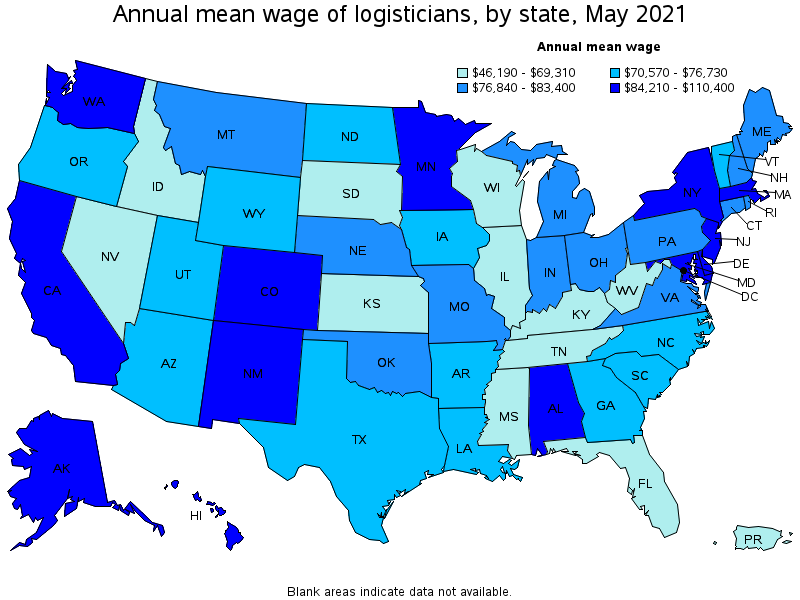
Top paying states for Logisticians:
| State | Employment (1) | Employment per thousand jobs | Location quotient (9) | Hourly mean wage | Annual mean wage (2) |
|---|---|---|---|---|---|
| District of Columbia | 1,050 | 1.59 | 1.18 | $ 53.08 | $ 110,400 |
| Maryland | 5,600 | 2.20 | 1.64 | $ 47.89 | $ 99,600 |
| Delaware | 650 | 1.49 | 1.11 | $ 46.44 | $ 96,590 |
| New Jersey | 5,710 | 1.48 | 1.10 | $ 44.60 | $ 92,770 |
| Washington | 4,210 | 1.31 | 0.98 | $ 43.94 | $ 91,390 |
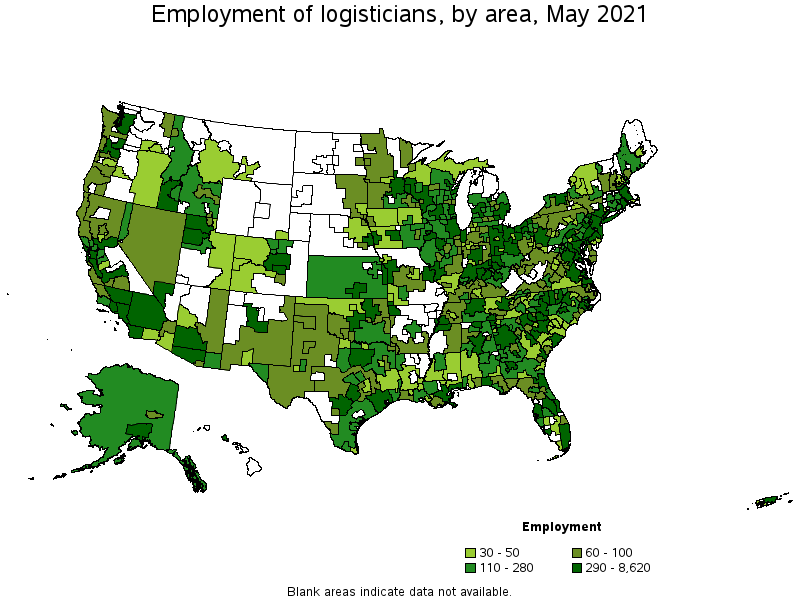
Metropolitan areas with the highest employment level in Logisticians:
| Metropolitan area | Employment (1) | Employment per thousand jobs | Location quotient (9) | Hourly mean wage | Annual mean wage (2) |
|---|---|---|---|---|---|
| Chicago-Naperville-Elgin, IL-IN-WI | 8,620 | 2.04 | 1.51 | $ 31.04 | $ 64,560 |
| Los Angeles-Long Beach-Anaheim, CA | 8,540 | 1.49 | 1.11 | $ 40.82 | $ 84,900 |
| New York-Newark-Jersey City, NY-NJ-PA | 7,280 | 0.84 | 0.62 | $ 44.38 | $ 92,310 |
| Washington-Arlington-Alexandria, DC-VA-MD-WV | 6,400 | 2.18 | 1.62 | $ 46.86 | $ 97,470 |
| Detroit-Warren-Dearborn, MI | 5,070 | 2.82 | 2.10 | $ 42.18 | $ 87,730 |
| Atlanta-Sandy Springs-Roswell, GA | 4,860 | 1.88 | 1.40 | $ 34.18 | $ 71,100 |
| Dallas-Fort Worth-Arlington, TX | 4,840 | 1.35 | 1.00 | $ 36.00 | $ 74,880 |
| Philadelphia-Camden-Wilmington, PA-NJ-DE-MD | 4,720 | 1.78 | 1.32 | $ 40.08 | $ 83,370 |
| San Francisco-Oakland-Hayward, CA | 4,310 | 1.92 | 1.43 | $ 45.39 | $ 94,400 |
| Houston-The Woodlands-Sugar Land, TX | 3,380 | 1.17 | 0.87 | $ 38.63 | $ 80,340 |
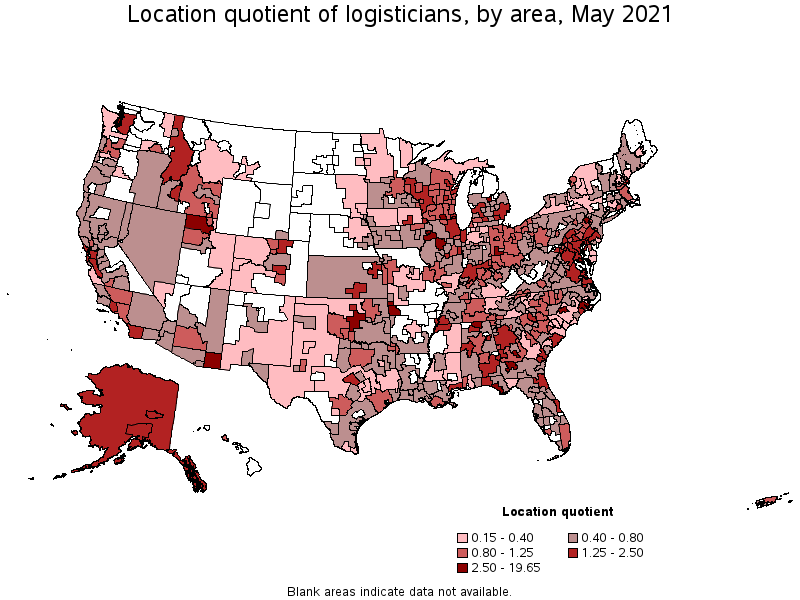
Metropolitan areas with the highest concentration of jobs and location quotients in Logisticians:
| Metropolitan area | Employment (1) | Employment per thousand jobs | Location quotient (9) | Hourly mean wage | Annual mean wage (2) |
|---|---|---|---|---|---|
| California-Lexington Park, MD | 1,220 | 26.41 | 19.65 | $ 55.34 | $ 115,100 |
| Warner Robins, GA | 1,560 | 21.06 | 15.67 | $ 39.14 | $ 81,420 |
| Huntsville, AL | 3,240 | 14.09 | 10.48 | $ 46.69 | $ 97,120 |
| New Bern, NC | 550 | 12.74 | 9.48 | $ 38.19 | $ 79,440 |
| Midland, MI | 290 | 8.49 | 6.32 | $ 40.05 | $ 83,310 |
| Albany, GA | 340 | 5.84 | 4.34 | $ 39.40 | $ 81,950 |
| Ogden-Clearfield, UT | 1,440 | 5.35 | 3.98 | $ 39.26 | $ 81,670 |
| Fayetteville, NC | 610 | 4.93 | 3.67 | $ 39.41 | $ 81,970 |
| Davenport-Moline-Rock Island, IA-IL | 740 | 4.29 | 3.19 | $ 41.36 | $ 86,040 |
| Bremerton-Silverdale, WA | 370 | 4.27 | 3.18 | $ 41.63 | $ 86,590 |
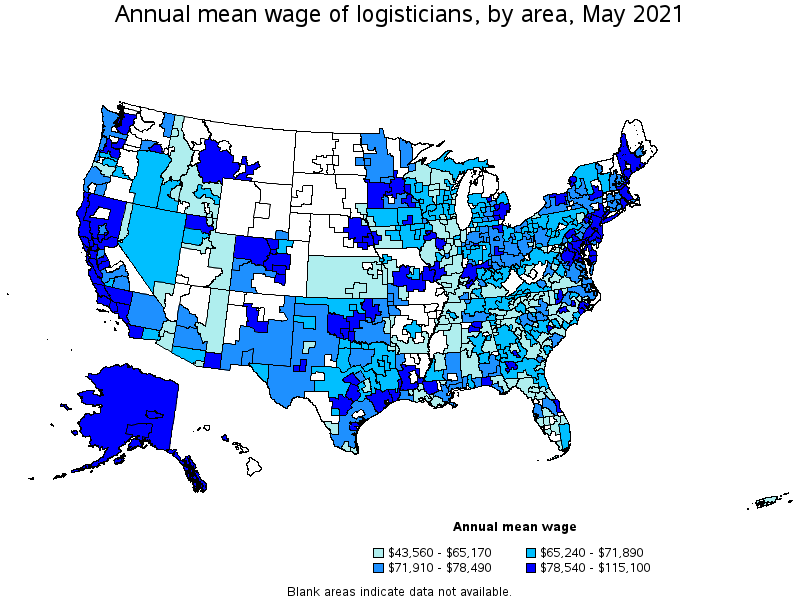
Top paying metropolitan areas for Logisticians:
| Metropolitan area | Employment (1) | Employment per thousand jobs | Location quotient (9) | Hourly mean wage | Annual mean wage (2) |
|---|---|---|---|---|---|
| California-Lexington Park, MD | 1,220 | 26.41 | 19.65 | $ 55.34 | $ 115,100 |
| San Jose-Sunnyvale-Santa Clara, CA | 2,630 | 2.46 | 1.83 | $ 53.72 | $ 111,740 |
| Kokomo, IN | 50 | 1.48 | 1.10 | $ 48.71 | $ 101,310 |
| Washington-Arlington-Alexandria, DC-VA-MD-WV | 6,400 | 2.18 | 1.62 | $ 46.86 | $ 97,470 |
| Baltimore-Columbia-Towson, MD | 2,780 | 2.21 | 1.65 | $ 46.80 | $ 97,350 |
| Huntsville, AL | 3,240 | 14.09 | 10.48 | $ 46.69 | $ 97,120 |
| Atlantic City-Hammonton, NJ | 40 | 0.38 | 0.29 | $ 46.56 | $ 96,850 |
| Trenton, NJ | 280 | 1.21 | 0.90 | $ 46.50 | $ 96,720 |
| Seattle-Tacoma-Bellevue, WA | 3,310 | 1.73 | 1.28 | $ 45.55 | $ 94,740 |
| San Francisco-Oakland-Hayward, CA | 4,310 | 1.92 | 1.43 | $ 45.39 | $ 94,400 |
Nonmetropolitan areas with the highest employment in Logisticians:
| Nonmetropolitan area | Employment (1) | Employment per thousand jobs | Location quotient (9) | Hourly mean wage | Annual mean wage (2) |
|---|---|---|---|---|---|
| Southern Indiana nonmetropolitan area | 480 | 2.62 | 1.95 | $ 40.38 | $ 83,990 |
| North Northeastern Ohio nonmetropolitan area (noncontiguous) | 400 | 1.27 | 0.95 | $ 32.65 | $ 67,920 |
| West Northwestern Ohio nonmetropolitan area | 380 | 1.60 | 1.19 | $ 34.64 | $ 72,040 |
| Western Wisconsin nonmetropolitan area | 330 | 2.45 | 1.83 | $ 32.48 | $ 67,550 |
| Kansas nonmetropolitan area | 280 | 0.74 | 0.55 | $ 25.70 | $ 53,450 |
Nonmetropolitan areas with the highest concentration of jobs and location quotients in Logisticians:
| Nonmetropolitan area | Employment (1) | Employment per thousand jobs | Location quotient (9) | Hourly mean wage | Annual mean wage (2) |
|---|---|---|---|---|---|
| Southern Indiana nonmetropolitan area | 480 | 2.62 | 1.95 | $ 40.38 | $ 83,990 |
| Western Wisconsin nonmetropolitan area | 330 | 2.45 | 1.83 | $ 32.48 | $ 67,550 |
| Southeast Alabama nonmetropolitan area | 180 | 2.13 | 1.59 | $ 34.68 | $ 72,140 |
| Northwestern Idaho nonmetropolitan area | 130 | 1.82 | 1.36 | $ 24.26 | $ 50,450 |
| Alaska nonmetropolitan area | 170 | 1.76 | 1.31 | $ 42.09 | $ 87,550 |
Top paying nonmetropolitan areas for Logisticians:
| Nonmetropolitan area | Employment (1) | Employment per thousand jobs | Location quotient (9) | Hourly mean wage | Annual mean wage (2) |
|---|---|---|---|---|---|
| North Coast Region of California nonmetropolitan area | 60 | 0.59 | 0.44 | $ 42.31 | $ 88,010 |
| Alaska nonmetropolitan area | 170 | 1.76 | 1.31 | $ 42.09 | $ 87,550 |
| Northeast Nebraska nonmetropolitan area | 40 | 0.47 | 0.35 | $ 42.09 | $ 87,540 |
| Northwest Colorado nonmetropolitan area | 40 | 0.36 | 0.27 | $ 42.04 | $ 87,430 |
| Central Louisiana nonmetropolitan area | 40 | 0.60 | 0.44 | $ 41.41 | $ 86,130 |
These estimates are calculated with data collected from employers in all industry sectors, all metropolitan and nonmetropolitan areas, and all states and the District of Columbia. The top employment and wage figures are provided above. The complete list is available in the downloadable XLS files.
The percentile wage estimate is the value of a wage below which a certain percent of workers fall. The median wage is the 50th percentile wage estimate—50 percent of workers earn less than the median and 50 percent of workers earn more than the median. More about percentile wages.
(1) Estimates for detailed occupations do not sum to the totals because the totals include occupations not shown separately. Estimates do not include self-employed workers.
(2) Annual wages have been calculated by multiplying the hourly mean wage by a "year-round, full-time" hours figure of 2,080 hours; for those occupations where there is not an hourly wage published, the annual wage has been directly calculated from the reported survey data.
(3) The relative standard error (RSE) is a measure of the reliability of a survey statistic. The smaller the relative standard error, the more precise the estimate.
(9) The location quotient is the ratio of the area concentration of occupational employment to the national average concentration. A location quotient greater than one indicates the occupation has a higher share of employment than average, and a location quotient less than one indicates the occupation is less prevalent in the area than average.
Other OEWS estimates and related information:
May 2021 National Occupational Employment and Wage Estimates
May 2021 State Occupational Employment and Wage Estimates
May 2021 Metropolitan and Nonmetropolitan Area Occupational Employment and Wage Estimates
May 2021 National Industry-Specific Occupational Employment and Wage Estimates
Last Modified Date: March 31, 2022