
An official website of the United States government
An official website of the United States government
The .gov means it's official.
Federal government websites often end in .gov or .mil. Before sharing sensitive information,
make sure you're on a federal government site.
The site is secure.
The
https:// ensures that you are connecting to the official website and that any
information you provide is encrypted and transmitted securely.
Analyze and coordinate the schedule, timeline, procurement, staffing, and budget of a product or service on a per project basis. Lead and guide the work of technical staff. May serve as a point of contact for the client or customer. Excludes �Management Occupations� (11-0000), �Logisticians� (13-1081), �Meeting, Convention, and Event Planners� (13-1121), and �Production, Planning, and Expediting Clerks� (43-5061).
Employment estimate and mean wage estimates for Project Management Specialists:
| Employment (1) | Employment RSE (3) |
Mean hourly wage |
Mean annual wage (2) |
Wage RSE (3) |
|---|---|---|---|---|
| 743,860 | 0.8 % | $ 47.32 | $ 98,420 | 0.4 % |
Percentile wage estimates for Project Management Specialists:
| Percentile | 10% | 25% | 50% (Median) |
75% | 90% |
|---|---|---|---|---|---|
| Hourly Wage | $ 23.92 | $ 30.89 | $ 45.43 | $ 60.30 | $ 76.51 |
| Annual Wage (2) | $ 49,750 | $ 64,250 | $ 94,500 | $ 125,430 | $ 159,140 |
Industries with the highest published employment and wages for Project Management Specialists are provided. For a list of all industries with employment in Project Management Specialists, see the Create Customized Tables function.
Industries with the highest levels of employment in Project Management Specialists:
| Industry | Employment (1) | Percent of industry employment | Hourly mean wage | Annual mean wage (2) |
|---|---|---|---|---|
| Computer Systems Design and Related Services | 63,680 | 2.81 | $ 55.26 | $ 114,930 |
| Architectural, Engineering, and Related Services | 61,000 | 4.04 | $ 50.26 | $ 104,540 |
| Management, Scientific, and Technical Consulting Services | 53,680 | 3.45 | $ 49.19 | $ 102,320 |
| Nonresidential Building Construction | 49,170 | 6.32 | $ 48.54 | $ 100,970 |
| Management of Companies and Enterprises | 38,940 | 1.53 | $ 51.05 | $ 106,180 |
Industries with the highest concentration of employment in Project Management Specialists:
| Industry | Employment (1) | Percent of industry employment | Hourly mean wage | Annual mean wage (2) |
|---|---|---|---|---|
| Nonresidential Building Construction | 49,170 | 6.32 | $ 48.54 | $ 100,970 |
| Architectural, Engineering, and Related Services | 61,000 | 4.04 | $ 50.26 | $ 104,540 |
| Land Subdivision | 1,290 | 3.88 | $ 51.15 | $ 106,390 |
| Management, Scientific, and Technical Consulting Services | 53,680 | 3.45 | $ 49.19 | $ 102,320 |
| Specialized Design Services | 4,240 | 3.13 | $ 36.47 | $ 75,850 |
Top paying industries for Project Management Specialists:
| Industry | Employment (1) | Percent of industry employment | Hourly mean wage | Annual mean wage (2) |
|---|---|---|---|---|
| Oil and Gas Extraction | 860 | 0.81 | $ 72.96 | $ 151,750 |
| Other Investment Pools and Funds | 80 | 0.66 | $ 66.31 | $ 137,910 |
| Securities, Commodity Contracts, and Other Financial Investments and Related Activities | 5,490 | 0.57 | $ 62.04 | $ 129,040 |
| Federal Executive Branch (OEWS Designation) | 130 | 0.01 | $ 61.65 | $ 128,230 |
| Other Information Services | 7,970 | 2.20 | $ 61.04 | $ 126,950 |
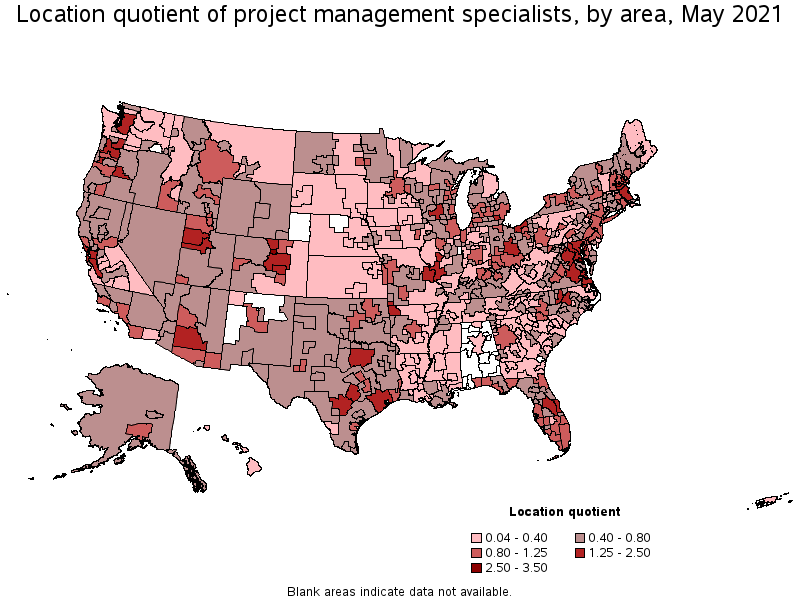
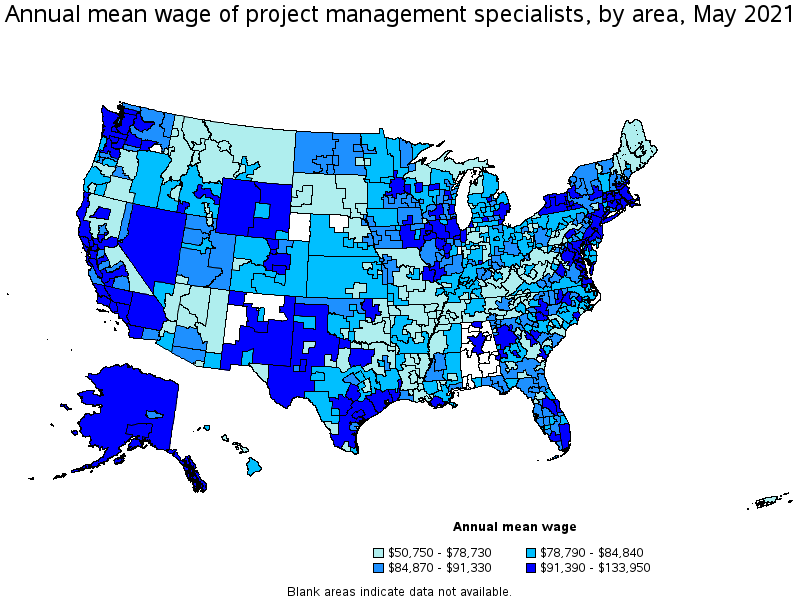
States and areas with the highest published employment, location quotients, and wages for Project Management Specialists are provided. For a list of all areas with employment in Project Management Specialists, see the Create Customized Tables function.
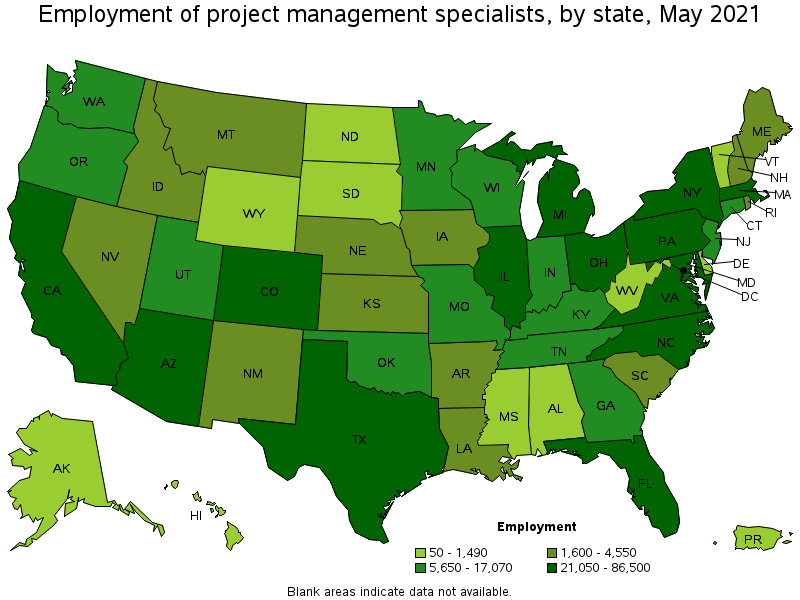
States with the highest employment level in Project Management Specialists:
| State | Employment (1) | Employment per thousand jobs | Location quotient (9) | Hourly mean wage | Annual mean wage (2) |
|---|---|---|---|---|---|
| Texas | 86,500 | 7.08 | 1.34 | $ 46.77 | $ 97,290 |
| California | 83,400 | 5.05 | 0.96 | $ 52.40 | $ 108,990 |
| New York | 57,230 | 6.60 | 1.25 | $ 53.80 | $ 111,890 |
| Florida | 49,340 | 5.73 | 1.09 | $ 44.01 | $ 91,540 |
| Ohio | 31,700 | 6.10 | 1.15 | $ 41.22 | $ 85,740 |
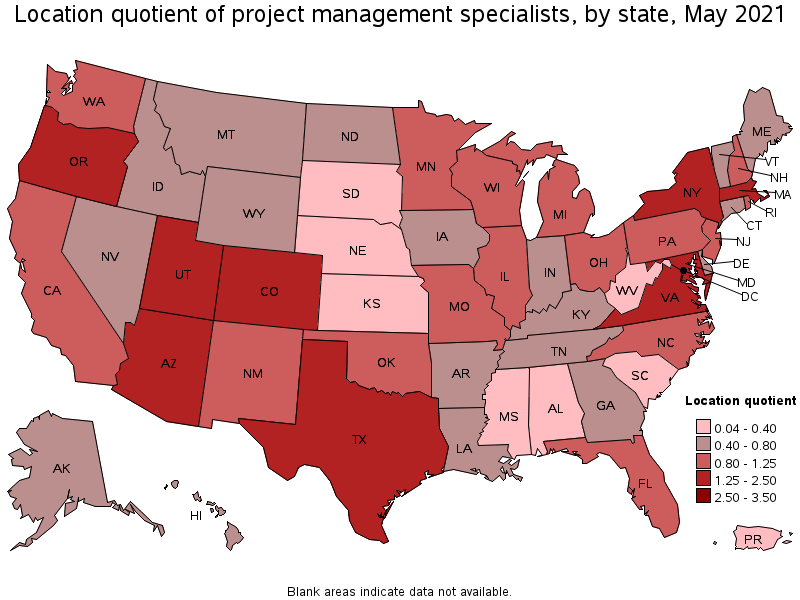
States with the highest concentration of jobs and location quotients in Project Management Specialists:
| State | Employment (1) | Employment per thousand jobs | Location quotient (9) | Hourly mean wage | Annual mean wage (2) |
|---|---|---|---|---|---|
| Maryland | 27,430 | 10.77 | 2.04 | $ 46.97 | $ 97,700 |
| Colorado | 24,710 | 9.43 | 1.79 | $ 47.31 | $ 98,410 |
| District of Columbia | 5,650 | 8.53 | 1.62 | $ 51.74 | $ 107,610 |
| Oregon | 15,300 | 8.38 | 1.59 | $ 43.62 | $ 90,730 |
| Virginia | 28,700 | 7.65 | 1.45 | $ 52.88 | $ 109,980 |
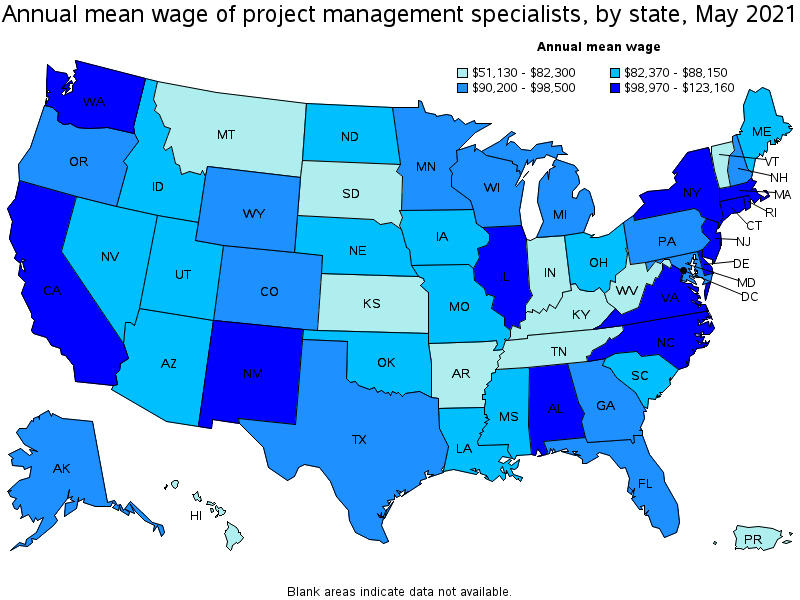
Top paying states for Project Management Specialists:
| State | Employment (1) | Employment per thousand jobs | Location quotient (9) | Hourly mean wage | Annual mean wage (2) |
|---|---|---|---|---|---|
| New Mexico | 3,570 | 4.60 | 0.87 | $ 59.21 | $ 123,160 |
| Washington | 17,070 | 5.32 | 1.01 | $ 58.08 | $ 120,800 |
| New York | 57,230 | 6.60 | 1.25 | $ 53.80 | $ 111,890 |
| New Jersey | 16,600 | 4.31 | 0.82 | $ 53.59 | $ 111,460 |
| Virginia | 28,700 | 7.65 | 1.45 | $ 52.88 | $ 109,980 |
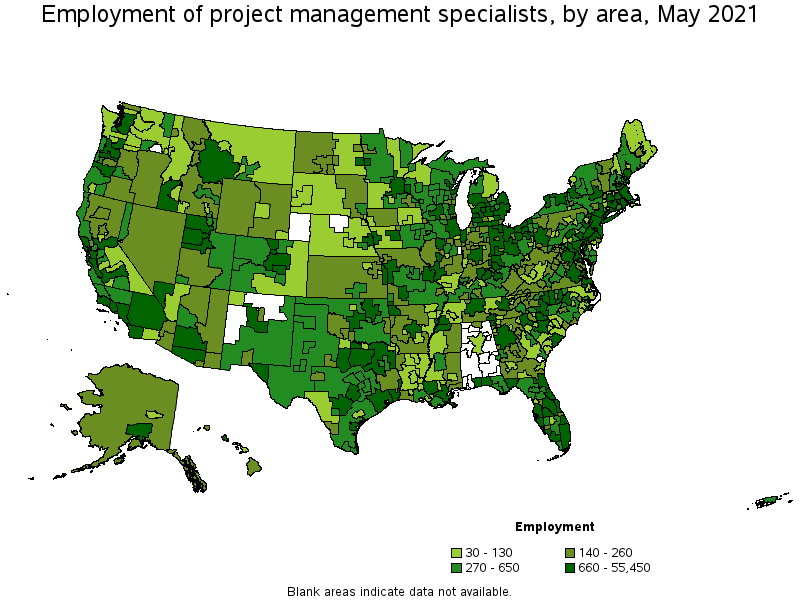
Metropolitan areas with the highest employment level in Project Management Specialists:
| Metropolitan area | Employment (1) | Employment per thousand jobs | Location quotient (9) | Hourly mean wage | Annual mean wage (2) |
|---|---|---|---|---|---|
| New York-Newark-Jersey City, NY-NJ-PA | 55,450 | 6.39 | 1.21 | $ 55.88 | $ 116,230 |
| Washington-Arlington-Alexandria, DC-VA-MD-WV | 29,870 | 10.19 | 1.93 | $ 55.07 | $ 114,540 |
| Los Angeles-Long Beach-Anaheim, CA | 28,480 | 4.98 | 0.94 | $ 48.85 | $ 101,600 |
| Dallas-Fort Worth-Arlington, TX | 27,720 | 7.72 | 1.46 | $ 48.01 | $ 99,860 |
| Houston-The Woodlands-Sugar Land, TX | 24,070 | 8.31 | 1.57 | $ 48.96 | $ 101,830 |
| Chicago-Naperville-Elgin, IL-IN-WI | 21,620 | 5.11 | 0.97 | $ 51.39 | $ 106,880 |
| Boston-Cambridge-Nashua, MA-NH | 20,990 | 8.12 | 1.54 | $ 51.93 | $ 108,010 |
| Phoenix-Mesa-Scottsdale, AZ | 17,340 | 8.19 | 1.55 | $ 42.79 | $ 88,990 |
| San Francisco-Oakland-Hayward, CA | 16,730 | 7.46 | 1.41 | $ 59.82 | $ 124,430 |
| Denver-Aurora-Lakewood, CO | 15,940 | 10.88 | 2.06 | $ 47.63 | $ 99,080 |
Metropolitan areas with the highest concentration of jobs and location quotients in Project Management Specialists:
| Metropolitan area | Employment (1) | Employment per thousand jobs | Location quotient (9) | Hourly mean wage | Annual mean wage (2) |
|---|---|---|---|---|---|
| Boulder, CO | 2,810 | 15.47 | 2.93 | $ 52.95 | $ 110,130 |
| California-Lexington Park, MD | 660 | 14.16 | 2.68 | $ 51.42 | $ 106,950 |
| Baltimore-Columbia-Towson, MD | 14,200 | 11.30 | 2.14 | $ 45.99 | $ 95,670 |
| Austin-Round Rock, TX | 11,920 | 11.11 | 2.10 | $ 48.06 | $ 99,970 |
| Denver-Aurora-Lakewood, CO | 15,940 | 10.88 | 2.06 | $ 47.63 | $ 99,080 |
| Washington-Arlington-Alexandria, DC-VA-MD-WV | 29,870 | 10.19 | 1.93 | $ 55.07 | $ 114,540 |
| Portland-Vancouver-Hillsboro, OR-WA | 11,090 | 9.88 | 1.87 | $ 45.58 | $ 94,800 |
| Salt Lake City, UT | 6,430 | 8.65 | 1.64 | $ 42.57 | $ 88,540 |
| San Jose-Sunnyvale-Santa Clara, CA | 9,080 | 8.50 | 1.61 | $ 64.40 | $ 133,950 |
| Fort Collins, CO | 1,340 | 8.37 | 1.59 | $ 43.98 | $ 91,480 |
Top paying metropolitan areas for Project Management Specialists:
| Metropolitan area | Employment (1) | Employment per thousand jobs | Location quotient (9) | Hourly mean wage | Annual mean wage (2) |
|---|---|---|---|---|---|
| San Jose-Sunnyvale-Santa Clara, CA | 9,080 | 8.50 | 1.61 | $ 64.40 | $ 133,950 |
| Birmingham-Hoover, AL | 90 | 0.19 | 0.04 | $ 62.62 | $ 130,250 |
| Seattle-Tacoma-Bellevue, WA | 14,160 | 7.38 | 1.40 | $ 60.25 | $ 125,330 |
| San Francisco-Oakland-Hayward, CA | 16,730 | 7.46 | 1.41 | $ 59.82 | $ 124,430 |
| New York-Newark-Jersey City, NY-NJ-PA | 55,450 | 6.39 | 1.21 | $ 55.88 | $ 116,230 |
| Washington-Arlington-Alexandria, DC-VA-MD-WV | 29,870 | 10.19 | 1.93 | $ 55.07 | $ 114,540 |
| Boulder, CO | 2,810 | 15.47 | 2.93 | $ 52.95 | $ 110,130 |
| Decatur, IL | 130 | 2.83 | 0.54 | $ 52.50 | $ 109,190 |
| Durham-Chapel Hill, NC | 2,540 | 8.15 | 1.54 | $ 52.49 | $ 109,180 |
| Huntsville, AL | 170 | 0.76 | 0.14 | $ 52.28 | $ 108,730 |
Nonmetropolitan areas with the highest employment in Project Management Specialists:
| Nonmetropolitan area | Employment (1) | Employment per thousand jobs | Location quotient (9) | Hourly mean wage | Annual mean wage (2) |
|---|---|---|---|---|---|
| North Northeastern Ohio nonmetropolitan area (noncontiguous) | 1,010 | 3.21 | 0.61 | $ 39.22 | $ 81,570 |
| Balance of Lower Peninsula of Michigan nonmetropolitan area | 880 | 3.47 | 0.66 | $ 39.60 | $ 82,370 |
| North Texas Region of Texas nonmetropolitan area | 800 | 3.01 | 0.57 | $ 35.82 | $ 74,500 |
| West Northwestern Ohio nonmetropolitan area | 750 | 3.13 | 0.59 | $ 38.31 | $ 79,680 |
| Southwest Montana nonmetropolitan area | 670 | 4.80 | 0.91 | $ 36.63 | $ 76,200 |
Nonmetropolitan areas with the highest concentration of jobs and location quotients in Project Management Specialists:
| Nonmetropolitan area | Employment (1) | Employment per thousand jobs | Location quotient (9) | Hourly mean wage | Annual mean wage (2) |
|---|---|---|---|---|---|
| Maryland nonmetropolitan area | 340 | 5.98 | 1.13 | $ 38.80 | $ 80,710 |
| West Central-Southwest New Hampshire nonmetropolitan area | 540 | 5.58 | 1.06 | $ 41.65 | $ 86,640 |
| Southwest Montana nonmetropolitan area | 670 | 4.80 | 0.91 | $ 36.63 | $ 76,200 |
| Central New Hampshire nonmetropolitan area | 390 | 4.39 | 0.83 | $ 41.83 | $ 87,000 |
| South Florida nonmetropolitan area | 330 | 4.36 | 0.83 | $ 40.91 | $ 85,080 |
Top paying nonmetropolitan areas for Project Management Specialists:
| Nonmetropolitan area | Employment (1) | Employment per thousand jobs | Location quotient (9) | Hourly mean wage | Annual mean wage (2) |
|---|---|---|---|---|---|
| Western Wyoming nonmetropolitan area | 220 | 2.33 | 0.44 | $ 52.64 | $ 109,490 |
| Southwest New York nonmetropolitan area | 580 | 3.47 | 0.66 | $ 51.52 | $ 107,150 |
| Northeast Virginia nonmetropolitan area | 150 | 3.08 | 0.58 | $ 49.66 | $ 103,300 |
| North Coast Region of California nonmetropolitan area | 280 | 2.75 | 0.52 | $ 48.89 | $ 101,680 |
| Western Washington nonmetropolitan area | 90 | 0.72 | 0.14 | $ 47.06 | $ 97,890 |
These estimates are calculated with data collected from employers in all industry sectors, all metropolitan and nonmetropolitan areas, and all states and the District of Columbia. The top employment and wage figures are provided above. The complete list is available in the downloadable XLS files.
The percentile wage estimate is the value of a wage below which a certain percent of workers fall. The median wage is the 50th percentile wage estimate—50 percent of workers earn less than the median and 50 percent of workers earn more than the median. More about percentile wages.
(1) Estimates for detailed occupations do not sum to the totals because the totals include occupations not shown separately. Estimates do not include self-employed workers.
(2) Annual wages have been calculated by multiplying the hourly mean wage by a "year-round, full-time" hours figure of 2,080 hours; for those occupations where there is not an hourly wage published, the annual wage has been directly calculated from the reported survey data.
(3) The relative standard error (RSE) is a measure of the reliability of a survey statistic. The smaller the relative standard error, the more precise the estimate.
(9) The location quotient is the ratio of the area concentration of occupational employment to the national average concentration. A location quotient greater than one indicates the occupation has a higher share of employment than average, and a location quotient less than one indicates the occupation is less prevalent in the area than average.
Other OEWS estimates and related information:
May 2021 National Occupational Employment and Wage Estimates
May 2021 State Occupational Employment and Wage Estimates
May 2021 Metropolitan and Nonmetropolitan Area Occupational Employment and Wage Estimates
May 2021 National Industry-Specific Occupational Employment and Wage Estimates
Last Modified Date: March 31, 2022