
An official website of the United States government
An official website of the United States government
The .gov means it's official.
Federal government websites often end in .gov or .mil. Before sharing sensitive information,
make sure you're on a federal government site.
The site is secure.
The
https:// ensures that you are connecting to the official website and that any
information you provide is encrypted and transmitted securely.
Organize activities to raise funds or otherwise solicit and gather monetary donations or other gifts for an organization. May design and produce promotional materials. May also raise awareness of the organization�s work, goals, and financial needs.
Employment estimate and mean wage estimates for Fundraisers:
| Employment (1) | Employment RSE (3) |
Mean hourly wage |
Mean annual wage (2) |
Wage RSE (3) |
|---|---|---|---|---|
| 82,080 | 1.3 % | $ 31.19 | $ 64,870 | 0.6 % |
Percentile wage estimates for Fundraisers:
| Percentile | 10% | 25% | 50% (Median) |
75% | 90% |
|---|---|---|---|---|---|
| Hourly Wage | $ 17.80 | $ 22.71 | $ 29.17 | $ 37.73 | $ 48.38 |
| Annual Wage (2) | $ 37,020 | $ 47,250 | $ 60,660 | $ 78,470 | $ 100,620 |
Industries with the highest published employment and wages for Fundraisers are provided. For a list of all industries with employment in Fundraisers, see the Create Customized Tables function.
Industries with the highest levels of employment in Fundraisers:
| Industry | Employment (1) | Percent of industry employment | Hourly mean wage | Annual mean wage (2) |
|---|---|---|---|---|
| Colleges, Universities, and Professional Schools | 14,080 | 0.47 | $ 35.12 | $ 73,050 |
| Grantmaking and Giving Services | 12,820 | 9.17 | $ 33.68 | $ 70,060 |
| Social Advocacy Organizations | 6,330 | 2.83 | $ 29.81 | $ 62,000 |
| Individual and Family Services | 5,510 | 0.21 | $ 26.64 | $ 55,400 |
| Elementary and Secondary Schools | 3,390 | 0.04 | $ 30.39 | $ 63,220 |
Industries with the highest concentration of employment in Fundraisers:
| Industry | Employment (1) | Percent of industry employment | Hourly mean wage | Annual mean wage (2) |
|---|---|---|---|---|
| Grantmaking and Giving Services | 12,820 | 9.17 | $ 33.68 | $ 70,060 |
| Social Advocacy Organizations | 6,330 | 2.83 | $ 29.81 | $ 62,000 |
| Performing Arts Companies | 1,380 | 2.00 | $ 27.51 | $ 57,220 |
| Community Food and Housing, and Emergency and Other Relief Services | 3,330 | 1.75 | $ 27.05 | $ 56,260 |
| Museums, Historical Sites, and Similar Institutions | 2,250 | 1.71 | $ 28.90 | $ 60,100 |
Top paying industries for Fundraisers:
| Industry | Employment (1) | Percent of industry employment | Hourly mean wage | Annual mean wage (2) |
|---|---|---|---|---|
| Securities, Commodity Contracts, and Other Financial Investments and Related Activities | 130 | 0.01 | $ 47.77 | $ 99,360 |
| Rail Transportation | 30 | 0.02 | $ 46.16 | $ 96,020 |
| Insurance Carriers | 90 | 0.01 | $ 46.12 | $ 95,920 |
| Motion Picture and Video Industries | 150 | 0.05 | $ 41.42 | $ 86,140 |
| Psychiatric and Substance Abuse Hospitals | 40 | 0.02 | $ 39.74 | $ 82,660 |
States and areas with the highest published employment, location quotients, and wages for Fundraisers are provided. For a list of all areas with employment in Fundraisers, see the Create Customized Tables function.
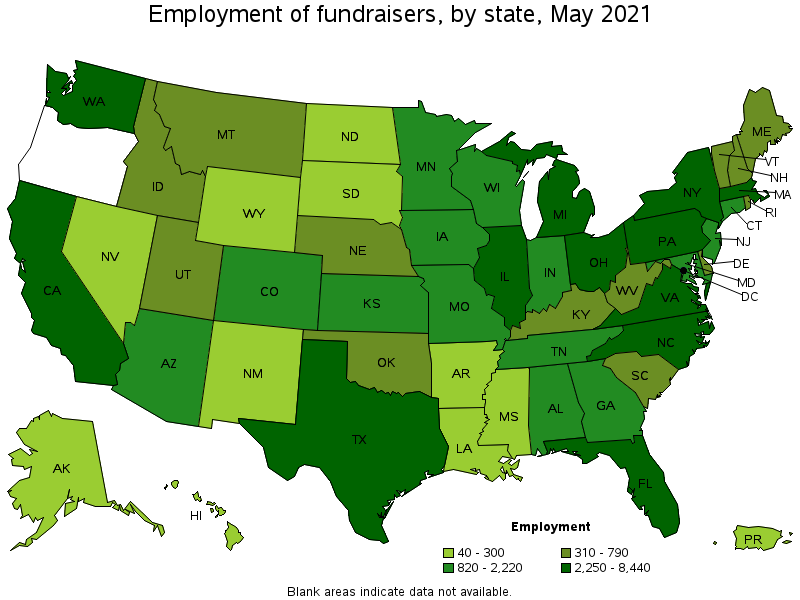
States with the highest employment level in Fundraisers:
| State | Employment (1) | Employment per thousand jobs | Location quotient (9) | Hourly mean wage | Annual mean wage (2) |
|---|---|---|---|---|---|
| New York | 8,440 | 0.97 | 1.67 | $ 37.46 | $ 77,920 |
| California | 6,790 | 0.41 | 0.70 | $ 35.96 | $ 74,800 |
| Massachusetts | 4,400 | 1.30 | 2.22 | $ 36.16 | $ 75,200 |
| Pennsylvania | 4,190 | 0.75 | 1.29 | $ 30.06 | $ 62,520 |
| Texas | 4,180 | 0.34 | 0.59 | $ 28.48 | $ 59,240 |
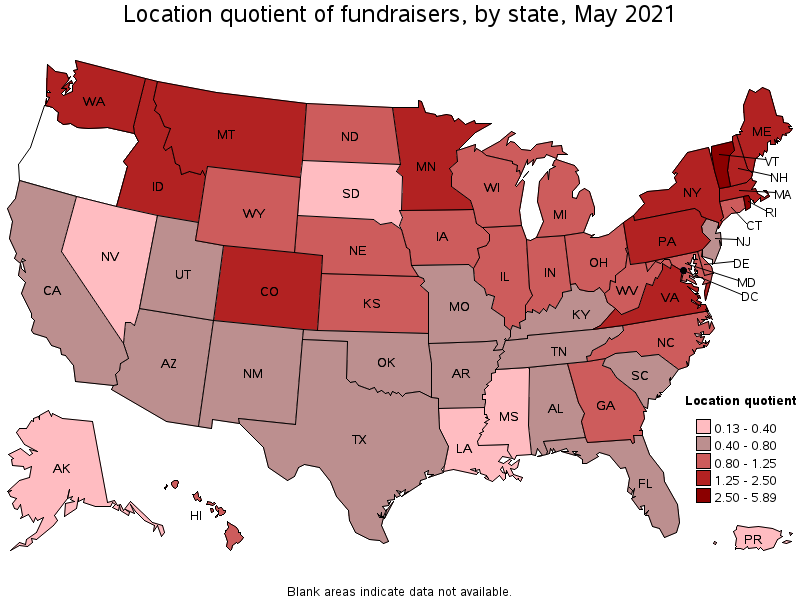
States with the highest concentration of jobs and location quotients in Fundraisers:
| State | Employment (1) | Employment per thousand jobs | Location quotient (9) | Hourly mean wage | Annual mean wage (2) |
|---|---|---|---|---|---|
| District of Columbia | 2,270 | 3.43 | 5.89 | $ 36.31 | $ 75,520 |
| Rhode Island | 790 | 1.72 | 2.96 | $ 35.07 | $ 72,940 |
| Vermont | 480 | 1.71 | 2.93 | $ 29.62 | $ 61,610 |
| Massachusetts | 4,400 | 1.30 | 2.22 | $ 36.16 | $ 75,200 |
| Montana | 580 | 1.24 | 2.12 | $ 27.11 | $ 56,380 |
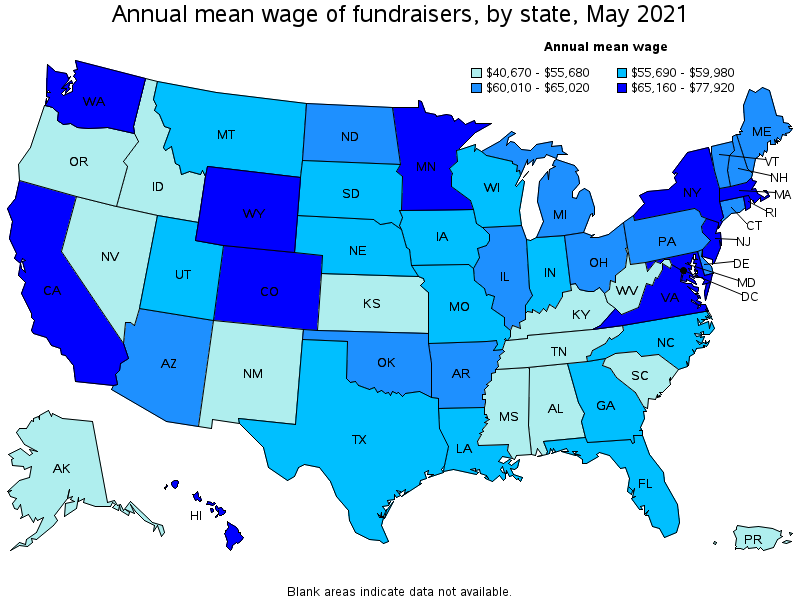
Top paying states for Fundraisers:
| State | Employment (1) | Employment per thousand jobs | Location quotient (9) | Hourly mean wage | Annual mean wage (2) |
|---|---|---|---|---|---|
| New York | 8,440 | 0.97 | 1.67 | $ 37.46 | $ 77,920 |
| District of Columbia | 2,270 | 3.43 | 5.89 | $ 36.31 | $ 75,520 |
| Massachusetts | 4,400 | 1.30 | 2.22 | $ 36.16 | $ 75,200 |
| California | 6,790 | 0.41 | 0.70 | $ 35.96 | $ 74,800 |
| Rhode Island | 790 | 1.72 | 2.96 | $ 35.07 | $ 72,940 |
Metropolitan areas with the highest employment level in Fundraisers:
| Metropolitan area | Employment (1) | Employment per thousand jobs | Location quotient (9) | Hourly mean wage | Annual mean wage (2) |
|---|---|---|---|---|---|
| New York-Newark-Jersey City, NY-NJ-PA | 6,860 | 0.79 | 1.36 | $ 38.61 | $ 80,320 |
| Washington-Arlington-Alexandria, DC-VA-MD-WV | 3,840 | 1.31 | 2.25 | $ 35.77 | $ 74,410 |
| Boston-Cambridge-Nashua, MA-NH | 3,630 | 1.40 | 2.41 | $ 36.78 | $ 76,510 |
| Chicago-Naperville-Elgin, IL-IN-WI | 2,680 | 0.63 | 1.08 | $ 29.89 | $ 62,170 |
| Los Angeles-Long Beach-Anaheim, CA | 2,390 | 0.42 | 0.72 | $ 33.45 | $ 69,570 |
| Philadelphia-Camden-Wilmington, PA-NJ-DE-MD | 2,190 | 0.83 | 1.42 | $ 31.76 | $ 66,060 |
| Seattle-Tacoma-Bellevue, WA | 1,960 | 1.02 | 1.76 | $ 33.90 | $ 70,510 |
| Minneapolis-St. Paul-Bloomington, MN-WI | 1,670 | 0.92 | 1.58 | $ 33.34 | $ 69,340 |
| San Francisco-Oakland-Hayward, CA | 1,570 | 0.70 | 1.20 | $ 41.38 | $ 86,070 |
| Atlanta-Sandy Springs-Roswell, GA | 1,450 | 0.56 | 0.96 | $ 27.96 | $ 58,160 |
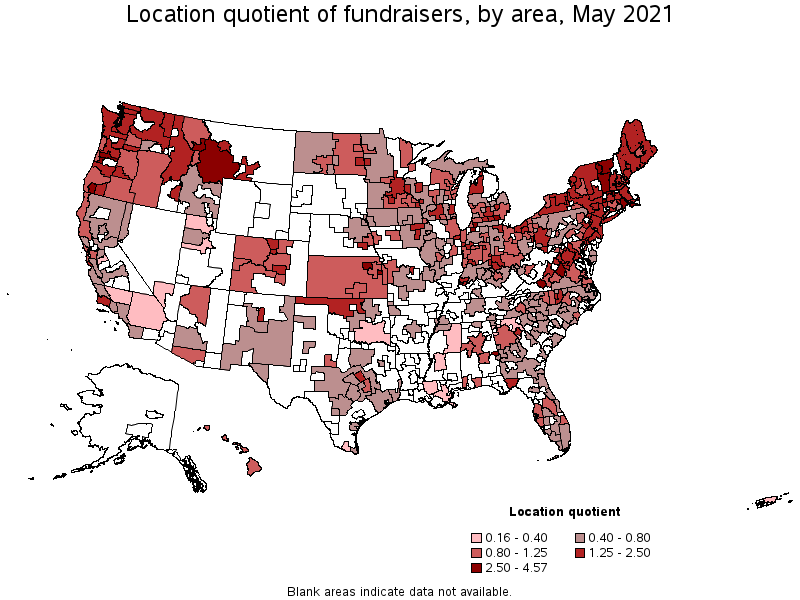
Metropolitan areas with the highest concentration of jobs and location quotients in Fundraisers:
| Metropolitan area | Employment (1) | Employment per thousand jobs | Location quotient (9) | Hourly mean wage | Annual mean wage (2) |
|---|---|---|---|---|---|
| Corvallis, OR | 90 | 2.67 | 4.57 | $ 24.22 | $ 50,370 |
| Charlottesville, VA | 250 | 2.35 | 4.04 | $ 35.86 | $ 74,590 |
| Ann Arbor, MI | 440 | 2.18 | 3.74 | $ 32.66 | $ 67,940 |
| Grants Pass, OR | 60 | 2.17 | 3.72 | $ 23.20 | $ 48,250 |
| Auburn-Opelika, AL | 120 | 1.96 | 3.37 | $ 29.16 | $ 60,640 |
| Manhattan, KS | 70 | 1.85 | 3.18 | $ 30.68 | $ 63,810 |
| Burlington-South Burlington, VT | 210 | 1.80 | 3.09 | $ 30.67 | $ 63,800 |
| Missoula, MT | 110 | 1.77 | 3.04 | $ 26.77 | $ 55,670 |
| Salem, OR | 300 | 1.75 | 3.00 | $ 21.81 | $ 45,350 |
| South Bend-Mishawaka, IN-MI | 200 | 1.64 | 2.82 | $ 35.46 | $ 73,750 |
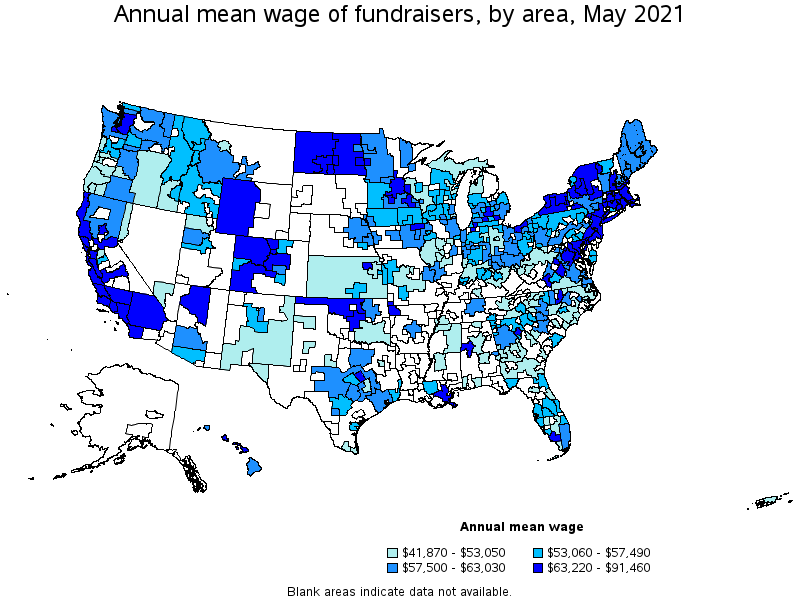
Top paying metropolitan areas for Fundraisers:
| Metropolitan area | Employment (1) | Employment per thousand jobs | Location quotient (9) | Hourly mean wage | Annual mean wage (2) |
|---|---|---|---|---|---|
| San Jose-Sunnyvale-Santa Clara, CA | 310 | 0.29 | 0.49 | $ 43.97 | $ 91,460 |
| San Francisco-Oakland-Hayward, CA | 1,570 | 0.70 | 1.20 | $ 41.38 | $ 86,070 |
| Salinas, CA | 80 | 0.45 | 0.77 | $ 40.27 | $ 83,760 |
| New York-Newark-Jersey City, NY-NJ-PA | 6,860 | 0.79 | 1.36 | $ 38.61 | $ 80,320 |
| Santa Cruz-Watsonville, CA | 90 | 0.93 | 1.59 | $ 38.14 | $ 79,330 |
| Chico, CA | 30 | 0.42 | 0.72 | $ 38.06 | $ 79,160 |
| Boston-Cambridge-Nashua, MA-NH | 3,630 | 1.40 | 2.41 | $ 36.78 | $ 76,510 |
| Sacramento--Roseville--Arden-Arcade, CA | 450 | 0.45 | 0.78 | $ 35.89 | $ 74,660 |
| Charlottesville, VA | 250 | 2.35 | 4.04 | $ 35.86 | $ 74,590 |
| Washington-Arlington-Alexandria, DC-VA-MD-WV | 3,840 | 1.31 | 2.25 | $ 35.77 | $ 74,410 |
Nonmetropolitan areas with the highest employment in Fundraisers:
| Nonmetropolitan area | Employment (1) | Employment per thousand jobs | Location quotient (9) | Hourly mean wage | Annual mean wage (2) |
|---|---|---|---|---|---|
| Southwest Montana nonmetropolitan area | 290 | 2.07 | 3.56 | $ 27.76 | $ 57,740 |
| Southwest Maine nonmetropolitan area | 190 | 1.04 | 1.79 | $ 29.68 | $ 61,740 |
| Kansas nonmetropolitan area | 180 | 0.49 | 0.83 | $ 25.06 | $ 52,120 |
| North Northeastern Ohio nonmetropolitan area (noncontiguous) | 170 | 0.54 | 0.93 | $ 29.64 | $ 61,660 |
| Southern Vermont nonmetropolitan area | 170 | 1.74 | 2.99 | $ 30.07 | $ 62,540 |
Nonmetropolitan areas with the highest concentration of jobs and location quotients in Fundraisers:
| Nonmetropolitan area | Employment (1) | Employment per thousand jobs | Location quotient (9) | Hourly mean wage | Annual mean wage (2) |
|---|---|---|---|---|---|
| Massachusetts nonmetropolitan area | 130 | 2.21 | 3.79 | $ 34.36 | $ 71,470 |
| Southwest Montana nonmetropolitan area | 290 | 2.07 | 3.56 | $ 27.76 | $ 57,740 |
| Southern Vermont nonmetropolitan area | 170 | 1.74 | 2.99 | $ 30.07 | $ 62,540 |
| Northern Vermont nonmetropolitan area | 110 | 1.61 | 2.77 | $ 27.26 | $ 56,690 |
| West Central-Southwest New Hampshire nonmetropolitan area | 140 | 1.41 | 2.41 | $ 32.21 | $ 67,000 |
Top paying nonmetropolitan areas for Fundraisers:
| Nonmetropolitan area | Employment (1) | Employment per thousand jobs | Location quotient (9) | Hourly mean wage | Annual mean wage (2) |
|---|---|---|---|---|---|
| North Coast Region of California nonmetropolitan area | 60 | 0.63 | 1.08 | $ 37.99 | $ 79,010 |
| Western Wyoming nonmetropolitan area | (8) | (8) | (8) | $ 36.82 | $ 76,590 |
| Massachusetts nonmetropolitan area | 130 | 2.21 | 3.79 | $ 34.36 | $ 71,470 |
| Northwest Colorado nonmetropolitan area | 80 | 0.65 | 1.11 | $ 32.83 | $ 68,280 |
| Connecticut nonmetropolitan area | 40 | 1.36 | 2.33 | $ 32.81 | $ 68,240 |
These estimates are calculated with data collected from employers in all industry sectors, all metropolitan and nonmetropolitan areas, and all states and the District of Columbia. The top employment and wage figures are provided above. The complete list is available in the downloadable XLS files.
The percentile wage estimate is the value of a wage below which a certain percent of workers fall. The median wage is the 50th percentile wage estimate—50 percent of workers earn less than the median and 50 percent of workers earn more than the median. More about percentile wages.
(1) Estimates for detailed occupations do not sum to the totals because the totals include occupations not shown separately. Estimates do not include self-employed workers.
(2) Annual wages have been calculated by multiplying the hourly mean wage by a "year-round, full-time" hours figure of 2,080 hours; for those occupations where there is not an hourly wage published, the annual wage has been directly calculated from the reported survey data.
(3) The relative standard error (RSE) is a measure of the reliability of a survey statistic. The smaller the relative standard error, the more precise the estimate.
(8) Estimate not released.
(9) The location quotient is the ratio of the area concentration of occupational employment to the national average concentration. A location quotient greater than one indicates the occupation has a higher share of employment than average, and a location quotient less than one indicates the occupation is less prevalent in the area than average.
Other OEWS estimates and related information:
May 2021 National Occupational Employment and Wage Estimates
May 2021 State Occupational Employment and Wage Estimates
May 2021 Metropolitan and Nonmetropolitan Area Occupational Employment and Wage Estimates
May 2021 National Industry-Specific Occupational Employment and Wage Estimates
Last Modified Date: March 31, 2022