
An official website of the United States government
An official website of the United States government
The .gov means it's official.
Federal government websites often end in .gov or .mil. Before sharing sensitive information,
make sure you're on a federal government site.
The site is secure.
The
https:// ensures that you are connecting to the official website and that any
information you provide is encrypted and transmitted securely.
Design or conduct work-related training and development programs to improve individual skills or organizational performance. May analyze organizational training needs or evaluate training effectiveness. Excludes �Career/Technical Education Teachers, Postsecondary� (25-1194) and �Other Teachers and Instructors� (25-3000). Flight instructors are included with �Aircraft Pilots and Flight Engineers� (53-2010).
Employment estimate and mean wage estimates for Training and Development Specialists:
| Employment (1) | Employment RSE (3) |
Mean hourly wage |
Mean annual wage (2) |
Wage RSE (3) |
|---|---|---|---|---|
| 336,030 | 1.0 % | $ 32.51 | $ 67,620 | 0.6 % |
Percentile wage estimates for Training and Development Specialists:
| Percentile | 10% | 25% | 50% (Median) |
75% | 90% |
|---|---|---|---|---|---|
| Hourly Wage | $ 15.07 | $ 22.62 | $ 29.60 | $ 38.71 | $ 49.64 |
| Annual Wage (2) | $ 31,340 | $ 47,040 | $ 61,570 | $ 80,510 | $ 103,240 |
Industries with the highest published employment and wages for Training and Development Specialists are provided. For a list of all industries with employment in Training and Development Specialists, see the Create Customized Tables function.
Industries with the highest levels of employment in Training and Development Specialists:
| Industry | Employment (1) | Percent of industry employment | Hourly mean wage | Annual mean wage (2) |
|---|---|---|---|---|
| Management of Companies and Enterprises | 21,870 | 0.86 | $ 36.95 | $ 76,850 |
| Restaurants and Other Eating Places | 17,600 | 0.19 | $ 14.48 | $ 30,120 |
| Computer Systems Design and Related Services | 15,790 | 0.70 | $ 41.08 | $ 85,440 |
| Local Government, excluding schools and hospitals (OEWS Designation) | 12,200 | 0.23 | $ 31.98 | $ 66,510 |
| Management, Scientific, and Technical Consulting Services | 11,980 | 0.77 | $ 37.58 | $ 78,170 |
Industries with the highest concentration of employment in Training and Development Specialists:
| Industry | Employment (1) | Percent of industry employment | Hourly mean wage | Annual mean wage (2) |
|---|---|---|---|---|
| Business Schools and Computer and Management Training | 10,650 | 14.90 | $ 36.13 | $ 75,140 |
| Lessors of Nonfinancial Intangible Assets (except Copyrighted Works) | 660 | 3.42 | $ 33.29 | $ 69,230 |
| Technical and Trade Schools | 4,340 | 3.32 | $ 39.91 | $ 83,010 |
| Vocational Rehabilitation Services | 4,870 | 1.82 | $ 21.64 | $ 45,010 |
| Educational Support Services | 3,060 | 1.57 | $ 39.82 | $ 82,820 |
Top paying industries for Training and Development Specialists:
| Industry | Employment (1) | Percent of industry employment | Hourly mean wage | Annual mean wage (2) |
|---|---|---|---|---|
| Pipeline Transportation of Crude Oil | 50 | 0.42 | $ 59.82 | $ 124,420 |
| Federal Executive Branch (OEWS Designation) | 400 | 0.02 | $ 55.48 | $ 115,410 |
| Electric Power Generation, Transmission and Distribution | 2,290 | 0.61 | $ 54.05 | $ 112,410 |
| Petroleum and Coal Products Manufacturing | 410 | 0.39 | $ 53.77 | $ 111,840 |
| Land Subdivision | 60 | 0.17 | $ 51.09 | $ 106,260 |
States and areas with the highest published employment, location quotients, and wages for Training and Development Specialists are provided. For a list of all areas with employment in Training and Development Specialists, see the Create Customized Tables function.
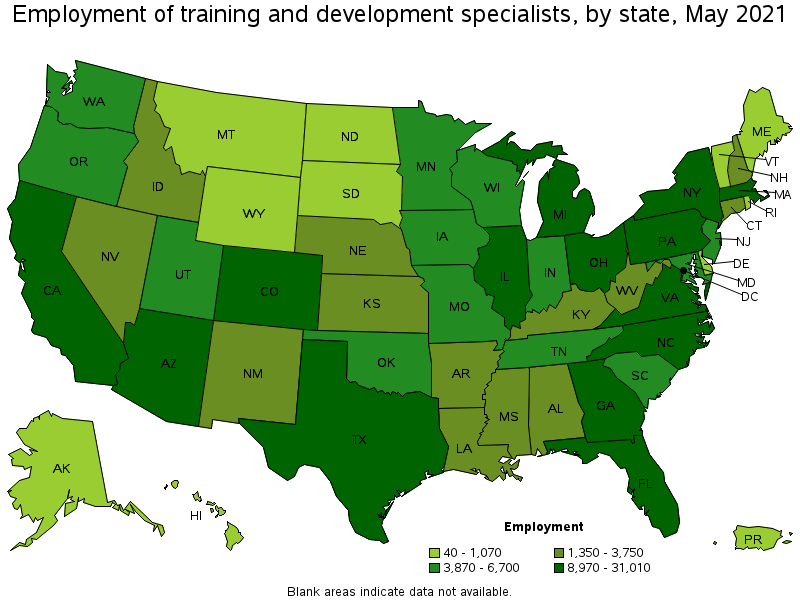
States with the highest employment level in Training and Development Specialists:
| State | Employment (1) | Employment per thousand jobs | Location quotient (9) | Hourly mean wage | Annual mean wage (2) |
|---|---|---|---|---|---|
| Texas | 31,010 | 2.54 | 1.06 | $ 31.62 | $ 65,770 |
| California | 30,320 | 1.83 | 0.77 | $ 37.26 | $ 77,510 |
| New York | 22,560 | 2.60 | 1.09 | $ 36.25 | $ 75,390 |
| Florida | 22,280 | 2.59 | 1.09 | $ 29.87 | $ 62,130 |
| Ohio | 14,970 | 2.88 | 1.21 | $ 27.71 | $ 57,640 |
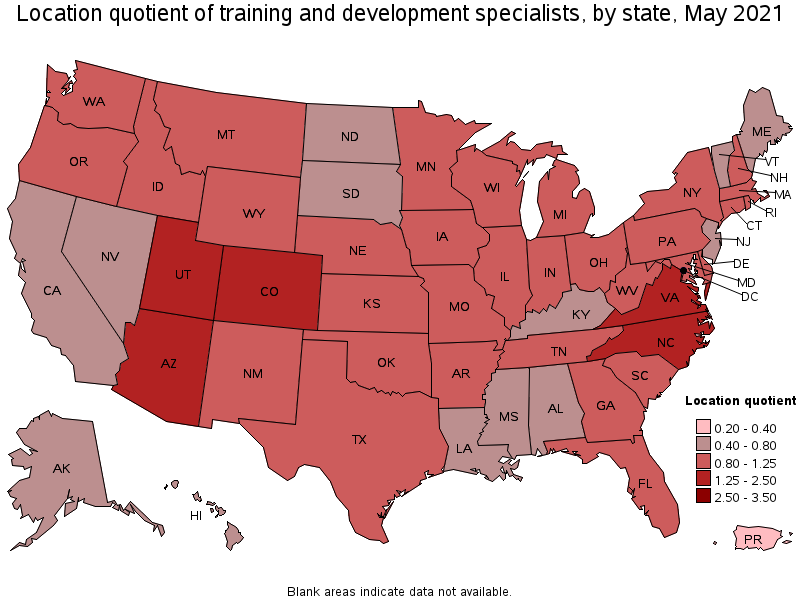
States with the highest concentration of jobs and location quotients in Training and Development Specialists:
| State | Employment (1) | Employment per thousand jobs | Location quotient (9) | Hourly mean wage | Annual mean wage (2) |
|---|---|---|---|---|---|
| Arizona | 10,940 | 3.80 | 1.59 | $ 32.28 | $ 67,140 |
| Virginia | 13,390 | 3.57 | 1.50 | $ 33.63 | $ 69,950 |
| Colorado | 9,320 | 3.56 | 1.49 | $ 33.89 | $ 70,480 |
| Utah | 5,310 | 3.41 | 1.43 | $ 30.07 | $ 62,550 |
| North Carolina | 14,250 | 3.22 | 1.35 | $ 29.78 | $ 61,940 |
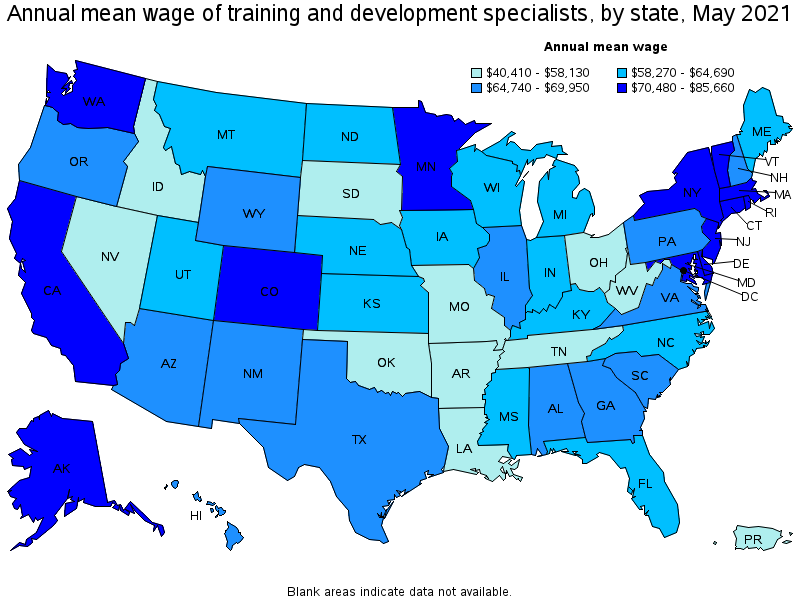
Top paying states for Training and Development Specialists:
| State | Employment (1) | Employment per thousand jobs | Location quotient (9) | Hourly mean wage | Annual mean wage (2) |
|---|---|---|---|---|---|
| New Jersey | 6,590 | 1.71 | 0.72 | $ 41.18 | $ 85,660 |
| District of Columbia | 1,350 | 2.04 | 0.86 | $ 40.57 | $ 84,380 |
| Rhode Island | 1,070 | 2.33 | 0.98 | $ 40.55 | $ 84,340 |
| Washington | 6,280 | 1.96 | 0.82 | $ 39.02 | $ 81,170 |
| Vermont | 450 | 1.59 | 0.67 | $ 37.60 | $ 78,210 |
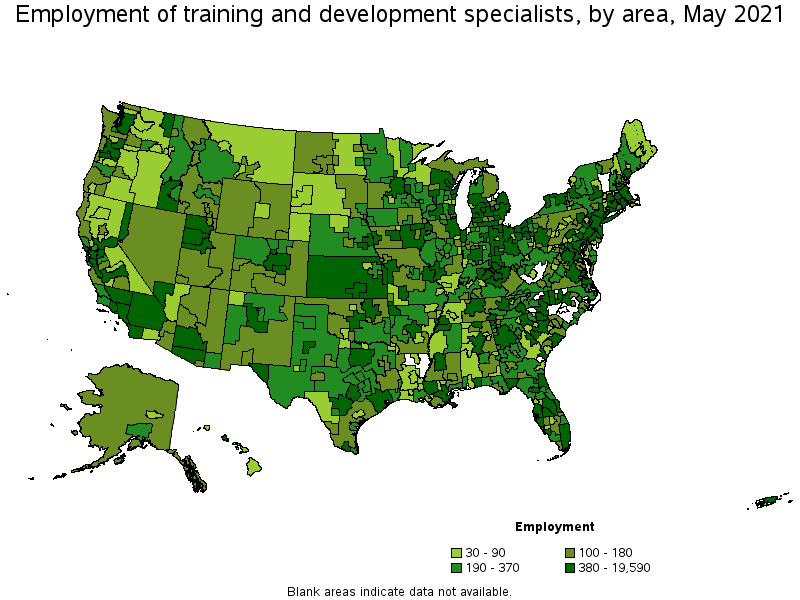
Metropolitan areas with the highest employment level in Training and Development Specialists:
| Metropolitan area | Employment (1) | Employment per thousand jobs | Location quotient (9) | Hourly mean wage | Annual mean wage (2) |
|---|---|---|---|---|---|
| New York-Newark-Jersey City, NY-NJ-PA | 19,590 | 2.26 | 0.95 | $ 39.48 | $ 82,110 |
| Los Angeles-Long Beach-Anaheim, CA | 10,210 | 1.79 | 0.75 | $ 36.06 | $ 75,000 |
| Dallas-Fort Worth-Arlington, TX | 9,900 | 2.76 | 1.16 | $ 32.91 | $ 68,450 |
| Washington-Arlington-Alexandria, DC-VA-MD-WV | 9,500 | 3.24 | 1.36 | $ 37.70 | $ 78,410 |
| Chicago-Naperville-Elgin, IL-IN-WI | 9,100 | 2.15 | 0.90 | $ 33.84 | $ 70,380 |
| Phoenix-Mesa-Scottsdale, AZ | 8,570 | 4.05 | 1.70 | $ 32.35 | $ 67,280 |
| Atlanta-Sandy Springs-Roswell, GA | 7,640 | 2.95 | 1.24 | $ 34.36 | $ 71,470 |
| Houston-The Woodlands-Sugar Land, TX | 7,510 | 2.59 | 1.09 | $ 34.20 | $ 71,140 |
| Boston-Cambridge-Nashua, MA-NH | 7,120 | 2.75 | 1.15 | $ 37.88 | $ 78,780 |
| Denver-Aurora-Lakewood, CO | 5,910 | 4.03 | 1.69 | $ 34.53 | $ 71,820 |
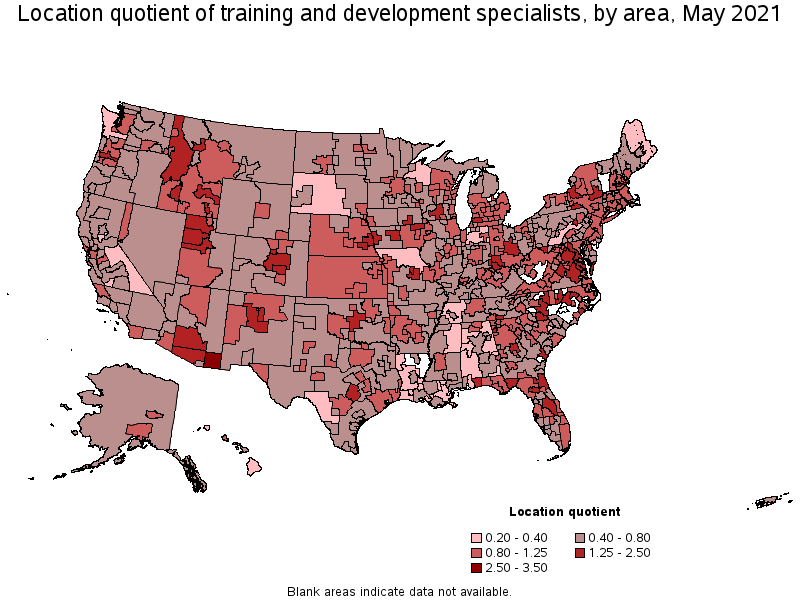
Metropolitan areas with the highest concentration of jobs and location quotients in Training and Development Specialists:
| Metropolitan area | Employment (1) | Employment per thousand jobs | Location quotient (9) | Hourly mean wage | Annual mean wage (2) |
|---|---|---|---|---|---|
| Sierra Vista-Douglas, AZ | 220 | 6.49 | 2.72 | $ 38.21 | $ 79,470 |
| Santa Fe, NM | 280 | 4.94 | 2.07 | $ 27.24 | $ 56,660 |
| Colorado Springs, CO | 1,390 | 4.83 | 2.02 | $ 34.27 | $ 71,270 |
| Salem, OR | 810 | 4.80 | 2.01 | $ 33.51 | $ 69,700 |
| Idaho Falls, ID | 330 | 4.58 | 1.92 | $ 34.47 | $ 71,690 |
| Jacksonville, NC | 220 | 4.47 | 1.88 | $ 22.23 | $ 46,250 |
| Durham-Chapel Hill, NC | 1,370 | 4.39 | 1.84 | $ 33.07 | $ 68,780 |
| Richmond, VA | 2,540 | 4.11 | 1.72 | $ 30.77 | $ 64,000 |
| Phoenix-Mesa-Scottsdale, AZ | 8,570 | 4.05 | 1.70 | $ 32.35 | $ 67,280 |
| Denver-Aurora-Lakewood, CO | 5,910 | 4.03 | 1.69 | $ 34.53 | $ 71,820 |
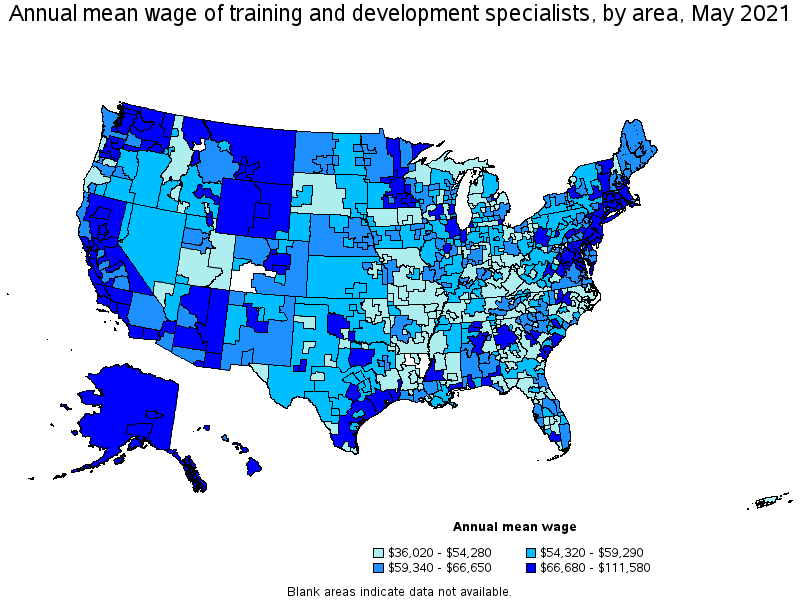
Top paying metropolitan areas for Training and Development Specialists:
| Metropolitan area | Employment (1) | Employment per thousand jobs | Location quotient (9) | Hourly mean wage | Annual mean wage (2) |
|---|---|---|---|---|---|
| Dothan, AL | 50 | 0.83 | 0.35 | $ 53.64 | $ 111,580 |
| San Jose-Sunnyvale-Santa Clara, CA | 1,960 | 1.84 | 0.77 | $ 45.54 | $ 94,720 |
| Decatur, AL | 110 | 1.91 | 0.80 | $ 45.50 | $ 94,650 |
| San Francisco-Oakland-Hayward, CA | 4,880 | 2.18 | 0.91 | $ 43.33 | $ 90,120 |
| Trenton, NJ | 450 | 1.99 | 0.83 | $ 41.65 | $ 86,620 |
| Norwich-New London-Westerly, CT-RI | 260 | 2.28 | 0.95 | $ 41.05 | $ 85,390 |
| Kennewick-Richland, WA | 300 | 2.55 | 1.07 | $ 40.99 | $ 85,260 |
| Seattle-Tacoma-Bellevue, WA | 4,280 | 2.23 | 0.94 | $ 40.84 | $ 84,950 |
| Bridgeport-Stamford-Norwalk, CT | 930 | 2.49 | 1.04 | $ 40.21 | $ 83,630 |
| Longview, WA | 40 | 1.10 | 0.46 | $ 39.51 | $ 82,170 |
Nonmetropolitan areas with the highest employment in Training and Development Specialists:
| Nonmetropolitan area | Employment (1) | Employment per thousand jobs | Location quotient (9) | Hourly mean wage | Annual mean wage (2) |
|---|---|---|---|---|---|
| Kansas nonmetropolitan area | 730 | 1.94 | 0.81 | $ 27.83 | $ 57,880 |
| Balance of Lower Peninsula of Michigan nonmetropolitan area | 560 | 2.22 | 0.93 | $ 23.48 | $ 48,850 |
| North Northeastern Ohio nonmetropolitan area (noncontiguous) | 530 | 1.69 | 0.71 | $ 26.05 | $ 54,180 |
| Southeast Iowa nonmetropolitan area | 520 | 2.49 | 1.05 | $ 26.42 | $ 54,960 |
| West Northwestern Ohio nonmetropolitan area | 480 | 2.02 | 0.85 | $ 26.67 | $ 55,470 |
Nonmetropolitan areas with the highest concentration of jobs and location quotients in Training and Development Specialists:
| Nonmetropolitan area | Employment (1) | Employment per thousand jobs | Location quotient (9) | Hourly mean wage | Annual mean wage (2) |
|---|---|---|---|---|---|
| Northeast Virginia nonmetropolitan area | 170 | 3.51 | 1.47 | $ 33.85 | $ 70,400 |
| Northwestern Idaho nonmetropolitan area | 230 | 3.30 | 1.38 | $ 25.38 | $ 52,790 |
| Southwest Montana nonmetropolitan area | 370 | 2.69 | 1.13 | $ 31.85 | $ 66,250 |
| Capital/Northern New York nonmetropolitan area | 350 | 2.58 | 1.08 | $ 27.42 | $ 57,030 |
| West Arkansas nonmetropolitan area | 220 | 2.58 | 1.08 | $ 30.39 | $ 63,200 |
Top paying nonmetropolitan areas for Training and Development Specialists:
| Nonmetropolitan area | Employment (1) | Employment per thousand jobs | Location quotient (9) | Hourly mean wage | Annual mean wage (2) |
|---|---|---|---|---|---|
| Southwest Oklahoma nonmetropolitan area | 120 | 2.10 | 0.88 | $ 49.02 | $ 101,960 |
| Hawaii / Kauai nonmetropolitan area | 60 | 0.69 | 0.29 | $ 41.25 | $ 85,790 |
| Northeast Minnesota nonmetropolitan area | 40 | 1.07 | 0.45 | $ 37.96 | $ 78,960 |
| Coastal Plains Region of Texas nonmetropolitan area | 170 | 1.17 | 0.49 | $ 37.74 | $ 78,490 |
| Southern Vermont nonmetropolitan area | (8) | (8) | (8) | $ 37.16 | $ 77,300 |
These estimates are calculated with data collected from employers in all industry sectors, all metropolitan and nonmetropolitan areas, and all states and the District of Columbia. The top employment and wage figures are provided above. The complete list is available in the downloadable XLS files.
The percentile wage estimate is the value of a wage below which a certain percent of workers fall. The median wage is the 50th percentile wage estimate—50 percent of workers earn less than the median and 50 percent of workers earn more than the median. More about percentile wages.
(1) Estimates for detailed occupations do not sum to the totals because the totals include occupations not shown separately. Estimates do not include self-employed workers.
(2) Annual wages have been calculated by multiplying the hourly mean wage by a "year-round, full-time" hours figure of 2,080 hours; for those occupations where there is not an hourly wage published, the annual wage has been directly calculated from the reported survey data.
(3) The relative standard error (RSE) is a measure of the reliability of a survey statistic. The smaller the relative standard error, the more precise the estimate.
(8) Estimate not released.
(9) The location quotient is the ratio of the area concentration of occupational employment to the national average concentration. A location quotient greater than one indicates the occupation has a higher share of employment than average, and a location quotient less than one indicates the occupation is less prevalent in the area than average.
Other OEWS estimates and related information:
May 2021 National Occupational Employment and Wage Estimates
May 2021 State Occupational Employment and Wage Estimates
May 2021 Metropolitan and Nonmetropolitan Area Occupational Employment and Wage Estimates
May 2021 National Industry-Specific Occupational Employment and Wage Estimates
Last Modified Date: March 31, 2022