
An official website of the United States government
An official website of the United States government
The .gov means it's official.
Federal government websites often end in .gov or .mil. Before sharing sensitive information,
make sure you're on a federal government site.
The site is secure.
The
https:// ensures that you are connecting to the official website and that any
information you provide is encrypted and transmitted securely.
All business operations specialists not listed separately.
Employment estimate and mean wage estimates for Business Operations Specialists, All Other:
| Employment (1) | Employment RSE (3) |
Mean hourly wage |
Mean annual wage (2) |
Wage RSE (3) |
|---|---|---|---|---|
| 1,030,330 | 0.6 % | $ 38.10 | $ 79,240 | 0.4 % |
Percentile wage estimates for Business Operations Specialists, All Other:
| Percentile | 10% | 25% | 50% (Median) |
75% | 90% |
|---|---|---|---|---|---|
| Hourly Wage | $ 18.29 | $ 23.86 | $ 35.90 | $ 47.35 | $ 61.55 |
| Annual Wage (2) | $ 38,050 | $ 49,630 | $ 74,670 | $ 98,490 | $ 128,030 |
Industries with the highest published employment and wages for Business Operations Specialists, All Other are provided. For a list of all industries with employment in Business Operations Specialists, All Other, see the Create Customized Tables function.
Industries with the highest levels of employment in Business Operations Specialists, All Other:
| Industry | Employment (1) | Percent of industry employment | Hourly mean wage | Annual mean wage (2) |
|---|---|---|---|---|
| Federal Executive Branch (OEWS Designation) | 185,460 | 8.80 | $ 44.75 | $ 93,070 |
| Management of Companies and Enterprises | 59,420 | 2.34 | $ 41.02 | $ 85,310 |
| Management, Scientific, and Technical Consulting Services | 55,360 | 3.56 | $ 38.80 | $ 80,700 |
| Colleges, Universities, and Professional Schools | 54,680 | 1.83 | $ 30.40 | $ 63,220 |
| State Government, excluding schools and hospitals (OEWS Designation) | 47,390 | 2.16 | $ 36.41 | $ 75,740 |
Industries with the highest concentration of employment in Business Operations Specialists, All Other:
| Industry | Employment (1) | Percent of industry employment | Hourly mean wage | Annual mean wage (2) |
|---|---|---|---|---|
| Federal Executive Branch (OEWS Designation) | 185,460 | 8.80 | $ 44.75 | $ 93,070 |
| Grantmaking and Giving Services | 10,550 | 7.55 | $ 38.80 | $ 80,700 |
| Social Advocacy Organizations | 9,590 | 4.29 | $ 31.05 | $ 64,580 |
| Lessors of Nonfinancial Intangible Assets (except Copyrighted Works) | 830 | 4.27 | $ 39.03 | $ 81,180 |
| Business, Professional, Labor, Political, and Similar Organizations | 17,440 | 4.25 | $ 34.46 | $ 71,690 |
Top paying industries for Business Operations Specialists, All Other:
| Industry | Employment (1) | Percent of industry employment | Hourly mean wage | Annual mean wage (2) |
|---|---|---|---|---|
| Computer and Peripheral Equipment Manufacturing | 4,290 | 2.76 | $ 68.55 | $ 142,580 |
| Monetary Authorities-Central Bank | 480 | 2.28 | $ 59.40 | $ 123,540 |
| Pipeline Transportation of Crude Oil | 80 | 0.67 | $ 55.43 | $ 115,300 |
| Petroleum and Coal Products Manufacturing | 960 | 0.93 | $ 54.79 | $ 113,950 |
| Engine, Turbine, and Power Transmission Equipment Manufacturing | 440 | 0.49 | $ 54.24 | $ 112,820 |
States and areas with the highest published employment, location quotients, and wages for Business Operations Specialists, All Other are provided. For a list of all areas with employment in Business Operations Specialists, All Other, see the Create Customized Tables function.
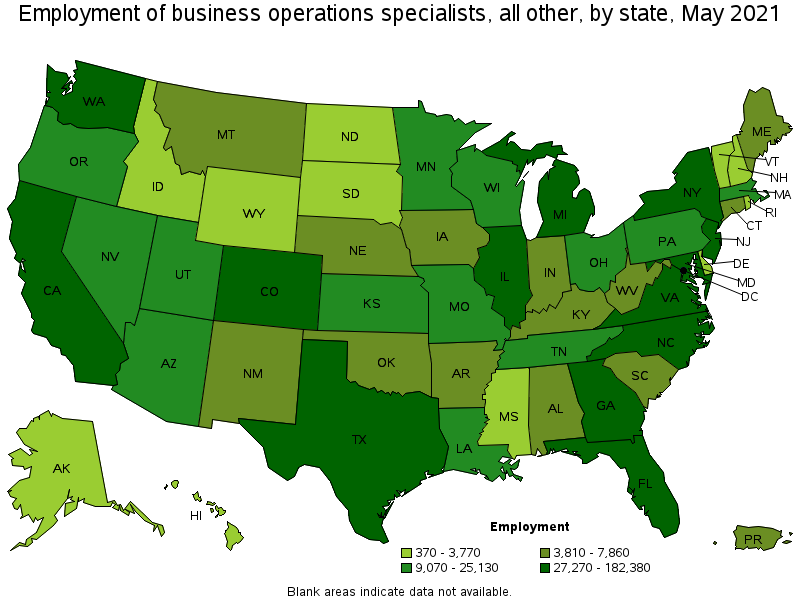
States with the highest employment level in Business Operations Specialists, All Other:
| State | Employment (1) | Employment per thousand jobs | Location quotient (9) | Hourly mean wage | Annual mean wage (2) |
|---|---|---|---|---|---|
| California | 182,380 | 11.03 | 1.51 | $ 39.85 | $ 82,890 |
| Texas | 72,310 | 5.91 | 0.81 | $ 37.77 | $ 78,560 |
| Florida | 68,450 | 7.95 | 1.09 | $ 31.35 | $ 65,200 |
| Georgia | 61,660 | 14.08 | 1.93 | $ 34.79 | $ 72,370 |
| New Jersey | 42,160 | 10.95 | 1.50 | $ 40.64 | $ 84,520 |
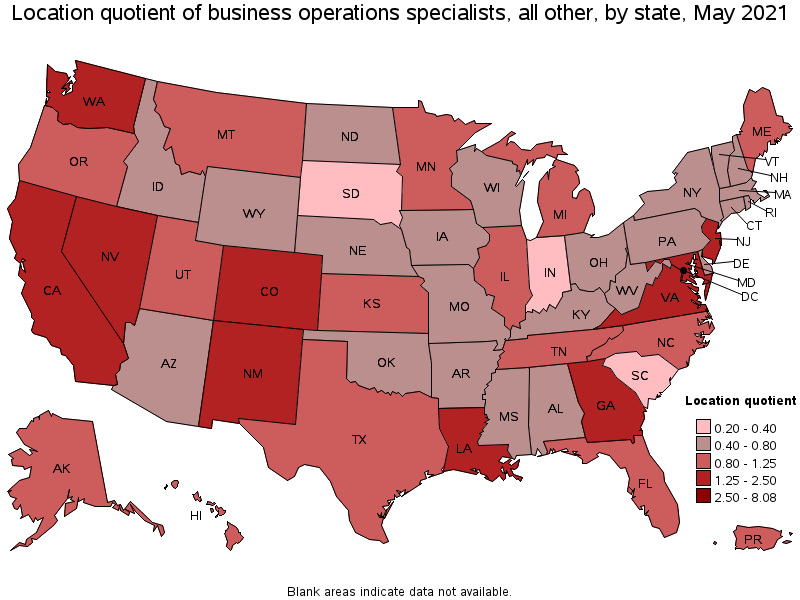
States with the highest concentration of jobs and location quotients in Business Operations Specialists, All Other:
| State | Employment (1) | Employment per thousand jobs | Location quotient (9) | Hourly mean wage | Annual mean wage (2) |
|---|---|---|---|---|---|
| District of Columbia | 39,100 | 59.07 | 8.08 | $ 50.49 | $ 105,020 |
| Georgia | 61,660 | 14.08 | 1.93 | $ 34.79 | $ 72,370 |
| Colorado | 33,440 | 12.76 | 1.74 | $ 41.29 | $ 85,870 |
| Washington | 40,720 | 12.70 | 1.74 | $ 40.43 | $ 84,080 |
| California | 182,380 | 11.03 | 1.51 | $ 39.85 | $ 82,890 |
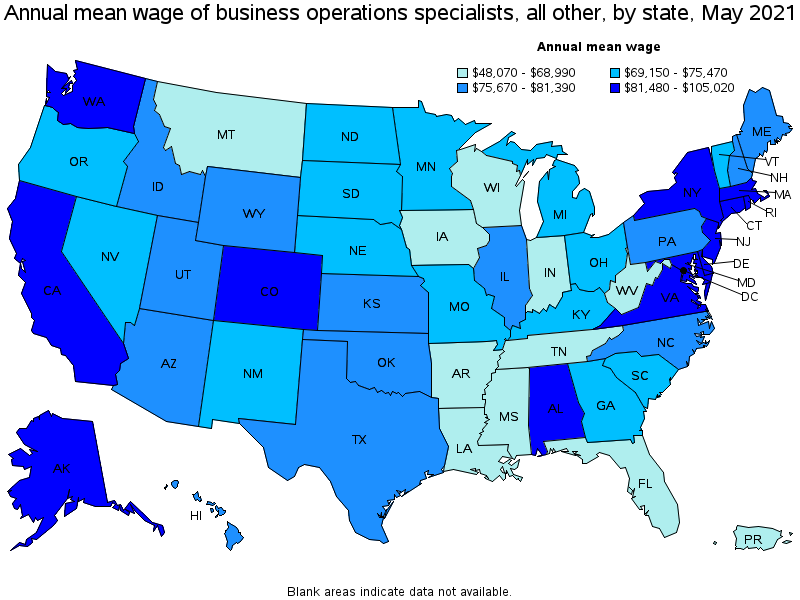
Top paying states for Business Operations Specialists, All Other:
| State | Employment (1) | Employment per thousand jobs | Location quotient (9) | Hourly mean wage | Annual mean wage (2) |
|---|---|---|---|---|---|
| District of Columbia | 39,100 | 59.07 | 8.08 | $ 50.49 | $ 105,020 |
| Delaware | 1,460 | 3.34 | 0.46 | $ 48.50 | $ 100,890 |
| Maryland | 27,270 | 10.71 | 1.46 | $ 45.66 | $ 94,980 |
| Massachusetts | 17,890 | 5.27 | 0.72 | $ 43.20 | $ 89,850 |
| Alabama | 6,190 | 3.21 | 0.44 | $ 43.09 | $ 89,630 |
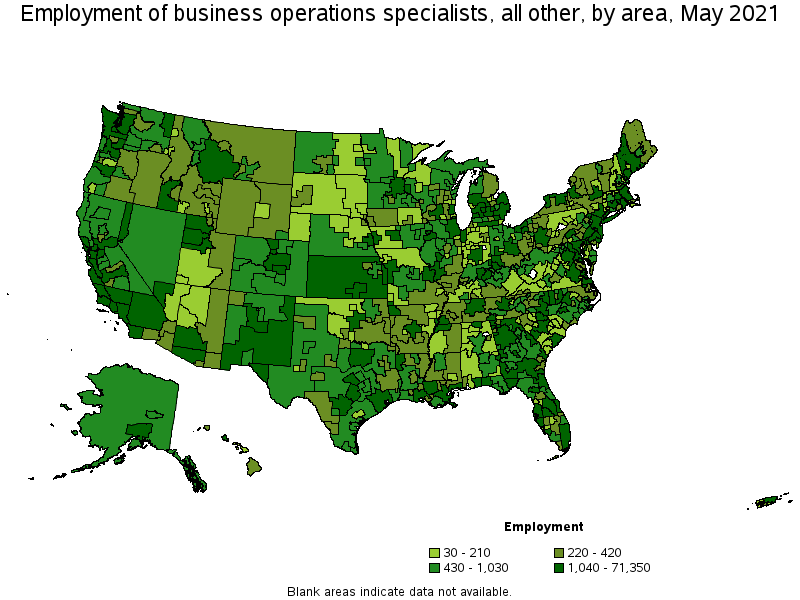
Metropolitan areas with the highest employment level in Business Operations Specialists, All Other:
| Metropolitan area | Employment (1) | Employment per thousand jobs | Location quotient (9) | Hourly mean wage | Annual mean wage (2) |
|---|---|---|---|---|---|
| Washington-Arlington-Alexandria, DC-VA-MD-WV | 71,350 | 24.33 | 3.33 | $ 49.08 | $ 102,090 |
| Los Angeles-Long Beach-Anaheim, CA | 60,250 | 10.53 | 1.44 | $ 37.34 | $ 77,680 |
| New York-Newark-Jersey City, NY-NJ-PA | 50,740 | 5.85 | 0.80 | $ 41.58 | $ 86,490 |
| Atlanta-Sandy Springs-Roswell, GA | 40,340 | 15.59 | 2.13 | $ 36.80 | $ 76,550 |
| San Francisco-Oakland-Hayward, CA | 28,830 | 12.86 | 1.76 | $ 45.78 | $ 95,230 |
| Seattle-Tacoma-Bellevue, WA | 27,160 | 14.16 | 1.94 | $ 42.72 | $ 88,850 |
| Dallas-Fort Worth-Arlington, TX | 25,700 | 7.16 | 0.98 | $ 39.53 | $ 82,220 |
| Chicago-Naperville-Elgin, IL-IN-WI | 24,760 | 5.85 | 0.80 | $ 39.32 | $ 81,790 |
| Denver-Aurora-Lakewood, CO | 20,910 | 14.28 | 1.95 | $ 43.40 | $ 90,280 |
| San Diego-Carlsbad, CA | 18,930 | 13.61 | 1.86 | $ 38.02 | $ 79,080 |
Metropolitan areas with the highest concentration of jobs and location quotients in Business Operations Specialists, All Other:
| Metropolitan area | Employment (1) | Employment per thousand jobs | Location quotient (9) | Hourly mean wage | Annual mean wage (2) |
|---|---|---|---|---|---|
| Warner Robins, GA | 3,040 | 41.09 | 5.62 | $ 37.57 | $ 78,140 |
| California-Lexington Park, MD | 1,700 | 36.75 | 5.03 | $ 59.09 | $ 122,900 |
| Springfield, IL | 3,430 | 35.53 | 4.86 | $ 46.32 | $ 96,340 |
| Gainesville, FL | 3,620 | 27.20 | 3.72 | $ 24.81 | $ 51,600 |
| Trenton, NJ | 5,710 | 25.14 | 3.44 | $ 41.94 | $ 87,240 |
| Washington-Arlington-Alexandria, DC-VA-MD-WV | 71,350 | 24.33 | 3.33 | $ 49.08 | $ 102,090 |
| Bremerton-Silverdale, WA | 2,070 | 23.96 | 3.28 | $ 41.55 | $ 86,420 |
| Lansing-East Lansing, MI | 4,260 | 21.59 | 2.95 | $ 35.86 | $ 74,600 |
| Carson City, NV | 590 | 19.94 | 2.73 | $ 32.50 | $ 67,610 |
| Tallahassee, FL | 3,160 | 18.58 | 2.54 | $ 26.42 | $ 54,950 |
Top paying metropolitan areas for Business Operations Specialists, All Other:
| Metropolitan area | Employment (1) | Employment per thousand jobs | Location quotient (9) | Hourly mean wage | Annual mean wage (2) |
|---|---|---|---|---|---|
| California-Lexington Park, MD | 1,700 | 36.75 | 5.03 | $ 59.09 | $ 122,900 |
| San Jose-Sunnyvale-Santa Clara, CA | 15,170 | 14.20 | 1.94 | $ 54.50 | $ 113,350 |
| Huntsville, AL | 2,720 | 11.83 | 1.62 | $ 51.37 | $ 106,850 |
| Washington-Arlington-Alexandria, DC-VA-MD-WV | 71,350 | 24.33 | 3.33 | $ 49.08 | $ 102,090 |
| Springfield, IL | 3,430 | 35.53 | 4.86 | $ 46.32 | $ 96,340 |
| San Francisco-Oakland-Hayward, CA | 28,830 | 12.86 | 1.76 | $ 45.78 | $ 95,230 |
| Idaho Falls, ID | 420 | 5.87 | 0.80 | $ 44.64 | $ 92,840 |
| Boston-Cambridge-Nashua, MA-NH | 14,720 | 5.69 | 0.78 | $ 44.35 | $ 92,250 |
| Bridgeport-Stamford-Norwalk, CT | 1,310 | 3.48 | 0.48 | $ 44.14 | $ 91,820 |
| Dayton, OH | 3,650 | 10.28 | 1.41 | $ 43.73 | $ 90,960 |
Nonmetropolitan areas with the highest employment in Business Operations Specialists, All Other:
| Nonmetropolitan area | Employment (1) | Employment per thousand jobs | Location quotient (9) | Hourly mean wage | Annual mean wage (2) |
|---|---|---|---|---|---|
| Southwest Montana nonmetropolitan area | 1,580 | 11.40 | 1.56 | $ 29.93 | $ 62,250 |
| Southwest Maine nonmetropolitan area | 1,570 | 8.58 | 1.17 | $ 39.75 | $ 82,690 |
| South Georgia nonmetropolitan area | 1,560 | 8.48 | 1.16 | $ 28.52 | $ 59,330 |
| North Georgia nonmetropolitan area | 1,450 | 8.55 | 1.17 | $ 27.47 | $ 57,150 |
| Western Washington nonmetropolitan area | 1,310 | 10.95 | 1.50 | $ 30.35 | $ 63,130 |
Nonmetropolitan areas with the highest concentration of jobs and location quotients in Business Operations Specialists, All Other:
| Nonmetropolitan area | Employment (1) | Employment per thousand jobs | Location quotient (9) | Hourly mean wage | Annual mean wage (2) |
|---|---|---|---|---|---|
| Southwest Montana nonmetropolitan area | 1,580 | 11.40 | 1.56 | $ 29.93 | $ 62,250 |
| Western Washington nonmetropolitan area | 1,310 | 10.95 | 1.50 | $ 30.35 | $ 63,130 |
| Nevada nonmetropolitan area | 940 | 9.69 | 1.33 | $ 33.10 | $ 68,850 |
| Central Louisiana nonmetropolitan area | 710 | 9.64 | 1.32 | $ 32.93 | $ 68,500 |
| East Georgia nonmetropolitan area | 810 | 9.61 | 1.31 | $ 26.60 | $ 55,330 |
Top paying nonmetropolitan areas for Business Operations Specialists, All Other:
| Nonmetropolitan area | Employment (1) | Employment per thousand jobs | Location quotient (9) | Hourly mean wage | Annual mean wage (2) |
|---|---|---|---|---|---|
| Northeast Virginia nonmetropolitan area | 400 | 8.21 | 1.12 | $ 48.46 | $ 100,800 |
| Western Wyoming nonmetropolitan area | 380 | 4.06 | 0.55 | $ 47.90 | $ 99,630 |
| Massachusetts nonmetropolitan area | 190 | 3.26 | 0.45 | $ 43.05 | $ 89,540 |
| Alaska nonmetropolitan area | 430 | 4.39 | 0.60 | $ 41.33 | $ 85,970 |
| South Illinois nonmetropolitan area | 270 | 3.24 | 0.44 | $ 40.23 | $ 83,670 |
These estimates are calculated with data collected from employers in all industry sectors, all metropolitan and nonmetropolitan areas, and all states and the District of Columbia. The top employment and wage figures are provided above. The complete list is available in the downloadable XLS files.
The percentile wage estimate is the value of a wage below which a certain percent of workers fall. The median wage is the 50th percentile wage estimate—50 percent of workers earn less than the median and 50 percent of workers earn more than the median. More about percentile wages.
(1) Estimates for detailed occupations do not sum to the totals because the totals include occupations not shown separately. Estimates do not include self-employed workers.
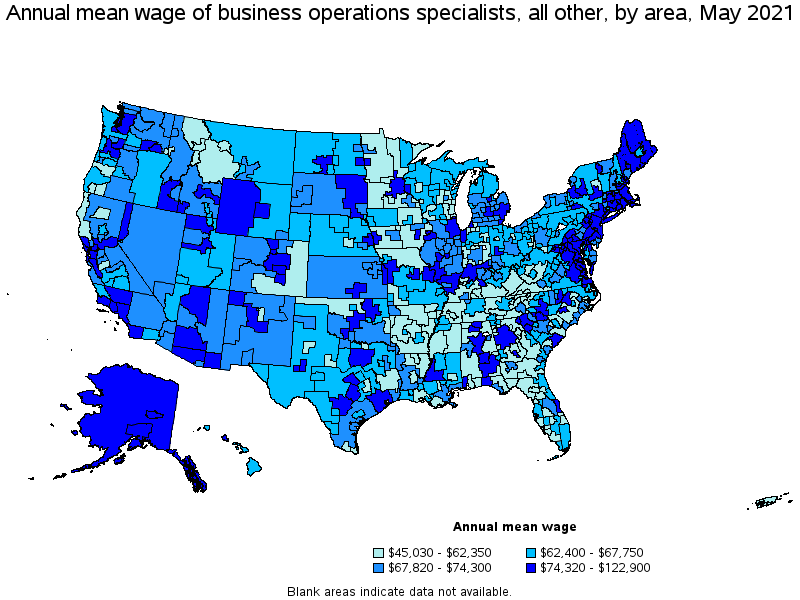
(2) Annual wages have been calculated by multiplying the hourly mean wage by a "year-round, full-time" hours figure of 2,080 hours; for those occupations where there is not an hourly wage published, the annual wage has been directly calculated from the reported survey data.
(3) The relative standard error (RSE) is a measure of the reliability of a survey statistic. The smaller the relative standard error, the more precise the estimate.
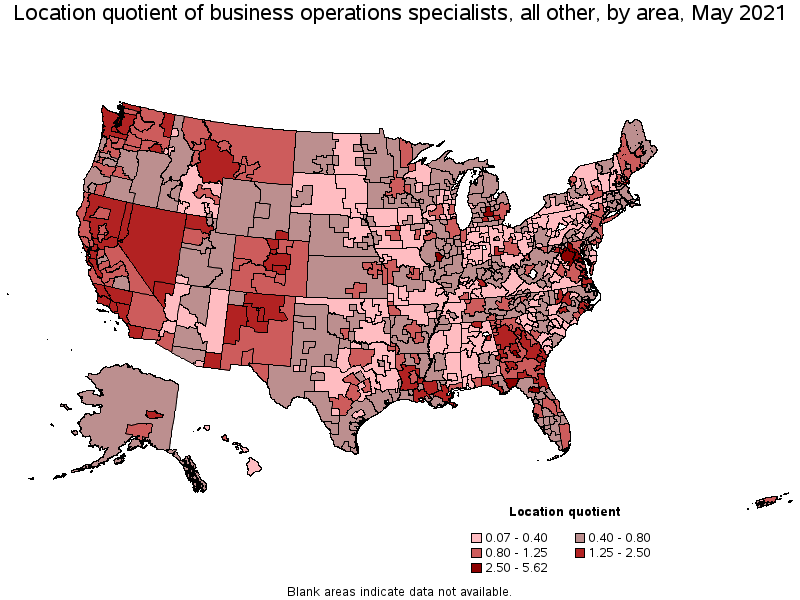
(9) The location quotient is the ratio of the area concentration of occupational employment to the national average concentration. A location quotient greater than one indicates the occupation has a higher share of employment than average, and a location quotient less than one indicates the occupation is less prevalent in the area than average.
Other OEWS estimates and related information:
May 2021 National Occupational Employment and Wage Estimates
May 2021 State Occupational Employment and Wage Estimates
May 2021 Metropolitan and Nonmetropolitan Area Occupational Employment and Wage Estimates
May 2021 National Industry-Specific Occupational Employment and Wage Estimates
Last Modified Date: March 31, 2022