
An official website of the United States government
An official website of the United States government
The .gov means it's official.
Federal government websites often end in .gov or .mil. Before sharing sensitive information,
make sure you're on a federal government site.
The site is secure.
The
https:// ensures that you are connecting to the official website and that any
information you provide is encrypted and transmitted securely.
Plan and design land areas for projects such as parks and other recreational facilities, airports, highways, hospitals, schools, land subdivisions, and commercial, industrial, and residential sites.
Employment estimate and mean wage estimates for Landscape Architects:
| Employment (1) | Employment RSE (3) |
Mean hourly wage |
Mean annual wage (2) |
Wage RSE (3) |
|---|---|---|---|---|
| 17,430 | 4.0 % | $ 36.05 | $ 74,980 | 1.3 % |
Percentile wage estimates for Landscape Architects:
| Percentile | 10% | 25% | 50% (Median) |
75% | 90% |
|---|---|---|---|---|---|
| Hourly Wage | $ 20.80 | $ 24.72 | $ 32.67 | $ 45.34 | $ 55.47 |
| Annual Wage (2) | $ 43,260 | $ 51,420 | $ 67,950 | $ 94,310 | $ 115,380 |
Industries with the highest published employment and wages for Landscape Architects are provided. For a list of all industries with employment in Landscape Architects, see the Create Customized Tables function.
Industries with the highest levels of employment in Landscape Architects:
| Industry | Employment (1) | Percent of industry employment | Hourly mean wage | Annual mean wage (2) |
|---|---|---|---|---|
| Architectural, Engineering, and Related Services | 10,940 | 0.72 | $ 36.83 | $ 76,610 |
| Services to Buildings and Dwellings | 3,440 | 0.16 | $ 28.80 | $ 59,900 |
| Local Government, excluding schools and hospitals (OEWS Designation) | 790 | 0.01 | $ 49.20 | $ 102,330 |
| State Government, excluding schools and hospitals (OEWS Designation) | 480 | 0.02 | $ 47.97 | $ 99,780 |
| Lawn and Garden Equipment and Supplies Stores | 430 | 0.24 | $ 27.27 | $ 56,730 |
Industries with the highest concentration of employment in Landscape Architects:
| Industry | Employment (1) | Percent of industry employment | Hourly mean wage | Annual mean wage (2) |
|---|---|---|---|---|
| Architectural, Engineering, and Related Services | 10,940 | 0.72 | $ 36.83 | $ 76,610 |
| Lawn and Garden Equipment and Supplies Stores | 430 | 0.24 | $ 27.27 | $ 56,730 |
| Services to Buildings and Dwellings | 3,440 | 0.16 | $ 28.80 | $ 59,900 |
| Other Specialty Trade Contractors | 260 | 0.04 | $ 25.52 | $ 53,080 |
| State Government, excluding schools and hospitals (OEWS Designation) | 480 | 0.02 | $ 47.97 | $ 99,780 |
Top paying industries for Landscape Architects:
| Industry | Employment (1) | Percent of industry employment | Hourly mean wage | Annual mean wage (2) |
|---|---|---|---|---|
| Local Government, excluding schools and hospitals (OEWS Designation) | 790 | 0.01 | $ 49.20 | $ 102,330 |
| State Government, excluding schools and hospitals (OEWS Designation) | 480 | 0.02 | $ 47.97 | $ 99,780 |
| Federal Executive Branch (OEWS Designation) | 300 | 0.01 | $ 46.92 | $ 97,590 |
| Residential Building Construction | (8) | (8) | $ 42.97 | $ 89,370 |
| Management of Companies and Enterprises | (8) | (8) | $ 38.32 | $ 79,710 |
States and areas with the highest published employment, location quotients, and wages for Landscape Architects are provided. For a list of all areas with employment in Landscape Architects, see the Create Customized Tables function.
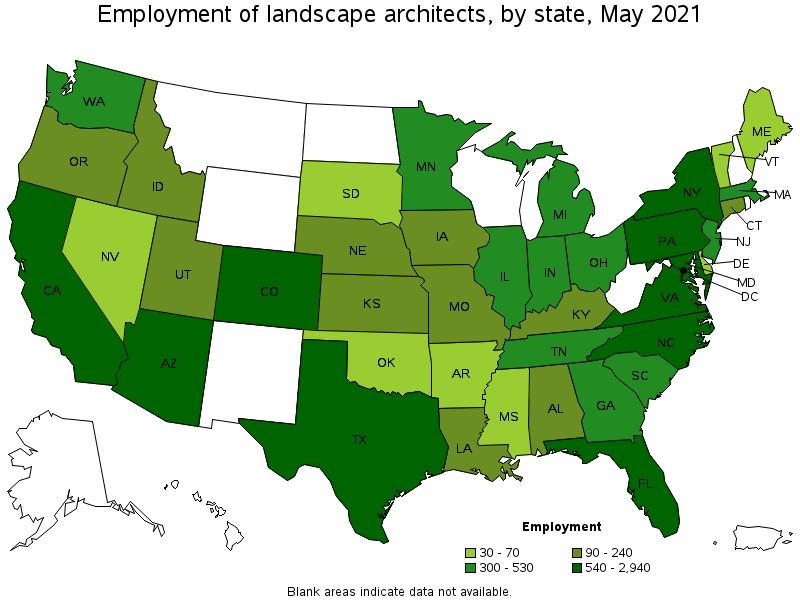
States with the highest employment level in Landscape Architects:
| State | Employment (1) | Employment per thousand jobs | Location quotient (9) | Hourly mean wage | Annual mean wage (2) |
|---|---|---|---|---|---|
| California | 2,940 | 0.18 | 1.44 | $ 43.12 | $ 89,690 |
| Florida | 1,170 | 0.14 | 1.10 | $ 32.99 | $ 68,630 |
| Colorado | 1,140 | 0.44 | 3.52 | $ 32.97 | $ 68,590 |
| New York | 1,040 | 0.12 | 0.97 | $ 43.85 | $ 91,200 |
| North Carolina | 910 | 0.21 | 1.66 | $ 31.54 | $ 65,600 |
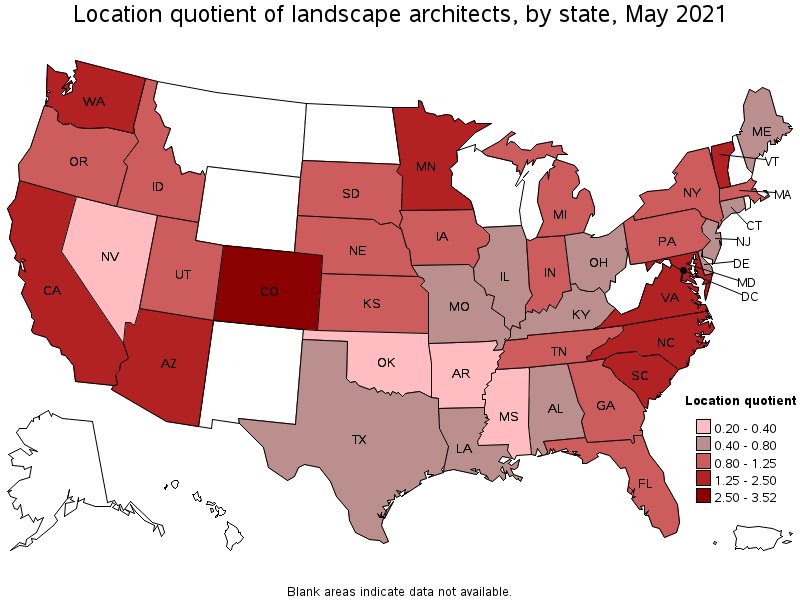
States with the highest concentration of jobs and location quotients in Landscape Architects:
| State | Employment (1) | Employment per thousand jobs | Location quotient (9) | Hourly mean wage | Annual mean wage (2) |
|---|---|---|---|---|---|
| Colorado | 1,140 | 0.44 | 3.52 | $ 32.97 | $ 68,590 |
| Vermont | 70 | 0.23 | 1.86 | $ 33.20 | $ 69,060 |
| Maryland | 540 | 0.21 | 1.70 | $ 38.75 | $ 80,600 |
| North Carolina | 910 | 0.21 | 1.66 | $ 31.54 | $ 65,600 |
| Arizona | 580 | 0.20 | 1.63 | $ 27.53 | $ 57,260 |
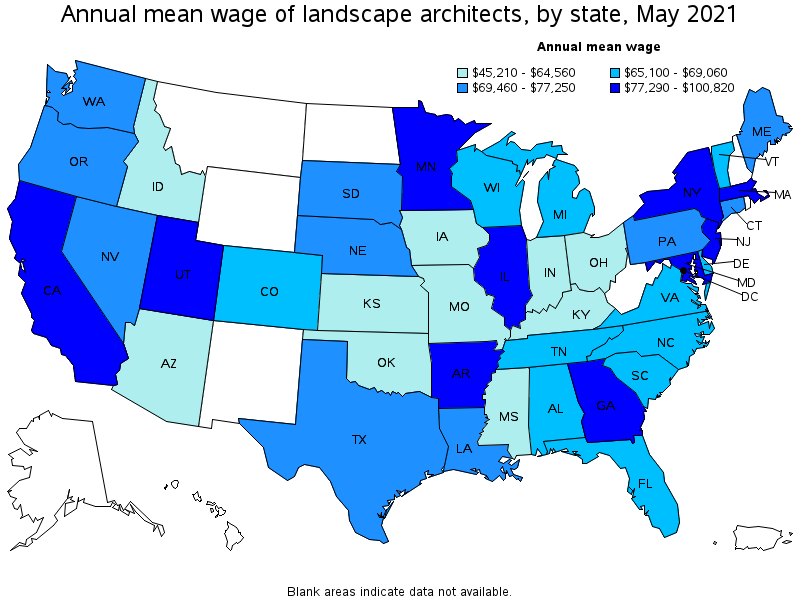
Top paying states for Landscape Architects:
| State | Employment (1) | Employment per thousand jobs | Location quotient (9) | Hourly mean wage | Annual mean wage (2) |
|---|---|---|---|---|---|
| District of Columbia | 50 | 0.08 | 0.67 | $ 48.47 | $ 100,820 |
| Massachusetts | 370 | 0.11 | 0.88 | $ 44.45 | $ 92,460 |
| New York | 1,040 | 0.12 | 0.97 | $ 43.85 | $ 91,200 |
| Arkansas | 40 | 0.04 | 0.30 | $ 43.75 | $ 90,990 |
| California | 2,940 | 0.18 | 1.44 | $ 43.12 | $ 89,690 |
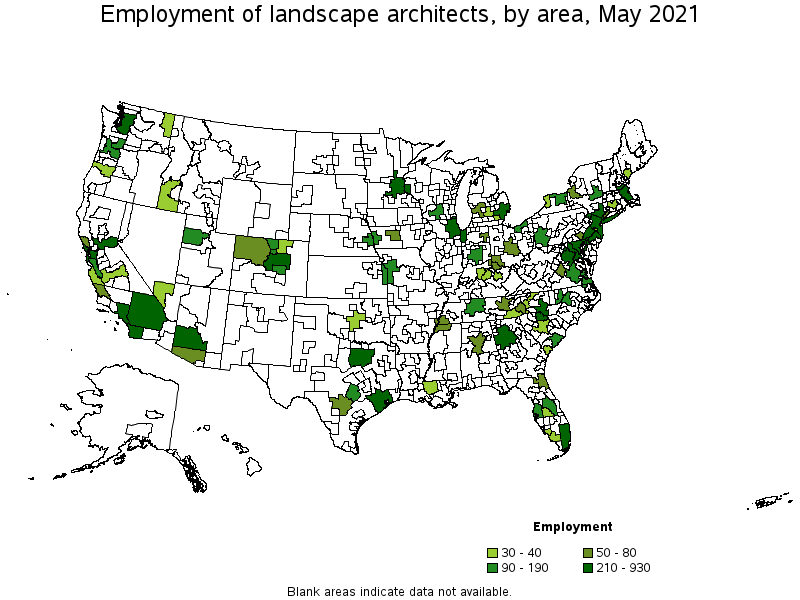
Metropolitan areas with the highest employment level in Landscape Architects:
| Metropolitan area | Employment (1) | Employment per thousand jobs | Location quotient (9) | Hourly mean wage | Annual mean wage (2) |
|---|---|---|---|---|---|
| New York-Newark-Jersey City, NY-NJ-PA | 930 | 0.11 | 0.86 | $ 46.54 | $ 96,810 |
| Los Angeles-Long Beach-Anaheim, CA | 790 | 0.14 | 1.12 | $ 41.75 | $ 86,840 |
| Denver-Aurora-Lakewood, CO | 710 | 0.49 | 3.93 | $ 33.47 | $ 69,630 |
| San Francisco-Oakland-Hayward, CA | 660 | 0.29 | 2.37 | $ 52.21 | $ 108,590 |
| Washington-Arlington-Alexandria, DC-VA-MD-WV | 590 | 0.20 | 1.63 | $ 38.29 | $ 79,650 |
| Philadelphia-Camden-Wilmington, PA-NJ-DE-MD | 480 | 0.18 | 1.45 | $ 35.47 | $ 73,780 |
| Phoenix-Mesa-Scottsdale, AZ | 450 | 0.21 | 1.70 | $ 27.69 | $ 57,600 |
| Atlanta-Sandy Springs-Roswell, GA | 440 | 0.17 | 1.37 | $ 40.73 | $ 84,710 |
| Miami-Fort Lauderdale-West Palm Beach, FL | 410 | 0.17 | 1.35 | $ 33.42 | $ 69,520 |
| Minneapolis-St. Paul-Bloomington, MN-WI | 400 | 0.22 | 1.76 | $ 39.90 | $ 83,000 |
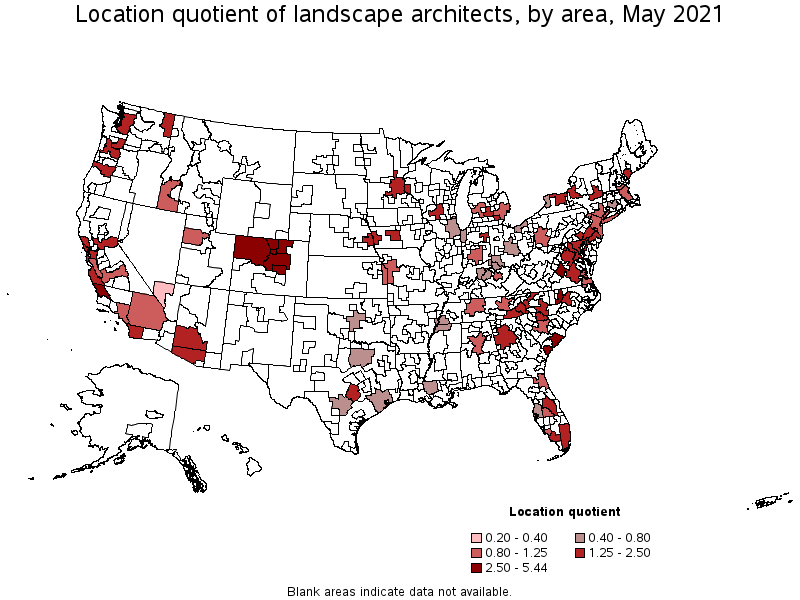
Metropolitan areas with the highest concentration of jobs and location quotients in Landscape Architects:
| Metropolitan area | Employment (1) | Employment per thousand jobs | Location quotient (9) | Hourly mean wage | Annual mean wage (2) |
|---|---|---|---|---|---|
| Charlottesville, VA | 70 | 0.67 | 5.44 | $ 31.51 | $ 65,550 |
| Fort Collins, CO | 100 | 0.65 | 5.26 | $ 32.86 | $ 68,360 |
| Boulder, CO | 100 | 0.56 | 4.49 | $ 34.54 | $ 71,840 |
| San Luis Obispo-Paso Robles-Arroyo Grande, CA | 60 | 0.55 | 4.43 | $ 44.95 | $ 93,500 |
| Denver-Aurora-Lakewood, CO | 710 | 0.49 | 3.93 | $ 33.47 | $ 69,630 |
| Greeley, CO | 40 | 0.43 | 3.49 | $ 25.36 | $ 52,750 |
| Hilton Head Island-Bluffton-Beaufort, SC | 30 | 0.43 | 3.45 | $ 30.27 | $ 62,960 |
| Durham-Chapel Hill, NC | 130 | 0.42 | 3.37 | $ 33.16 | $ 68,980 |
| Colorado Springs, CO | 90 | 0.33 | 2.66 | $ 32.82 | $ 68,270 |
| Charleston-North Charleston, SC | 110 | 0.33 | 2.65 | $ 33.62 | $ 69,930 |
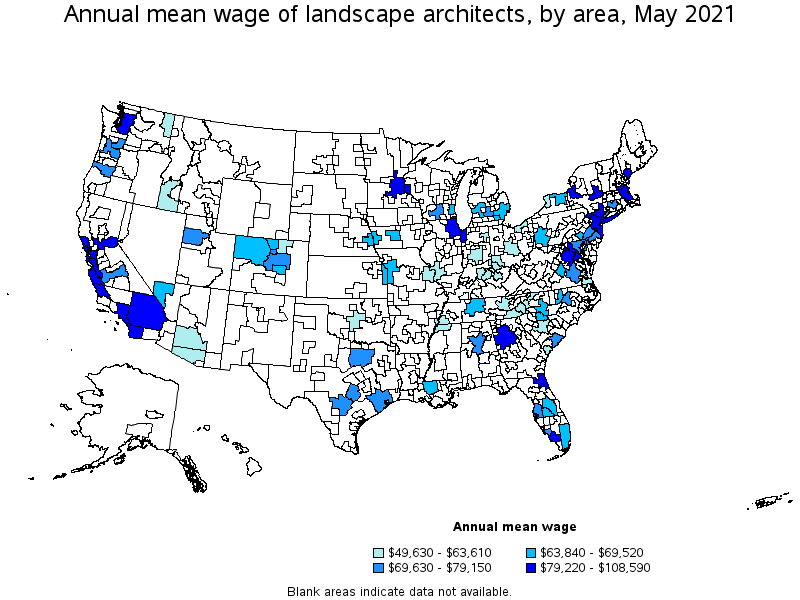
Top paying metropolitan areas for Landscape Architects:
| Metropolitan area | Employment (1) | Employment per thousand jobs | Location quotient (9) | Hourly mean wage | Annual mean wage (2) |
|---|---|---|---|---|---|
| San Francisco-Oakland-Hayward, CA | 660 | 0.29 | 2.37 | $ 52.21 | $ 108,590 |
| New York-Newark-Jersey City, NY-NJ-PA | 930 | 0.11 | 0.86 | $ 46.54 | $ 96,810 |
| Santa Rosa, CA | 50 | 0.24 | 1.93 | $ 45.73 | $ 95,110 |
| Boston-Cambridge-Nashua, MA-NH | 280 | 0.11 | 0.87 | $ 45.29 | $ 94,200 |
| San Luis Obispo-Paso Robles-Arroyo Grande, CA | 60 | 0.55 | 4.43 | $ 44.95 | $ 93,500 |
| Naples-Immokalee-Marco Island, FL | 30 | 0.21 | 1.73 | $ 42.19 | $ 87,750 |
| Los Angeles-Long Beach-Anaheim, CA | 790 | 0.14 | 1.12 | $ 41.75 | $ 86,840 |
| Sacramento--Roseville--Arden-Arcade, CA | 220 | 0.22 | 1.80 | $ 41.10 | $ 85,490 |
| San Jose-Sunnyvale-Santa Clara, CA | 140 | 0.13 | 1.06 | $ 40.99 | $ 85,260 |
| Salinas, CA | 40 | 0.22 | 1.80 | $ 40.74 | $ 84,730 |
Nonmetropolitan areas with the highest employment in Landscape Architects:
| Nonmetropolitan area | Employment (1) | Employment per thousand jobs | Location quotient (9) | Hourly mean wage | Annual mean wage (2) |
|---|---|---|---|---|---|
| Northwest Colorado nonmetropolitan area | 60 | 0.47 | 3.82 | $ 31.45 | $ 65,420 |
| Mountain North Carolina nonmetropolitan area | 30 | 0.26 | 2.07 | $ 25.26 | $ 52,530 |
Nonmetropolitan areas with the highest concentration of jobs and location quotients in Landscape Architects:
| Nonmetropolitan area | Employment (1) | Employment per thousand jobs | Location quotient (9) | Hourly mean wage | Annual mean wage (2) |
|---|---|---|---|---|---|
| Northwest Colorado nonmetropolitan area | 60 | 0.47 | 3.82 | $ 31.45 | $ 65,420 |
| Mountain North Carolina nonmetropolitan area | 30 | 0.26 | 2.07 | $ 25.26 | $ 52,530 |
Top paying nonmetropolitan areas for Landscape Architects:
| Nonmetropolitan area | Employment (1) | Employment per thousand jobs | Location quotient (9) | Hourly mean wage | Annual mean wage (2) |
|---|---|---|---|---|---|
| Northwest Colorado nonmetropolitan area | 60 | 0.47 | 3.82 | $ 31.45 | $ 65,420 |
| Mountain North Carolina nonmetropolitan area | 30 | 0.26 | 2.07 | $ 25.26 | $ 52,530 |
These estimates are calculated with data collected from employers in all industry sectors, all metropolitan and nonmetropolitan areas, and all states and the District of Columbia. The top employment and wage figures are provided above. The complete list is available in the downloadable XLS files.
The percentile wage estimate is the value of a wage below which a certain percent of workers fall. The median wage is the 50th percentile wage estimate—50 percent of workers earn less than the median and 50 percent of workers earn more than the median. More about percentile wages.
(1) Estimates for detailed occupations do not sum to the totals because the totals include occupations not shown separately. Estimates do not include self-employed workers.
(2) Annual wages have been calculated by multiplying the hourly mean wage by a "year-round, full-time" hours figure of 2,080 hours; for those occupations where there is not an hourly wage published, the annual wage has been directly calculated from the reported survey data.
(3) The relative standard error (RSE) is a measure of the reliability of a survey statistic. The smaller the relative standard error, the more precise the estimate.
(8) Estimate not released.
(9) The location quotient is the ratio of the area concentration of occupational employment to the national average concentration. A location quotient greater than one indicates the occupation has a higher share of employment than average, and a location quotient less than one indicates the occupation is less prevalent in the area than average.
Other OEWS estimates and related information:
May 2021 National Occupational Employment and Wage Estimates
May 2021 State Occupational Employment and Wage Estimates
May 2021 Metropolitan and Nonmetropolitan Area Occupational Employment and Wage Estimates
May 2021 National Industry-Specific Occupational Employment and Wage Estimates
Last Modified Date: March 31, 2022