
An official website of the United States government
An official website of the United States government
The .gov means it's official.
Federal government websites often end in .gov or .mil. Before sharing sensitive information,
make sure you're on a federal government site.
The site is secure.
The
https:// ensures that you are connecting to the official website and that any
information you provide is encrypted and transmitted securely.
Perform engineering duties in planning, designing, and overseeing construction and maintenance of building structures and facilities, such as roads, railroads, airports, bridges, harbors, channels, dams, irrigation projects, pipelines, power plants, and water and sewage systems. Includes architectural, structural, traffic, and geotechnical engineers. Excludes �Hydrologists� (19-2043).
Employment estimate and mean wage estimates for Civil Engineers:
| Employment (1) | Employment RSE (3) |
Mean hourly wage |
Mean annual wage (2) |
Wage RSE (3) |
|---|---|---|---|---|
| 304,310 | 1.3 % | $ 45.91 | $ 95,490 | 0.5 % |
Percentile wage estimates for Civil Engineers:
| Percentile | 10% | 25% | 50% (Median) |
75% | 90% |
|---|---|---|---|---|---|
| Hourly Wage | $ 29.11 | $ 35.70 | $ 42.33 | $ 56.38 | $ 64.10 |
| Annual Wage (2) | $ 60,550 | $ 74,250 | $ 88,050 | $ 117,270 | $ 133,320 |
Industries with the highest published employment and wages for Civil Engineers are provided. For a list of all industries with employment in Civil Engineers, see the Create Customized Tables function.
Industries with the highest levels of employment in Civil Engineers:
| Industry | Employment (1) | Percent of industry employment | Hourly mean wage | Annual mean wage (2) |
|---|---|---|---|---|
| Architectural, Engineering, and Related Services | 161,310 | 10.67 | $ 46.85 | $ 97,450 |
| State Government, excluding schools and hospitals (OEWS Designation) | 34,570 | 1.57 | $ 43.07 | $ 89,580 |
| Local Government, excluding schools and hospitals (OEWS Designation) | 32,640 | 0.61 | $ 47.92 | $ 99,680 |
| Nonresidential Building Construction | 19,370 | 2.49 | $ 38.00 | $ 79,030 |
| Federal Executive Branch (OEWS Designation) | 9,890 | 0.47 | $ 47.62 | $ 99,050 |
Industries with the highest concentration of employment in Civil Engineers:
| Industry | Employment (1) | Percent of industry employment | Hourly mean wage | Annual mean wage (2) |
|---|---|---|---|---|
| Architectural, Engineering, and Related Services | 161,310 | 10.67 | $ 46.85 | $ 97,450 |
| Nonresidential Building Construction | 19,370 | 2.49 | $ 38.00 | $ 79,030 |
| State Government, excluding schools and hospitals (OEWS Designation) | 34,570 | 1.57 | $ 43.07 | $ 89,580 |
| Pipeline Transportation of Natural Gas | 420 | 1.38 | $ 44.84 | $ 93,270 |
| Highway, Street, and Bridge Construction | 4,820 | 1.36 | $ 41.95 | $ 87,260 |
Top paying industries for Civil Engineers:
| Industry | Employment (1) | Percent of industry employment | Hourly mean wage | Annual mean wage (2) |
|---|---|---|---|---|
| Oil and Gas Extraction | 430 | 0.40 | $ 83.92 | $ 174,550 |
| Aerospace Product and Parts Manufacturing | 780 | 0.17 | $ 62.22 | $ 129,420 |
| Other Professional, Scientific, and Technical Services | 280 | 0.04 | $ 60.62 | $ 126,090 |
| Petroleum and Coal Products Manufacturing | 60 | 0.05 | $ 59.96 | $ 124,710 |
| Semiconductor and Other Electronic Component Manufacturing | (8) | (8) | $ 56.84 | $ 118,220 |
States and areas with the highest published employment, location quotients, and wages for Civil Engineers are provided. For a list of all areas with employment in Civil Engineers, see the Create Customized Tables function.
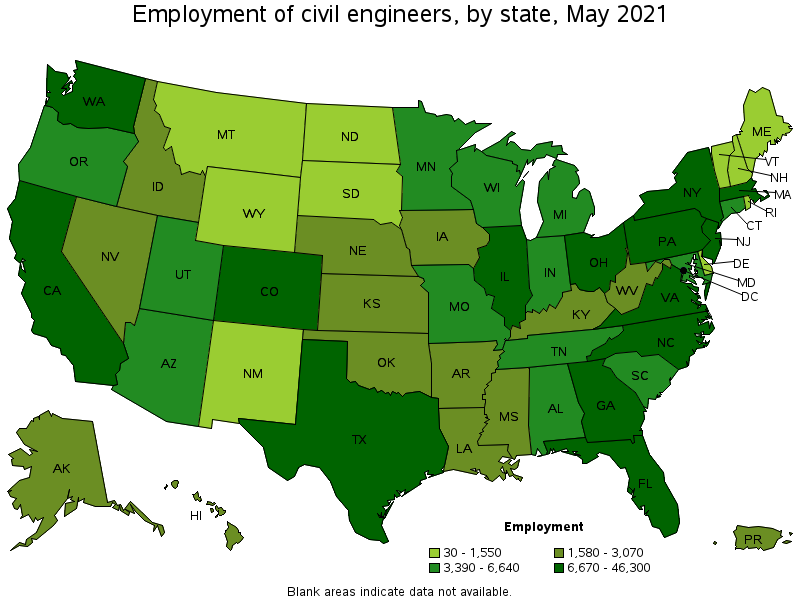
States with the highest employment level in Civil Engineers:
| State | Employment (1) | Employment per thousand jobs | Location quotient (9) | Hourly mean wage | Annual mean wage (2) |
|---|---|---|---|---|---|
| California | 46,300 | 2.80 | 1.30 | $ 52.83 | $ 109,890 |
| Texas | 27,840 | 2.28 | 1.05 | $ 45.42 | $ 94,470 |
| Florida | 15,900 | 1.85 | 0.86 | $ 45.22 | $ 94,050 |
| New York | 14,890 | 1.72 | 0.80 | $ 48.01 | $ 99,860 |
| Illinois | 12,600 | 2.24 | 1.04 | $ 46.00 | $ 95,670 |
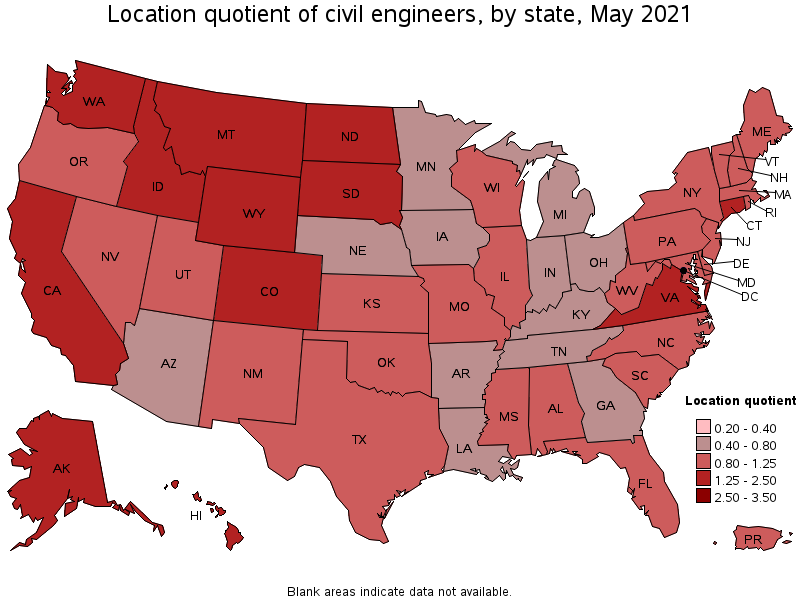
States with the highest concentration of jobs and location quotients in Civil Engineers:
| State | Employment (1) | Employment per thousand jobs | Location quotient (9) | Hourly mean wage | Annual mean wage (2) |
|---|---|---|---|---|---|
| Alaska | 1,580 | 5.33 | 2.47 | $ 51.17 | $ 106,440 |
| Colorado | 11,010 | 4.20 | 1.94 | $ 48.46 | $ 100,800 |
| Washington | 11,610 | 3.62 | 1.68 | $ 46.80 | $ 97,340 |
| Hawaii | 1,960 | 3.58 | 1.66 | $ 41.00 | $ 85,280 |
| Montana | 1,550 | 3.30 | 1.53 | $ 38.44 | $ 79,960 |
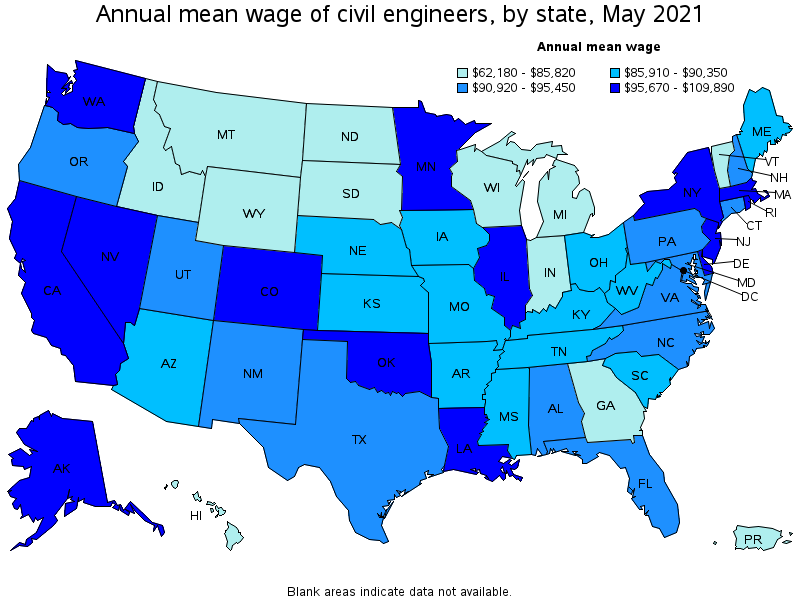
Top paying states for Civil Engineers:
| State | Employment (1) | Employment per thousand jobs | Location quotient (9) | Hourly mean wage | Annual mean wage (2) |
|---|---|---|---|---|---|
| California | 46,300 | 2.80 | 1.30 | $ 52.83 | $ 109,890 |
| Alaska | 1,580 | 5.33 | 2.47 | $ 51.17 | $ 106,440 |
| Delaware | 1,080 | 2.47 | 1.15 | $ 50.78 | $ 105,620 |
| Rhode Island | 1,050 | 2.30 | 1.06 | $ 50.01 | $ 104,010 |
| New Jersey | 8,100 | 2.10 | 0.97 | $ 49.59 | $ 103,140 |
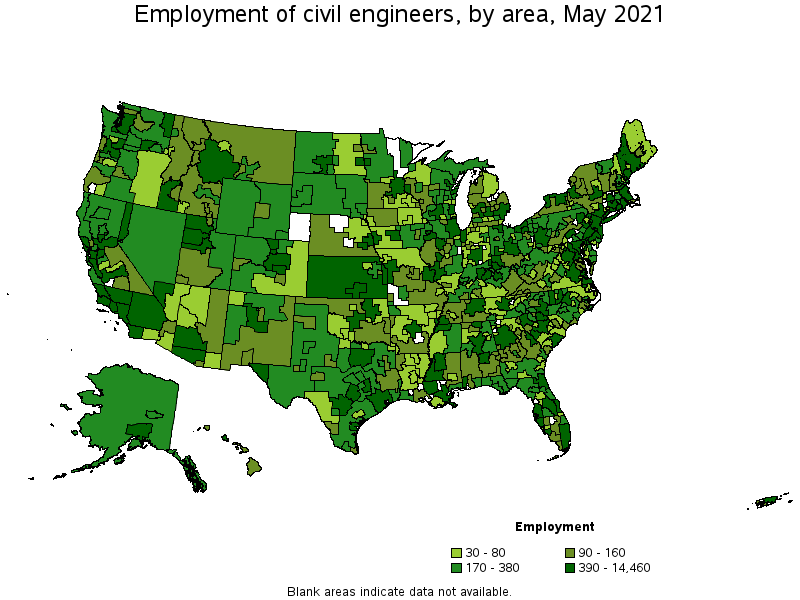
Metropolitan areas with the highest employment level in Civil Engineers:
| Metropolitan area | Employment (1) | Employment per thousand jobs | Location quotient (9) | Hourly mean wage | Annual mean wage (2) |
|---|---|---|---|---|---|
| New York-Newark-Jersey City, NY-NJ-PA | 14,460 | 1.67 | 0.77 | $ 51.43 | $ 106,970 |
| Los Angeles-Long Beach-Anaheim, CA | 12,220 | 2.14 | 0.99 | $ 52.24 | $ 108,660 |
| Houston-The Woodlands-Sugar Land, TX | 9,930 | 3.43 | 1.59 | $ 50.44 | $ 104,910 |
| San Francisco-Oakland-Hayward, CA | 9,710 | 4.33 | 2.00 | $ 56.04 | $ 116,550 |
| Chicago-Naperville-Elgin, IL-IN-WI | 9,230 | 2.18 | 1.01 | $ 47.29 | $ 98,370 |
| Washington-Arlington-Alexandria, DC-VA-MD-WV | 7,600 | 2.59 | 1.20 | $ 48.14 | $ 100,120 |
| Seattle-Tacoma-Bellevue, WA | 7,300 | 3.81 | 1.76 | $ 48.43 | $ 100,730 |
| Denver-Aurora-Lakewood, CO | 6,880 | 4.70 | 2.18 | $ 49.03 | $ 101,980 |
| Boston-Cambridge-Nashua, MA-NH | 6,020 | 2.33 | 1.08 | $ 48.24 | $ 100,330 |
| Dallas-Fort Worth-Arlington, TX | 5,880 | 1.64 | 0.76 | $ 44.87 | $ 93,340 |
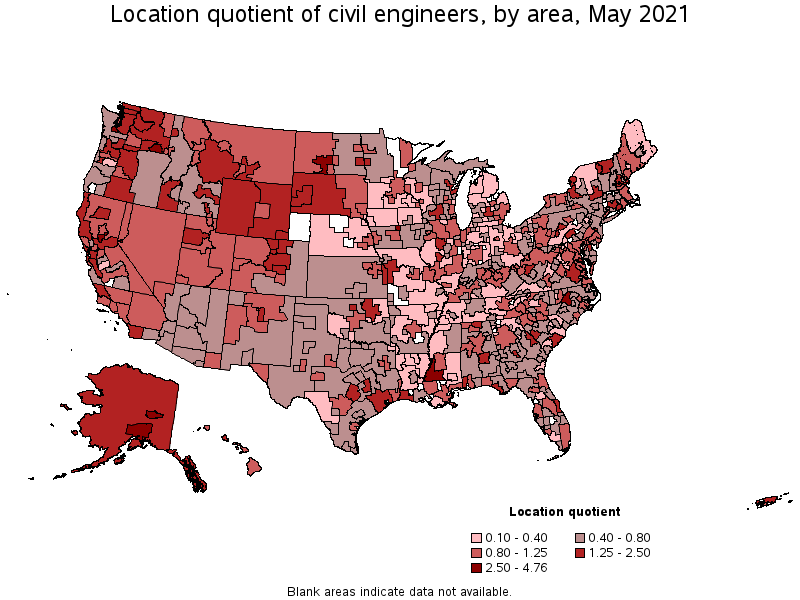
Metropolitan areas with the highest concentration of jobs and location quotients in Civil Engineers:
| Metropolitan area | Employment (1) | Employment per thousand jobs | Location quotient (9) | Hourly mean wage | Annual mean wage (2) |
|---|---|---|---|---|---|
| Carson City, NV | 310 | 10.28 | 4.76 | $ 36.40 | $ 75,700 |
| Yuba City, CA | 400 | 8.60 | 3.98 | $ 49.99 | $ 103,990 |
| Walla Walla, WA | 210 | 8.03 | 3.72 | $ 47.75 | $ 99,320 |
| Fairbanks, AK | 280 | 8.02 | 3.71 | $ 49.00 | $ 101,920 |
| Olympia-Tumwater, WA | 730 | 6.56 | 3.04 | $ 45.11 | $ 93,820 |
| Bismarck, ND | 450 | 6.53 | 3.02 | $ 40.93 | $ 85,140 |
| Anchorage, AK | 1,020 | 6.32 | 2.93 | $ 52.31 | $ 108,800 |
| Raleigh, NC | 3,700 | 5.85 | 2.71 | $ 45.11 | $ 93,840 |
| Ames, IA | 260 | 5.77 | 2.67 | $ 41.49 | $ 86,300 |
| Sacramento--Roseville--Arden-Arcade, CA | 5,090 | 5.18 | 2.40 | $ 55.34 | $ 115,120 |
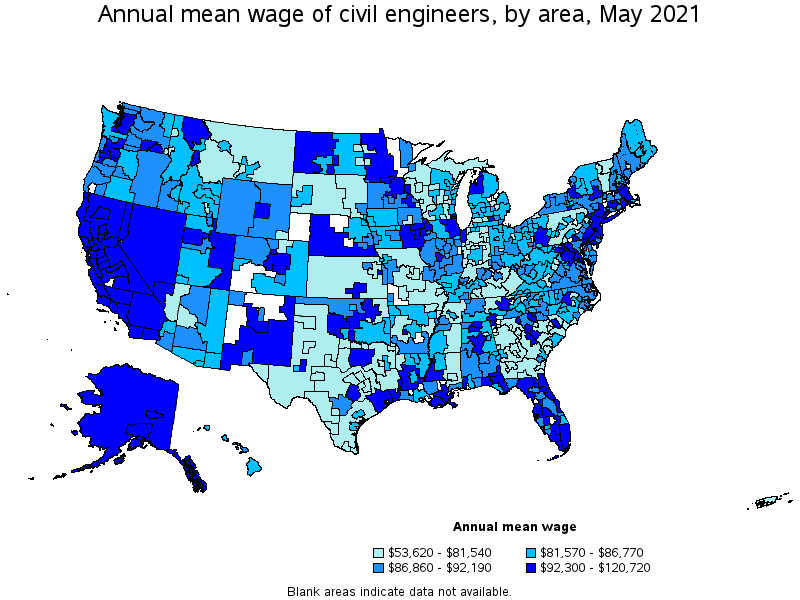
Top paying metropolitan areas for Civil Engineers:
| Metropolitan area | Employment (1) | Employment per thousand jobs | Location quotient (9) | Hourly mean wage | Annual mean wage (2) |
|---|---|---|---|---|---|
| San Jose-Sunnyvale-Santa Clara, CA | 2,900 | 2.71 | 1.26 | $ 57.56 | $ 119,720 |
| San Francisco-Oakland-Hayward, CA | 9,710 | 4.33 | 2.00 | $ 56.04 | $ 116,550 |
| Sacramento--Roseville--Arden-Arcade, CA | 5,090 | 5.18 | 2.40 | $ 55.34 | $ 115,120 |
| Redding, CA | 290 | 4.53 | 2.10 | $ 54.71 | $ 113,800 |
| Modesto, CA | 220 | 1.20 | 0.56 | $ 54.17 | $ 112,670 |
| Houma-Thibodaux, LA | 40 | 0.55 | 0.25 | $ 53.35 | $ 110,970 |
| The Villages, FL | 50 | 1.43 | 0.66 | $ 53.07 | $ 110,380 |
| Santa Rosa, CA | 490 | 2.56 | 1.19 | $ 52.97 | $ 110,170 |
| Fresno, CA | 900 | 2.40 | 1.11 | $ 52.39 | $ 108,970 |
| Anchorage, AK | 1,020 | 6.32 | 2.93 | $ 52.31 | $ 108,800 |
Nonmetropolitan areas with the highest employment in Civil Engineers:
| Nonmetropolitan area | Employment (1) | Employment per thousand jobs | Location quotient (9) | Hourly mean wage | Annual mean wage (2) |
|---|---|---|---|---|---|
| Southwest Montana nonmetropolitan area | 640 | 4.63 | 2.14 | $ 34.48 | $ 71,720 |
| Southwest Mississippi nonmetropolitan area | 450 | 6.49 | 3.00 | $ 47.62 | $ 99,050 |
| Southwest Maine nonmetropolitan area | 420 | 2.31 | 1.07 | $ 42.73 | $ 88,880 |
| Kansas nonmetropolitan area | 400 | 1.06 | 0.49 | $ 36.45 | $ 75,810 |
| Central Kentucky nonmetropolitan area | 350 | 2.05 | 0.95 | $ 38.01 | $ 79,060 |
Nonmetropolitan areas with the highest concentration of jobs and location quotients in Civil Engineers:
| Nonmetropolitan area | Employment (1) | Employment per thousand jobs | Location quotient (9) | Hourly mean wage | Annual mean wage (2) |
|---|---|---|---|---|---|
| Southwest Mississippi nonmetropolitan area | 450 | 6.49 | 3.00 | $ 47.62 | $ 99,050 |
| West South Dakota nonmetropolitan area | 320 | 5.30 | 2.46 | $ 36.39 | $ 75,700 |
| Southwest Montana nonmetropolitan area | 640 | 4.63 | 2.14 | $ 34.48 | $ 71,720 |
| Northern Vermont nonmetropolitan area | 260 | 3.96 | 1.83 | $ 36.68 | $ 76,300 |
| Central New Hampshire nonmetropolitan area | 330 | 3.76 | 1.74 | $ 40.86 | $ 84,980 |
Top paying nonmetropolitan areas for Civil Engineers:
| Nonmetropolitan area | Employment (1) | Employment per thousand jobs | Location quotient (9) | Hourly mean wage | Annual mean wage (2) |
|---|---|---|---|---|---|
| Nevada nonmetropolitan area | 190 | 2.01 | 0.93 | $ 58.04 | $ 120,720 |
| Alaska nonmetropolitan area | 270 | 2.75 | 1.27 | $ 49.10 | $ 102,130 |
| Eastern Sierra-Mother Lode Region of California nonmetropolitan area | 140 | 2.50 | 1.16 | $ 48.52 | $ 100,920 |
| North Coast Region of California nonmetropolitan area | 320 | 3.24 | 1.50 | $ 48.50 | $ 100,890 |
| Southwest Mississippi nonmetropolitan area | 450 | 6.49 | 3.00 | $ 47.62 | $ 99,050 |
These estimates are calculated with data collected from employers in all industry sectors, all metropolitan and nonmetropolitan areas, and all states and the District of Columbia. The top employment and wage figures are provided above. The complete list is available in the downloadable XLS files.
The percentile wage estimate is the value of a wage below which a certain percent of workers fall. The median wage is the 50th percentile wage estimate—50 percent of workers earn less than the median and 50 percent of workers earn more than the median. More about percentile wages.
(1) Estimates for detailed occupations do not sum to the totals because the totals include occupations not shown separately. Estimates do not include self-employed workers.
(2) Annual wages have been calculated by multiplying the hourly mean wage by a "year-round, full-time" hours figure of 2,080 hours; for those occupations where there is not an hourly wage published, the annual wage has been directly calculated from the reported survey data.
(3) The relative standard error (RSE) is a measure of the reliability of a survey statistic. The smaller the relative standard error, the more precise the estimate.
(8) Estimate not released.
(9) The location quotient is the ratio of the area concentration of occupational employment to the national average concentration. A location quotient greater than one indicates the occupation has a higher share of employment than average, and a location quotient less than one indicates the occupation is less prevalent in the area than average.
Other OEWS estimates and related information:
May 2021 National Occupational Employment and Wage Estimates
May 2021 State Occupational Employment and Wage Estimates
May 2021 Metropolitan and Nonmetropolitan Area Occupational Employment and Wage Estimates
May 2021 National Industry-Specific Occupational Employment and Wage Estimates
Last Modified Date: March 31, 2022