
An official website of the United States government
An official website of the United States government
The .gov means it's official.
Federal government websites often end in .gov or .mil. Before sharing sensitive information,
make sure you're on a federal government site.
The site is secure.
The
https:// ensures that you are connecting to the official website and that any
information you provide is encrypted and transmitted securely.
Design, develop, test, and evaluate integrated systems for managing industrial production processes, including human work factors, quality control, inventory control, logistics and material flow, cost analysis, and production coordination. Excludes �Health and Safety Engineers, Except Mining Safety Engineers and Inspectors� (17-2111).
Employment estimate and mean wage estimates for Industrial Engineers:
| Employment (1) | Employment RSE (3) |
Mean hourly wage |
Mean annual wage (2) |
Wage RSE (3) |
|---|---|---|---|---|
| 293,950 | 0.9 % | $ 45.77 | $ 95,200 | 0.4 % |
Percentile wage estimates for Industrial Engineers:
| Percentile | 10% | 25% | 50% (Median) |
75% | 90% |
|---|---|---|---|---|---|
| Hourly Wage | $ 29.26 | $ 36.85 | $ 45.82 | $ 50.74 | $ 62.32 |
| Annual Wage (2) | $ 60,850 | $ 76,650 | $ 95,300 | $ 105,530 | $ 129,620 |
Industries with the highest published employment and wages for Industrial Engineers are provided. For a list of all industries with employment in Industrial Engineers, see the Create Customized Tables function.
Industries with the highest levels of employment in Industrial Engineers:
| Industry | Employment (1) | Percent of industry employment | Hourly mean wage | Annual mean wage (2) |
|---|---|---|---|---|
| Aerospace Product and Parts Manufacturing | 23,290 | 4.96 | $ 50.98 | $ 106,040 |
| Architectural, Engineering, and Related Services | 19,710 | 1.30 | $ 47.77 | $ 99,360 |
| Machinery Manufacturing (3331, 3332, 3334, and 3339 only) | 17,540 | 2.50 | $ 42.48 | $ 88,350 |
| Motor Vehicle Parts Manufacturing | 16,160 | 3.00 | $ 41.78 | $ 86,910 |
| Navigational, Measuring, Electromedical, and Control Instruments Manufacturing | 15,430 | 3.86 | $ 49.91 | $ 103,820 |
Industries with the highest concentration of employment in Industrial Engineers:
| Industry | Employment (1) | Percent of industry employment | Hourly mean wage | Annual mean wage (2) |
|---|---|---|---|---|
| Aerospace Product and Parts Manufacturing | 23,290 | 4.96 | $ 50.98 | $ 106,040 |
| Engine, Turbine, and Power Transmission Equipment Manufacturing | 4,230 | 4.77 | $ 46.36 | $ 96,420 |
| Semiconductor and Other Electronic Component Manufacturing | 14,790 | 4.14 | $ 48.39 | $ 100,640 |
| Navigational, Measuring, Electromedical, and Control Instruments Manufacturing | 15,430 | 3.86 | $ 49.91 | $ 103,820 |
| Medical Equipment and Supplies Manufacturing | 11,420 | 3.59 | $ 44.76 | $ 93,110 |
Top paying industries for Industrial Engineers:
| Industry | Employment (1) | Percent of industry employment | Hourly mean wage | Annual mean wage (2) |
|---|---|---|---|---|
| Pipeline Transportation of Crude Oil | 30 | 0.30 | $ 89.93 | $ 187,050 |
| Securities, Commodity Contracts, and Other Financial Investments and Related Activities | (8) | (8) | $ 71.64 | $ 149,010 |
| Oil and Gas Extraction | 690 | 0.65 | $ 68.30 | $ 142,060 |
| Other Pipeline Transportation | 70 | 0.81 | $ 60.12 | $ 125,050 |
| Other Information Services | 170 | 0.05 | $ 58.89 | $ 122,480 |
States and areas with the highest published employment, location quotients, and wages for Industrial Engineers are provided. For a list of all areas with employment in Industrial Engineers, see the Create Customized Tables function.
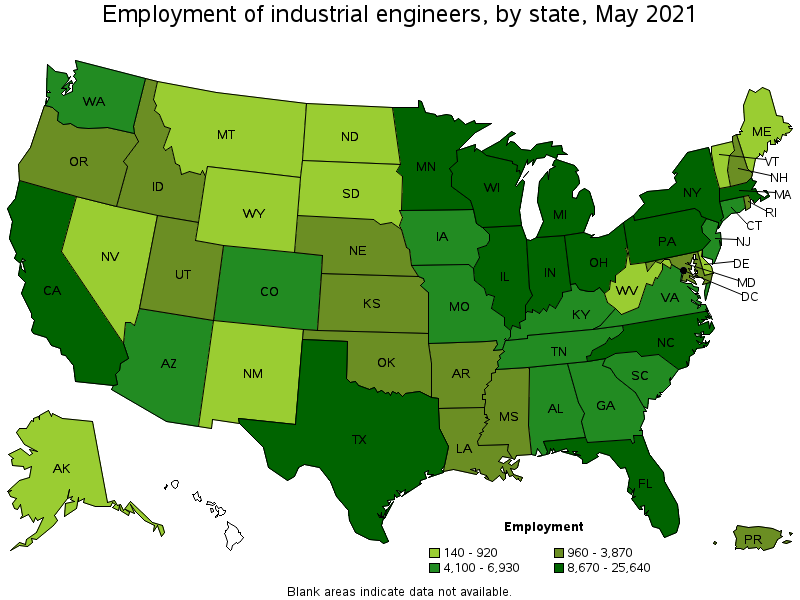
States with the highest employment level in Industrial Engineers:
| State | Employment (1) | Employment per thousand jobs | Location quotient (9) | Hourly mean wage | Annual mean wage (2) |
|---|---|---|---|---|---|
| Michigan | 25,640 | 6.32 | 3.03 | $ 42.93 | $ 89,290 |
| Texas | 21,970 | 1.80 | 0.86 | $ 48.61 | $ 101,120 |
| California | 21,150 | 1.28 | 0.61 | $ 52.63 | $ 109,460 |
| Ohio | 15,320 | 2.94 | 1.41 | $ 42.70 | $ 88,820 |
| Minnesota | 12,660 | 4.63 | 2.22 | $ 46.97 | $ 97,700 |
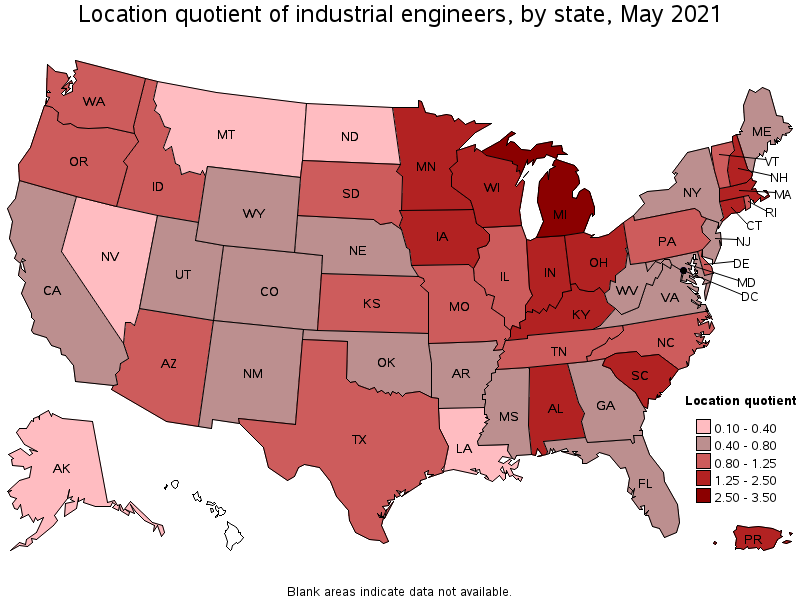
States with the highest concentration of jobs and location quotients in Industrial Engineers:
| State | Employment (1) | Employment per thousand jobs | Location quotient (9) | Hourly mean wage | Annual mean wage (2) |
|---|---|---|---|---|---|
| Michigan | 25,640 | 6.32 | 3.03 | $ 42.93 | $ 89,290 |
| Minnesota | 12,660 | 4.63 | 2.22 | $ 46.97 | $ 97,700 |
| Wisconsin | 11,880 | 4.31 | 2.07 | $ 39.26 | $ 81,660 |
| Indiana | 12,250 | 4.11 | 1.97 | $ 41.42 | $ 86,160 |
| Connecticut | 6,080 | 3.86 | 1.85 | $ 46.97 | $ 97,700 |
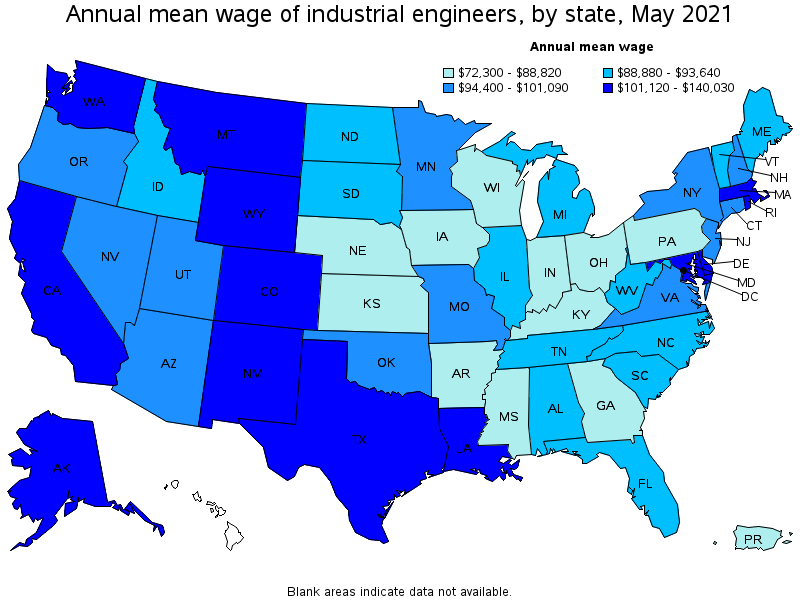
Top paying states for Industrial Engineers:
| State | Employment (1) | Employment per thousand jobs | Location quotient (9) | Hourly mean wage | Annual mean wage (2) |
|---|---|---|---|---|---|
| Alaska | 190 | 0.64 | 0.31 | $ 67.32 | $ 140,030 |
| Washington | 6,630 | 2.07 | 0.99 | $ 54.15 | $ 112,630 |
| California | 21,150 | 1.28 | 0.61 | $ 52.63 | $ 109,460 |
| Louisiana | 1,380 | 0.77 | 0.37 | $ 52.38 | $ 108,940 |
| New Mexico | 680 | 0.87 | 0.42 | $ 52.28 | $ 108,740 |
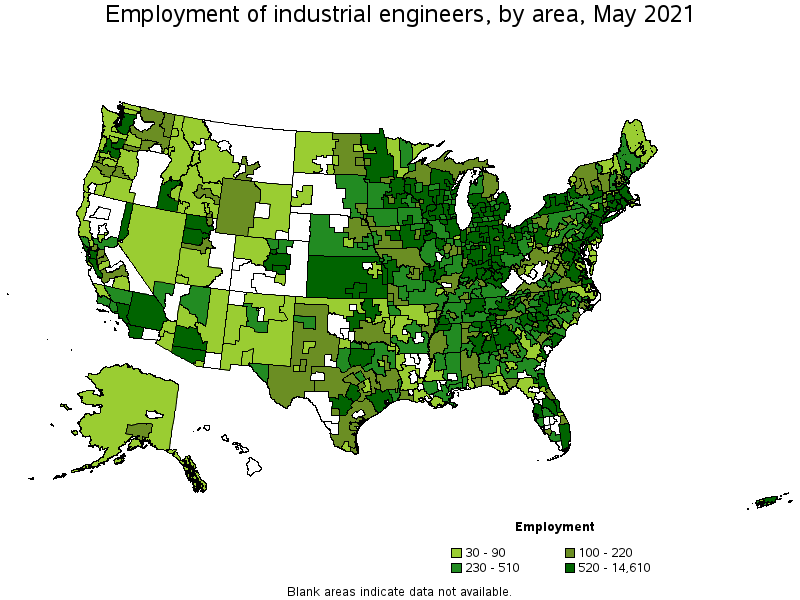
Metropolitan areas with the highest employment level in Industrial Engineers:
| Metropolitan area | Employment (1) | Employment per thousand jobs | Location quotient (9) | Hourly mean wage | Annual mean wage (2) |
|---|---|---|---|---|---|
| Detroit-Warren-Dearborn, MI | 14,610 | 8.11 | 3.89 | $ 43.94 | $ 91,390 |
| Boston-Cambridge-Nashua, MA-NH | 10,950 | 4.24 | 2.03 | $ 52.89 | $ 110,020 |
| Minneapolis-St. Paul-Bloomington, MN-WI | 9,840 | 5.40 | 2.59 | $ 48.46 | $ 100,790 |
| Chicago-Naperville-Elgin, IL-IN-WI | 9,140 | 2.16 | 1.03 | $ 45.16 | $ 93,940 |
| Dallas-Fort Worth-Arlington, TX | 8,170 | 2.28 | 1.09 | $ 47.81 | $ 99,440 |
| Los Angeles-Long Beach-Anaheim, CA | 7,840 | 1.37 | 0.66 | $ 52.02 | $ 108,200 |
| New York-Newark-Jersey City, NY-NJ-PA | 7,690 | 0.89 | 0.42 | $ 49.90 | $ 103,790 |
| Houston-The Woodlands-Sugar Land, TX | 6,470 | 2.23 | 1.07 | $ 51.98 | $ 108,120 |
| Seattle-Tacoma-Bellevue, WA | 5,410 | 2.82 | 1.35 | $ 56.24 | $ 116,970 |
| Phoenix-Mesa-Scottsdale, AZ | 4,830 | 2.28 | 1.09 | $ 49.36 | $ 102,670 |
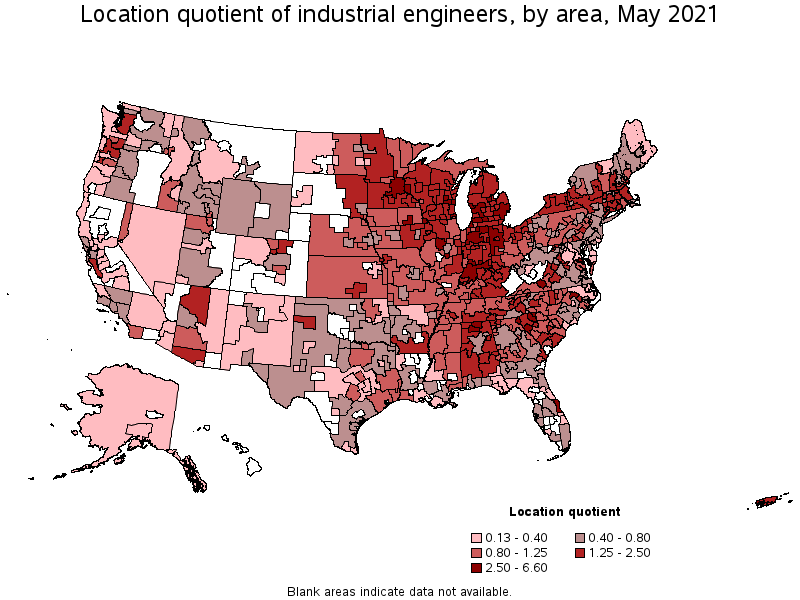
Metropolitan areas with the highest concentration of jobs and location quotients in Industrial Engineers:
| Metropolitan area | Employment (1) | Employment per thousand jobs | Location quotient (9) | Hourly mean wage | Annual mean wage (2) |
|---|---|---|---|---|---|
| Columbus, IN | 660 | 13.77 | 6.60 | $ 45.03 | $ 93,670 |
| Waterloo-Cedar Falls, IA | 920 | 11.03 | 5.28 | $ 43.11 | $ 89,670 |
| Rocky Mount, NC | 490 | 9.30 | 4.46 | $ 42.29 | $ 87,970 |
| Decatur, AL | 500 | 8.94 | 4.29 | $ 49.03 | $ 101,970 |
| Fond du Lac, WI | 390 | 8.77 | 4.20 | $ 41.51 | $ 86,330 |
| Detroit-Warren-Dearborn, MI | 14,610 | 8.11 | 3.89 | $ 43.94 | $ 91,390 |
| Sheboygan, WI | 450 | 7.85 | 3.76 | $ 37.95 | $ 78,930 |
| Bloomington, IN | 530 | 7.76 | 3.72 | $ 43.33 | $ 90,120 |
| Huntsville, AL | 1,770 | 7.70 | 3.69 | $ 48.92 | $ 101,760 |
| Elkhart-Goshen, IN | 960 | 7.17 | 3.44 | $ 35.93 | $ 74,740 |
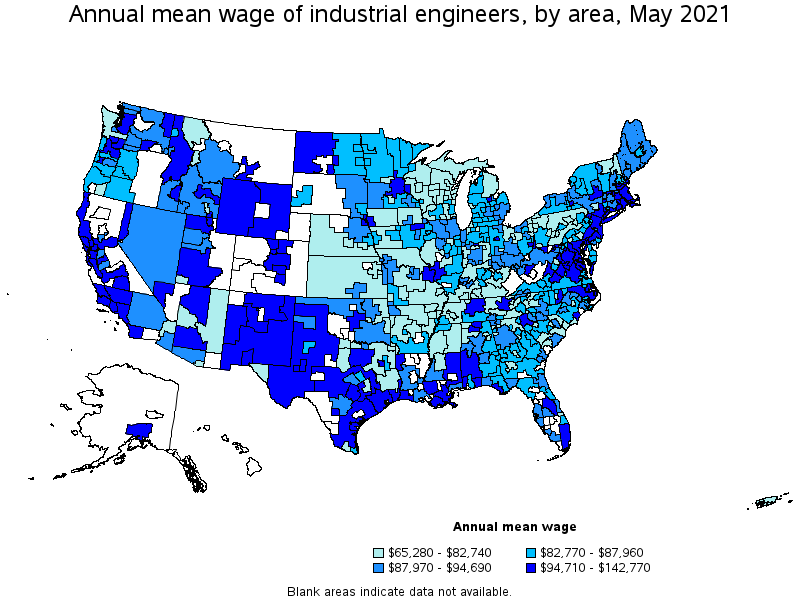
Top paying metropolitan areas for Industrial Engineers:
| Metropolitan area | Employment (1) | Employment per thousand jobs | Location quotient (9) | Hourly mean wage | Annual mean wage (2) |
|---|---|---|---|---|---|
| Anchorage, AK | 100 | 0.63 | 0.30 | $ 68.64 | $ 142,770 |
| Midland, TX | 100 | 1.08 | 0.52 | $ 62.23 | $ 129,440 |
| Billings, MT | 110 | 1.29 | 0.62 | $ 60.66 | $ 126,170 |
| California-Lexington Park, MD | 250 | 5.33 | 2.55 | $ 59.18 | $ 123,090 |
| San Jose-Sunnyvale-Santa Clara, CA | 3,650 | 3.42 | 1.64 | $ 58.93 | $ 122,580 |
| Odessa, TX | 40 | 0.59 | 0.28 | $ 57.23 | $ 119,040 |
| Lake Charles, LA | 150 | 1.69 | 0.81 | $ 56.77 | $ 118,080 |
| Houma-Thibodaux, LA | 60 | 0.79 | 0.38 | $ 56.46 | $ 117,440 |
| Seattle-Tacoma-Bellevue, WA | 5,410 | 2.82 | 1.35 | $ 56.24 | $ 116,970 |
| Baton Rouge, LA | 420 | 1.16 | 0.55 | $ 56.05 | $ 116,590 |
Nonmetropolitan areas with the highest employment in Industrial Engineers:
| Nonmetropolitan area | Employment (1) | Employment per thousand jobs | Location quotient (9) | Hourly mean wage | Annual mean wage (2) |
|---|---|---|---|---|---|
| Northern Indiana nonmetropolitan area | 2,000 | 9.78 | 4.69 | $ 40.45 | $ 84,140 |
| West Northwestern Ohio nonmetropolitan area | 1,640 | 6.85 | 3.28 | $ 41.26 | $ 85,810 |
| Balance of Lower Peninsula of Michigan nonmetropolitan area | 1,230 | 4.87 | 2.33 | $ 40.05 | $ 83,300 |
| North Northeastern Ohio nonmetropolitan area (noncontiguous) | 1,180 | 3.75 | 1.80 | $ 39.72 | $ 82,620 |
| Southern Indiana nonmetropolitan area | 1,050 | 5.72 | 2.74 | $ 36.81 | $ 76,550 |
Nonmetropolitan areas with the highest concentration of jobs and location quotients in Industrial Engineers:
| Nonmetropolitan area | Employment (1) | Employment per thousand jobs | Location quotient (9) | Hourly mean wage | Annual mean wage (2) |
|---|---|---|---|---|---|
| Northern Indiana nonmetropolitan area | 2,000 | 9.78 | 4.69 | $ 40.45 | $ 84,140 |
| West Northwestern Ohio nonmetropolitan area | 1,640 | 6.85 | 3.28 | $ 41.26 | $ 85,810 |
| Southern Indiana nonmetropolitan area | 1,050 | 5.72 | 2.74 | $ 36.81 | $ 76,550 |
| Upper Savannah South Carolina nonmetropolitan area | 410 | 5.27 | 2.53 | $ 41.08 | $ 85,450 |
| Southeast Minnesota nonmetropolitan area | 730 | 4.94 | 2.37 | $ 41.55 | $ 86,430 |
Top paying nonmetropolitan areas for Industrial Engineers:
| Nonmetropolitan area | Employment (1) | Employment per thousand jobs | Location quotient (9) | Hourly mean wage | Annual mean wage (2) |
|---|---|---|---|---|---|
| Northern New Mexico nonmetropolitan area | 40 | 0.46 | 0.22 | $ 54.24 | $ 112,810 |
| Western Wyoming nonmetropolitan area | 120 | 1.25 | 0.60 | $ 54.01 | $ 112,340 |
| Coastal Plains Region of Texas nonmetropolitan area | 210 | 1.51 | 0.73 | $ 51.20 | $ 106,490 |
| Eastern Wyoming nonmetropolitan area | 70 | 0.86 | 0.41 | $ 51.17 | $ 106,420 |
| Eastern New Mexico nonmetropolitan area | 70 | 0.51 | 0.25 | $ 51.00 | $ 106,090 |
These estimates are calculated with data collected from employers in all industry sectors, all metropolitan and nonmetropolitan areas, and all states and the District of Columbia. The top employment and wage figures are provided above. The complete list is available in the downloadable XLS files.
The percentile wage estimate is the value of a wage below which a certain percent of workers fall. The median wage is the 50th percentile wage estimate—50 percent of workers earn less than the median and 50 percent of workers earn more than the median. More about percentile wages.
(1) Estimates for detailed occupations do not sum to the totals because the totals include occupations not shown separately. Estimates do not include self-employed workers.
(2) Annual wages have been calculated by multiplying the hourly mean wage by a "year-round, full-time" hours figure of 2,080 hours; for those occupations where there is not an hourly wage published, the annual wage has been directly calculated from the reported survey data.
(3) The relative standard error (RSE) is a measure of the reliability of a survey statistic. The smaller the relative standard error, the more precise the estimate.
(8) Estimate not released.
(9) The location quotient is the ratio of the area concentration of occupational employment to the national average concentration. A location quotient greater than one indicates the occupation has a higher share of employment than average, and a location quotient less than one indicates the occupation is less prevalent in the area than average.
Other OEWS estimates and related information:
May 2021 National Occupational Employment and Wage Estimates
May 2021 State Occupational Employment and Wage Estimates
May 2021 Metropolitan and Nonmetropolitan Area Occupational Employment and Wage Estimates
May 2021 National Industry-Specific Occupational Employment and Wage Estimates
Last Modified Date: March 31, 2022