
An official website of the United States government
An official website of the United States government
The .gov means it's official.
Federal government websites often end in .gov or .mil. Before sharing sensitive information,
make sure you're on a federal government site.
The site is secure.
The
https:// ensures that you are connecting to the official website and that any
information you provide is encrypted and transmitted securely.
Evaluate materials and develop machinery and processes to manufacture materials for use in products that must meet specialized design and performance specifications. Develop new uses for known materials. Includes those engineers working with composite materials or specializing in one type of material, such as graphite, metal and metal alloys, ceramics and glass, plastics and polymers, and naturally occurring materials. Includes metallurgists and metallurgical engineers, ceramic engineers, and welding engineers.
Employment estimate and mean wage estimates for Materials Engineers:
| Employment (1) | Employment RSE (3) |
Mean hourly wage |
Mean annual wage (2) |
Wage RSE (3) |
|---|---|---|---|---|
| 21,530 | 2.7 % | $ 49.02 | $ 101,950 | 0.8 % |
Percentile wage estimates for Materials Engineers:
| Percentile | 10% | 25% | 50% (Median) |
75% | 90% |
|---|---|---|---|---|---|
| Hourly Wage | $ 29.12 | $ 36.85 | $ 47.26 | $ 61.11 | $ 77.44 |
| Annual Wage (2) | $ 60,580 | $ 76,650 | $ 98,300 | $ 127,110 | $ 161,080 |
Industries with the highest published employment and wages for Materials Engineers are provided. For a list of all industries with employment in Materials Engineers, see the Create Customized Tables function.
Industries with the highest levels of employment in Materials Engineers:
| Industry | Employment (1) | Percent of industry employment | Hourly mean wage | Annual mean wage (2) |
|---|---|---|---|---|
| Architectural, Engineering, and Related Services | 3,200 | 0.21 | $ 46.05 | $ 95,780 |
| Aerospace Product and Parts Manufacturing | 2,420 | 0.52 | $ 57.99 | $ 120,620 |
| Scientific Research and Development Services | 1,450 | 0.18 | $ 55.77 | $ 116,000 |
| Federal Executive Branch (OEWS Designation) | 1,450 | 0.07 | $ 59.17 | $ 123,070 |
| Management of Companies and Enterprises | 1,240 | 0.05 | $ 50.41 | $ 104,850 |
Industries with the highest concentration of employment in Materials Engineers:
| Industry | Employment (1) | Percent of industry employment | Hourly mean wage | Annual mean wage (2) |
|---|---|---|---|---|
| Pipeline Transportation of Crude Oil | 190 | 1.67 | $ 80.82 | $ 168,110 |
| Iron and Steel Mills and Ferroalloy Manufacturing | 520 | 0.66 | $ 45.19 | $ 93,990 |
| Metal Ore Mining | 240 | 0.58 | $ 40.82 | $ 84,900 |
| Aerospace Product and Parts Manufacturing | 2,420 | 0.52 | $ 57.99 | $ 120,620 |
| Alumina and Aluminum Production and Processing | 250 | 0.45 | $ 43.75 | $ 91,000 |
Top paying industries for Materials Engineers:
| Industry | Employment (1) | Percent of industry employment | Hourly mean wage | Annual mean wage (2) |
|---|---|---|---|---|
| Pipeline Transportation of Crude Oil | 190 | 1.67 | $ 80.82 | $ 168,110 |
| Oil and Gas Extraction | 50 | 0.05 | $ 67.76 | $ 140,930 |
| Federal Executive Branch (OEWS Designation) | 1,450 | 0.07 | $ 59.17 | $ 123,070 |
| Natural Gas Distribution | 70 | 0.07 | $ 58.95 | $ 122,610 |
| Semiconductor and Other Electronic Component Manufacturing | 830 | 0.23 | $ 58.01 | $ 120,670 |
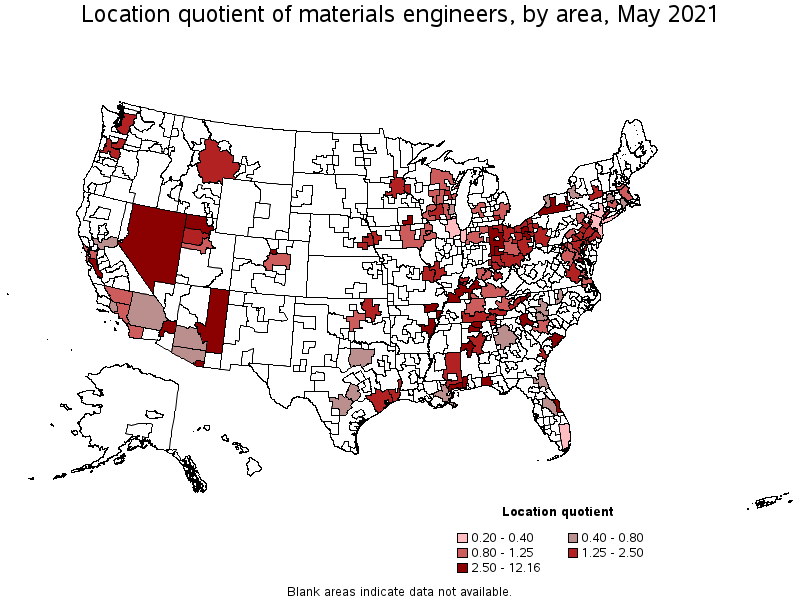
States and areas with the highest published employment, location quotients, and wages for Materials Engineers are provided. For a list of all areas with employment in Materials Engineers, see the Create Customized Tables function.
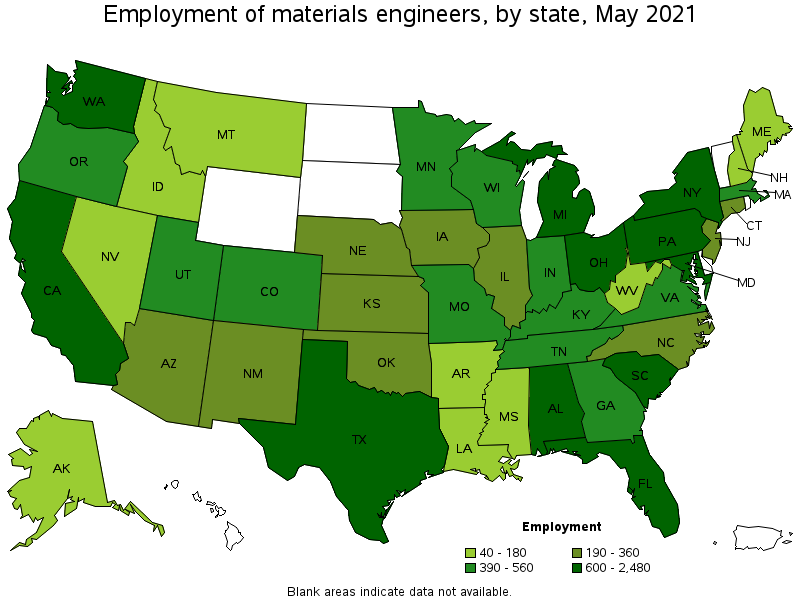
States with the highest employment level in Materials Engineers:
| State | Employment (1) | Employment per thousand jobs | Location quotient (9) | Hourly mean wage | Annual mean wage (2) |
|---|---|---|---|---|---|
| California | 2,480 | 0.15 | 0.98 | $ 54.21 | $ 112,760 |
| Ohio | 1,850 | 0.36 | 2.32 | $ 45.42 | $ 94,470 |
| Texas | 1,420 | 0.12 | 0.76 | $ 55.25 | $ 114,930 |
| Pennsylvania | 1,170 | 0.21 | 1.37 | $ 48.03 | $ 99,890 |
| Florida | 1,060 | 0.12 | 0.80 | $ 44.41 | $ 92,360 |
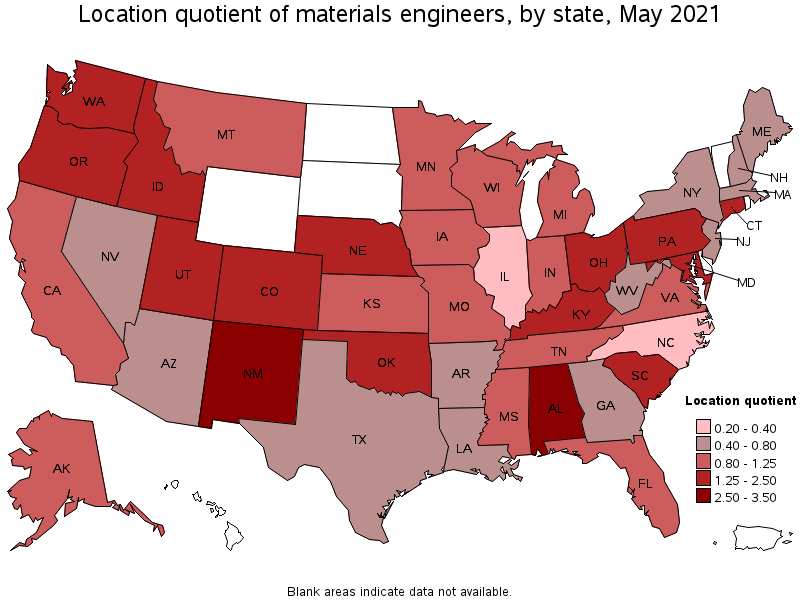
States with the highest concentration of jobs and location quotients in Materials Engineers:
| State | Employment (1) | Employment per thousand jobs | Location quotient (9) | Hourly mean wage | Annual mean wage (2) |
|---|---|---|---|---|---|
| New Mexico | 360 | 0.46 | 3.03 | (8) | (8) |
| Alabama | 800 | 0.42 | 2.73 | $ 46.68 | $ 97,100 |
| Ohio | 1,850 | 0.36 | 2.32 | $ 45.42 | $ 94,470 |
| Maryland | 900 | 0.35 | 2.31 | $ 55.50 | $ 115,430 |
| South Carolina | 730 | 0.35 | 2.30 | $ 40.42 | $ 84,070 |
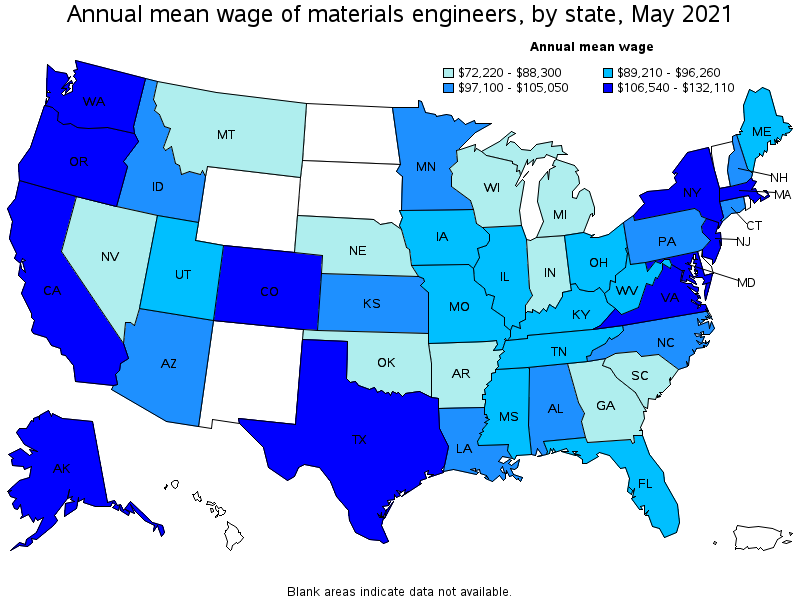
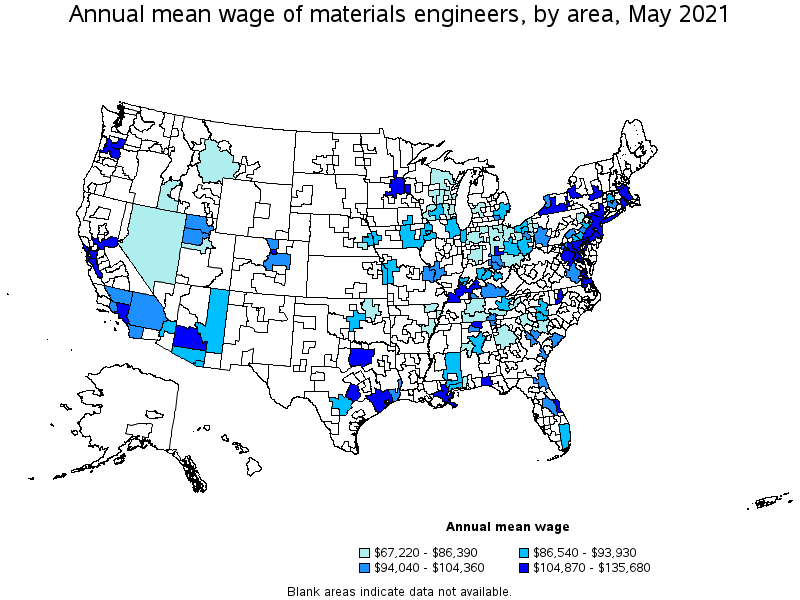
Top paying states for Materials Engineers:
| State | Employment (1) | Employment per thousand jobs | Location quotient (9) | Hourly mean wage | Annual mean wage (2) |
|---|---|---|---|---|---|
| Washington | 750 | 0.23 | 1.52 | $ 63.51 | $ 132,110 |
| Alaska | 50 | 0.17 | 1.10 | $ 58.74 | $ 122,170 |
| Maryland | 900 | 0.35 | 2.31 | $ 55.50 | $ 115,430 |
| Texas | 1,420 | 0.12 | 0.76 | $ 55.25 | $ 114,930 |
| California | 2,480 | 0.15 | 0.98 | $ 54.21 | $ 112,760 |
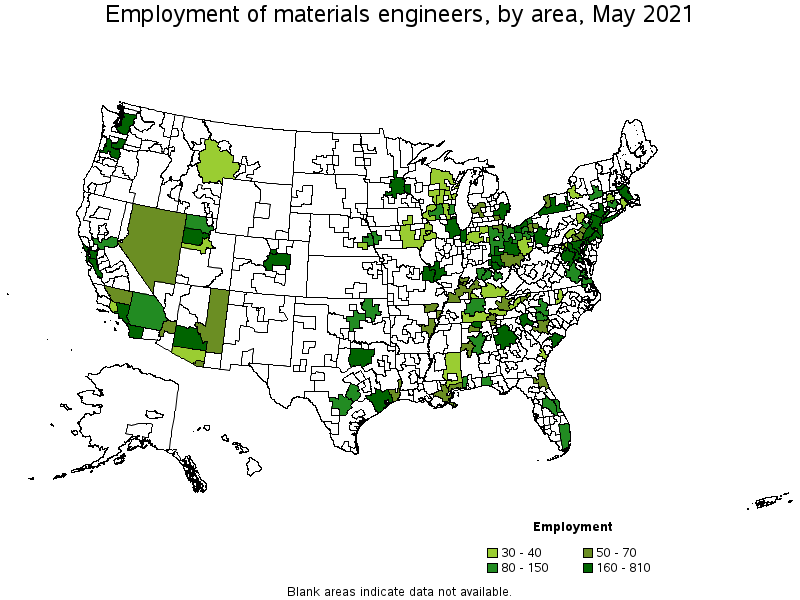
Metropolitan areas with the highest employment level in Materials Engineers:
| Metropolitan area | Employment (1) | Employment per thousand jobs | Location quotient (9) | Hourly mean wage | Annual mean wage (2) |
|---|---|---|---|---|---|
| Los Angeles-Long Beach-Anaheim, CA | 810 | 0.14 | 0.93 | $ 51.04 | $ 106,160 |
| Seattle-Tacoma-Bellevue, WA | 690 | 0.36 | 2.34 | (8) | (8) |
| Houston-The Woodlands-Sugar Land, TX | 610 | 0.21 | 1.37 | $ 61.57 | $ 128,070 |
| Philadelphia-Camden-Wilmington, PA-NJ-DE-MD | 570 | 0.22 | 1.41 | $ 52.85 | $ 109,930 |
| San Jose-Sunnyvale-Santa Clara, CA | 560 | 0.52 | 3.40 | $ 64.77 | $ 134,720 |
| Washington-Arlington-Alexandria, DC-VA-MD-WV | 520 | 0.18 | 1.17 | $ 62.21 | $ 129,400 |
| Dallas-Fort Worth-Arlington, TX | 380 | 0.11 | 0.70 | $ 52.59 | $ 109,400 |
| Minneapolis-St. Paul-Bloomington, MN-WI | 370 | 0.20 | 1.31 | $ 51.10 | $ 106,290 |
| Cincinnati, OH-KY-IN | 360 | 0.35 | 2.27 | $ 47.53 | $ 98,870 |
| New York-Newark-Jersey City, NY-NJ-PA | 350 | 0.04 | 0.27 | $ 57.14 | $ 118,860 |
Metropolitan areas with the highest concentration of jobs and location quotients in Materials Engineers:
| Metropolitan area | Employment (1) | Employment per thousand jobs | Location quotient (9) | Hourly mean wage | Annual mean wage (2) |
|---|---|---|---|---|---|
| California-Lexington Park, MD | 90 | 1.86 | 12.16 | $ 55.35 | $ 115,130 |
| Huntsville, AL | 340 | 1.48 | 9.68 | $ 53.24 | $ 110,740 |
| Decatur, AL | 60 | 1.01 | 6.64 | $ 49.22 | $ 102,380 |
| Boulder, CO | 160 | 0.86 | 5.65 | $ 65.23 | $ 135,680 |
| Crestview-Fort Walton Beach-Destin, FL | 100 | 0.85 | 5.54 | $ 50.42 | $ 104,870 |
| Dayton, OH | 300 | 0.83 | 5.45 | $ 55.83 | $ 116,130 |
| Johnson City, TN | 60 | 0.77 | 5.06 | (8) | (8) |
| Charleston-North Charleston, SC | 200 | 0.58 | 3.78 | $ 46.77 | $ 97,290 |
| Ogden-Clearfield, UT | 150 | 0.57 | 3.73 | $ 45.77 | $ 95,210 |
| Greenville-Anderson-Mauldin, SC | 220 | 0.56 | 3.66 | $ 33.91 | $ 70,530 |
Top paying metropolitan areas for Materials Engineers:
| Metropolitan area | Employment (1) | Employment per thousand jobs | Location quotient (9) | Hourly mean wage | Annual mean wage (2) |
|---|---|---|---|---|---|
| Boulder, CO | 160 | 0.86 | 5.65 | $ 65.23 | $ 135,680 |
| San Jose-Sunnyvale-Santa Clara, CA | 560 | 0.52 | 3.40 | $ 64.77 | $ 134,720 |
| Washington-Arlington-Alexandria, DC-VA-MD-WV | 520 | 0.18 | 1.17 | $ 62.21 | $ 129,400 |
| Houston-The Woodlands-Sugar Land, TX | 610 | 0.21 | 1.37 | $ 61.57 | $ 128,070 |
| Providence-Warwick, RI-MA | 40 | 0.07 | 0.46 | $ 57.55 | $ 119,710 |
| New York-Newark-Jersey City, NY-NJ-PA | 350 | 0.04 | 0.27 | $ 57.14 | $ 118,860 |
| Austin-Round Rock, TX | 80 | 0.07 | 0.49 | $ 55.91 | $ 116,290 |
| Dayton, OH | 300 | 0.83 | 5.45 | $ 55.83 | $ 116,130 |
| California-Lexington Park, MD | 90 | 1.86 | 12.16 | $ 55.35 | $ 115,130 |
| Baltimore-Columbia-Towson, MD | 290 | 0.23 | 1.49 | $ 55.17 | $ 114,750 |
Nonmetropolitan areas with the highest employment in Materials Engineers:
| Nonmetropolitan area | Employment (1) | Employment per thousand jobs | Location quotient (9) | Hourly mean wage | Annual mean wage (2) |
|---|---|---|---|---|---|
| Southwest New York nonmetropolitan area | 180 | 1.06 | 6.93 | $ 50.98 | $ 106,040 |
| West Northwestern Ohio nonmetropolitan area | 140 | 0.59 | 3.85 | $ 40.86 | $ 84,980 |
| North Northeastern Ohio nonmetropolitan area (noncontiguous) | 80 | 0.26 | 1.68 | $ 38.52 | $ 80,120 |
| East Arkansas nonmetropolitan area | 70 | 1.11 | 7.25 | $ 38.43 | $ 79,930 |
| Nevada nonmetropolitan area | 70 | 0.68 | 4.47 | $ 32.32 | $ 67,220 |
Nonmetropolitan areas with the highest concentration of jobs and location quotients in Materials Engineers:
| Nonmetropolitan area | Employment (1) | Employment per thousand jobs | Location quotient (9) | Hourly mean wage | Annual mean wage (2) |
|---|---|---|---|---|---|
| East Arkansas nonmetropolitan area | 70 | 1.11 | 7.25 | $ 38.43 | $ 79,930 |
| Southwest New York nonmetropolitan area | 180 | 1.06 | 6.93 | $ 50.98 | $ 106,040 |
| Nevada nonmetropolitan area | 70 | 0.68 | 4.47 | $ 32.32 | $ 67,220 |
| Arizona nonmetropolitan area | 60 | 0.67 | 4.36 | $ 44.70 | $ 92,980 |
| West Northwestern Ohio nonmetropolitan area | 140 | 0.59 | 3.85 | $ 40.86 | $ 84,980 |
Top paying nonmetropolitan areas for Materials Engineers:
| Nonmetropolitan area | Employment (1) | Employment per thousand jobs | Location quotient (9) | Hourly mean wage | Annual mean wage (2) |
|---|---|---|---|---|---|
| West Kentucky nonmetropolitan area | 60 | 0.42 | 2.73 | $ 55.79 | $ 116,030 |
| Southwest New York nonmetropolitan area | 180 | 1.06 | 6.93 | $ 50.98 | $ 106,040 |
| South Central Kentucky nonmetropolitan area | 30 | 0.18 | 1.20 | $ 47.02 | $ 97,800 |
| Arizona nonmetropolitan area | 60 | 0.67 | 4.36 | $ 44.70 | $ 92,980 |
| Southeast Mississippi nonmetropolitan area | 40 | 0.28 | 1.81 | $ 43.99 | $ 91,500 |
These estimates are calculated with data collected from employers in all industry sectors, all metropolitan and nonmetropolitan areas, and all states and the District of Columbia. The top employment and wage figures are provided above. The complete list is available in the downloadable XLS files.
The percentile wage estimate is the value of a wage below which a certain percent of workers fall. The median wage is the 50th percentile wage estimate—50 percent of workers earn less than the median and 50 percent of workers earn more than the median. More about percentile wages.
(1) Estimates for detailed occupations do not sum to the totals because the totals include occupations not shown separately. Estimates do not include self-employed workers.
(2) Annual wages have been calculated by multiplying the hourly mean wage by a "year-round, full-time" hours figure of 2,080 hours; for those occupations where there is not an hourly wage published, the annual wage has been directly calculated from the reported survey data.
(3) The relative standard error (RSE) is a measure of the reliability of a survey statistic. The smaller the relative standard error, the more precise the estimate.
(8) Estimate not released.
(9) The location quotient is the ratio of the area concentration of occupational employment to the national average concentration. A location quotient greater than one indicates the occupation has a higher share of employment than average, and a location quotient less than one indicates the occupation is less prevalent in the area than average.
Other OEWS estimates and related information:
May 2021 National Occupational Employment and Wage Estimates
May 2021 State Occupational Employment and Wage Estimates
May 2021 Metropolitan and Nonmetropolitan Area Occupational Employment and Wage Estimates
May 2021 National Industry-Specific Occupational Employment and Wage Estimates
Last Modified Date: March 31, 2022