
An official website of the United States government
An official website of the United States government
The .gov means it's official.
Federal government websites often end in .gov or .mil. Before sharing sensitive information,
make sure you're on a federal government site.
The site is secure.
The
https:// ensures that you are connecting to the official website and that any
information you provide is encrypted and transmitted securely.
Apply theory and principles of civil engineering in planning, designing, and overseeing construction and maintenance of structures and facilities under the direction of engineering staff or physical scientists.
Employment estimate and mean wage estimates for Civil Engineering Technologists and Technicians:
| Employment (1) | Employment RSE (3) |
Mean hourly wage |
Mean annual wage (2) |
Wage RSE (3) |
|---|---|---|---|---|
| 64,170 | 1.9 % | $ 27.89 | $ 58,000 | 0.8 % |
Percentile wage estimates for Civil Engineering Technologists and Technicians:
| Percentile | 10% | 25% | 50% (Median) |
75% | 90% |
|---|---|---|---|---|---|
| Hourly Wage | $ 17.57 | $ 20.25 | $ 28.04 | $ 35.23 | $ 38.29 |
| Annual Wage (2) | $ 36,550 | $ 42,110 | $ 58,320 | $ 73,280 | $ 79,650 |
Industries with the highest published employment and wages for Civil Engineering Technologists and Technicians are provided. For a list of all industries with employment in Civil Engineering Technologists and Technicians, see the Create Customized Tables function.
Industries with the highest levels of employment in Civil Engineering Technologists and Technicians:
| Industry | Employment (1) | Percent of industry employment | Hourly mean wage | Annual mean wage (2) |
|---|---|---|---|---|
| Architectural, Engineering, and Related Services | 28,610 | 1.89 | $ 27.57 | $ 57,340 |
| State Government, excluding schools and hospitals (OEWS Designation) | 17,560 | 0.80 | $ 24.22 | $ 50,370 |
| Local Government, excluding schools and hospitals (OEWS Designation) | 12,260 | 0.23 | $ 31.26 | $ 65,020 |
| Nonresidential Building Construction | 580 | 0.08 | $ 28.16 | $ 58,570 |
| Colleges, Universities, and Professional Schools | 450 | 0.02 | $ 25.48 | $ 53,000 |
Industries with the highest concentration of employment in Civil Engineering Technologists and Technicians:
| Industry | Employment (1) | Percent of industry employment | Hourly mean wage | Annual mean wage (2) |
|---|---|---|---|---|
| Architectural, Engineering, and Related Services | 28,610 | 1.89 | $ 27.57 | $ 57,340 |
| Pipeline Transportation of Crude Oil | 200 | 1.78 | $ 67.31 | $ 140,000 |
| State Government, excluding schools and hospitals (OEWS Designation) | 17,560 | 0.80 | $ 24.22 | $ 50,370 |
| Pipeline Transportation of Natural Gas | 140 | 0.45 | $ 31.08 | $ 64,640 |
| Oil and Gas Extraction | 300 | 0.29 | $ 47.87 | $ 99,580 |
Top paying industries for Civil Engineering Technologists and Technicians:
| Industry | Employment (1) | Percent of industry employment | Hourly mean wage | Annual mean wage (2) |
|---|---|---|---|---|
| Pipeline Transportation of Crude Oil | 200 | 1.78 | $ 67.31 | $ 140,000 |
| Oil and Gas Extraction | 300 | 0.29 | $ 47.87 | $ 99,580 |
| Management of Companies and Enterprises | 130 | 0.01 | $ 44.65 | $ 92,870 |
| Water, Sewage and Other Systems | 70 | 0.14 | $ 42.13 | $ 87,620 |
| Federal Executive Branch (OEWS Designation) | 90 | (7) | $ 40.05 | $ 83,300 |
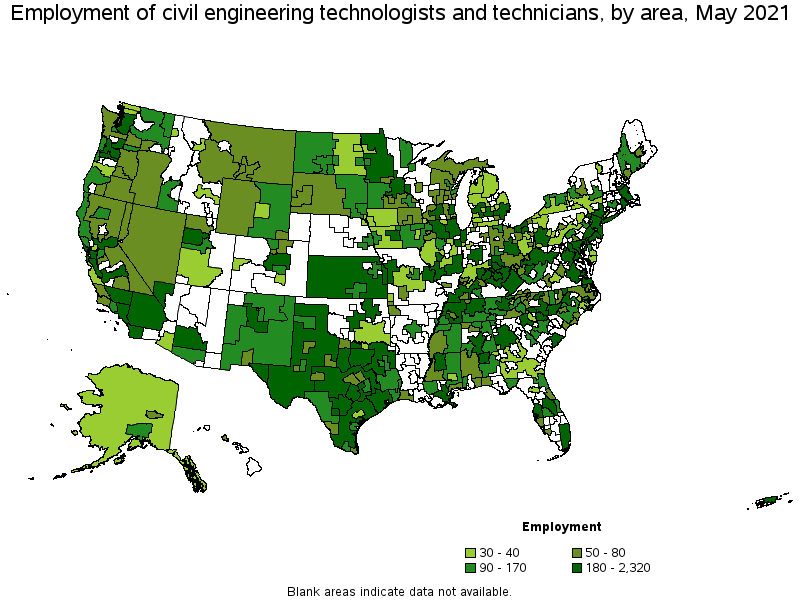
States and areas with the highest published employment, location quotients, and wages for Civil Engineering Technologists and Technicians are provided. For a list of all areas with employment in Civil Engineering Technologists and Technicians, see the Create Customized Tables function.
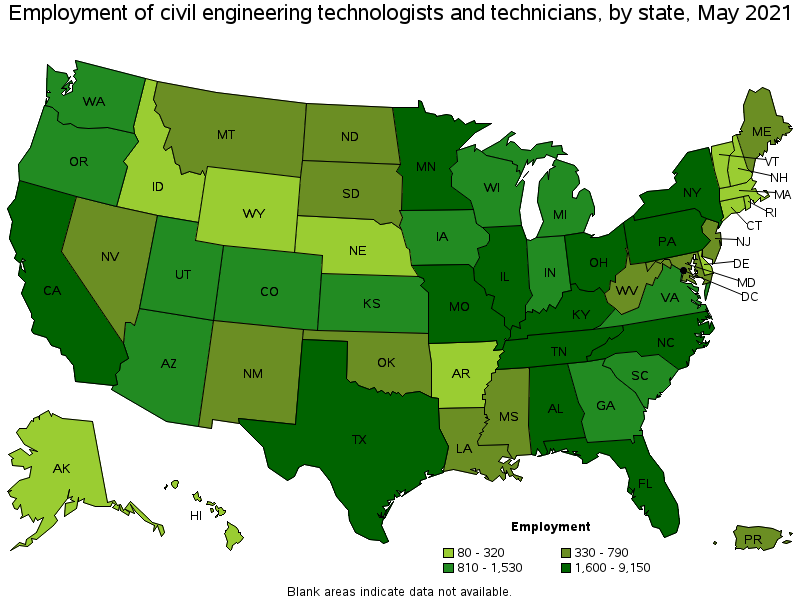
States with the highest employment level in Civil Engineering Technologists and Technicians:
| State | Employment (1) | Employment per thousand jobs | Location quotient (9) | Hourly mean wage | Annual mean wage (2) |
|---|---|---|---|---|---|
| Texas | 9,150 | 0.75 | 1.64 | $ 25.33 | $ 52,690 |
| California | 6,020 | 0.36 | 0.80 | $ 35.59 | $ 74,020 |
| Florida | 3,010 | 0.35 | 0.77 | $ 26.21 | $ 54,510 |
| Illinois | 2,780 | 0.50 | 1.09 | $ 31.24 | $ 64,970 |
| North Carolina | 2,580 | 0.58 | 1.28 | $ 26.58 | $ 55,280 |
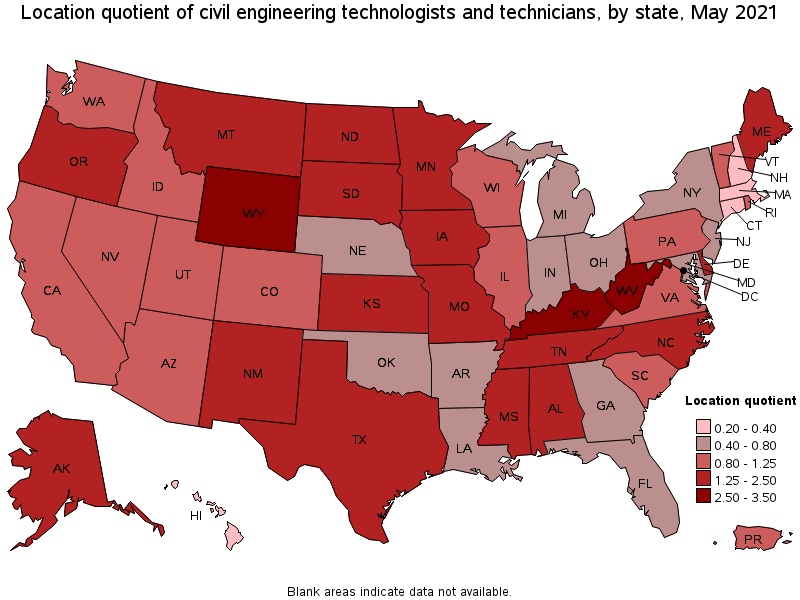
States with the highest concentration of jobs and location quotients in Civil Engineering Technologists and Technicians:
| State | Employment (1) | Employment per thousand jobs | Location quotient (9) | Hourly mean wage | Annual mean wage (2) |
|---|---|---|---|---|---|
| Kentucky | 2,370 | 1.29 | 2.83 | $ 22.59 | $ 46,980 |
| West Virginia | 760 | 1.16 | 2.55 | $ 26.88 | $ 55,910 |
| Wyoming | 300 | 1.15 | 2.52 | $ 23.23 | $ 48,320 |
| North Dakota | 410 | 1.03 | 2.27 | $ 29.82 | $ 62,030 |
| New Mexico | 760 | 0.98 | 2.16 | $ 24.53 | $ 51,020 |
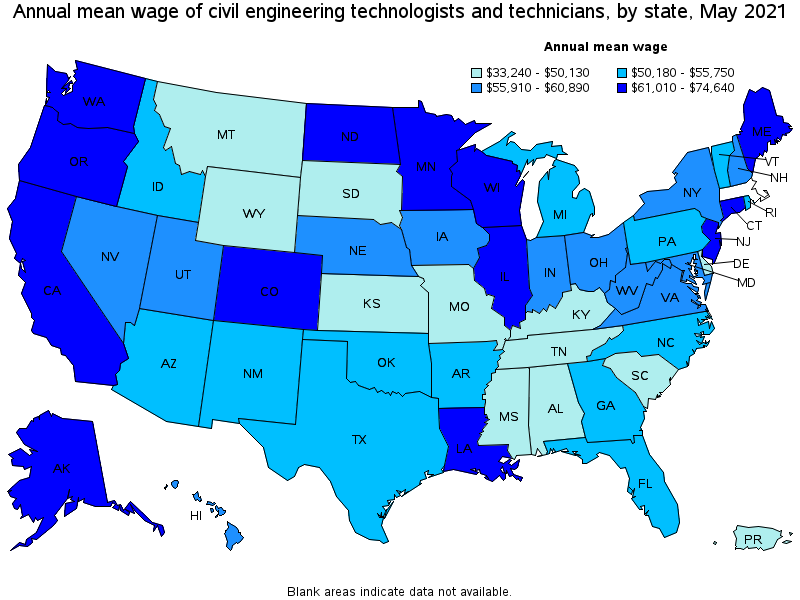
Top paying states for Civil Engineering Technologists and Technicians:
| State | Employment (1) | Employment per thousand jobs | Location quotient (9) | Hourly mean wage | Annual mean wage (2) |
|---|---|---|---|---|---|
| Alaska | 240 | 0.83 | 1.82 | $ 35.89 | $ 74,640 |
| California | 6,020 | 0.36 | 0.80 | $ 35.59 | $ 74,020 |
| Louisiana | 600 | 0.33 | 0.73 | $ 35.47 | $ 73,780 |
| Connecticut | 260 | 0.17 | 0.36 | $ 34.84 | $ 72,460 |
| Oregon | 1,060 | 0.58 | 1.28 | $ 33.88 | $ 70,480 |
Metropolitan areas with the highest employment level in Civil Engineering Technologists and Technicians:
| Metropolitan area | Employment (1) | Employment per thousand jobs | Location quotient (9) | Hourly mean wage | Annual mean wage (2) |
|---|---|---|---|---|---|
| Houston-The Woodlands-Sugar Land, TX | 2,320 | 0.80 | 1.76 | $ 29.24 | $ 60,830 |
| New York-Newark-Jersey City, NY-NJ-PA | 1,740 | 0.20 | 0.44 | $ 30.80 | $ 64,060 |
| Los Angeles-Long Beach-Anaheim, CA | 1,720 | 0.30 | 0.66 | $ 36.84 | $ 76,630 |
| Dallas-Fort Worth-Arlington, TX | 1,550 | 0.43 | 0.95 | $ 27.41 | $ 57,010 |
| Chicago-Naperville-Elgin, IL-IN-WI | 1,340 | 0.32 | 0.70 | $ 33.89 | $ 70,480 |
| Minneapolis-St. Paul-Bloomington, MN-WI | 1,250 | 0.68 | 1.50 | $ 34.61 | $ 71,980 |
| Philadelphia-Camden-Wilmington, PA-NJ-DE-MD | 1,190 | 0.45 | 0.98 | $ 26.92 | $ 55,990 |
| Kansas City, MO-KS | 1,030 | 1.02 | 2.23 | $ 25.68 | $ 53,410 |
| Miami-Fort Lauderdale-West Palm Beach, FL | 910 | 0.37 | 0.81 | $ 26.53 | $ 55,190 |
| St. Louis, MO-IL | 890 | 0.70 | 1.53 | $ 25.25 | $ 52,510 |
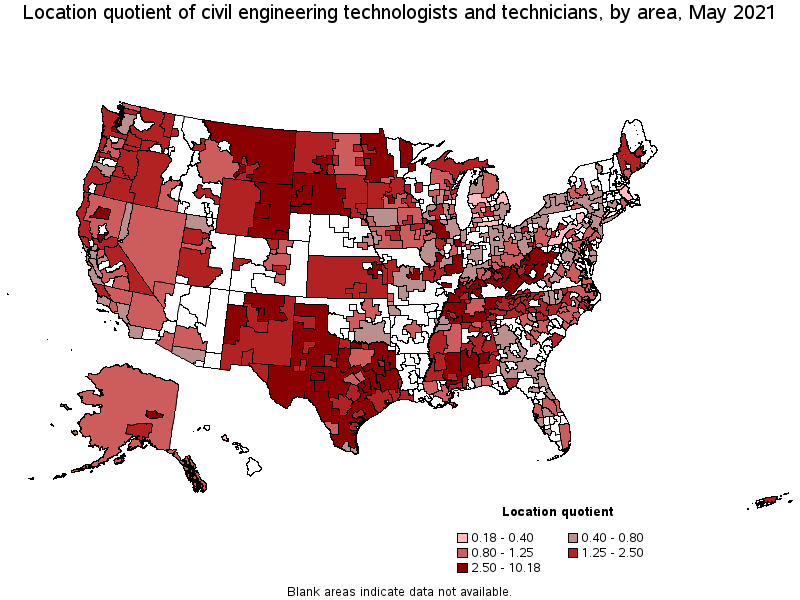
Metropolitan areas with the highest concentration of jobs and location quotients in Civil Engineering Technologists and Technicians:
| Metropolitan area | Employment (1) | Employment per thousand jobs | Location quotient (9) | Hourly mean wage | Annual mean wage (2) |
|---|---|---|---|---|---|
| Ames, IA | 120 | 2.78 | 6.10 | $ 30.61 | $ 63,670 |
| Springfield, IL | 260 | 2.70 | 5.93 | $ 31.25 | $ 65,010 |
| Santa Fe, NM | 150 | 2.64 | 5.79 | $ 24.71 | $ 51,400 |
| Charleston, WV | 240 | 2.37 | 5.21 | $ 27.76 | $ 57,730 |
| Dover, DE | 140 | 2.16 | 4.74 | $ 22.35 | $ 46,480 |
| Bismarck, ND | 150 | 2.10 | 4.61 | $ 29.52 | $ 61,400 |
| Montgomery, AL | 310 | 2.03 | 4.45 | $ 23.30 | $ 48,460 |
| Cheyenne, WY | 80 | 1.71 | 3.76 | $ 22.96 | $ 47,750 |
| Mankato-North Mankato, MN | 80 | 1.62 | 3.57 | $ 31.14 | $ 64,780 |
| Topeka, KS | 170 | 1.61 | 3.52 | $ 23.09 | $ 48,040 |
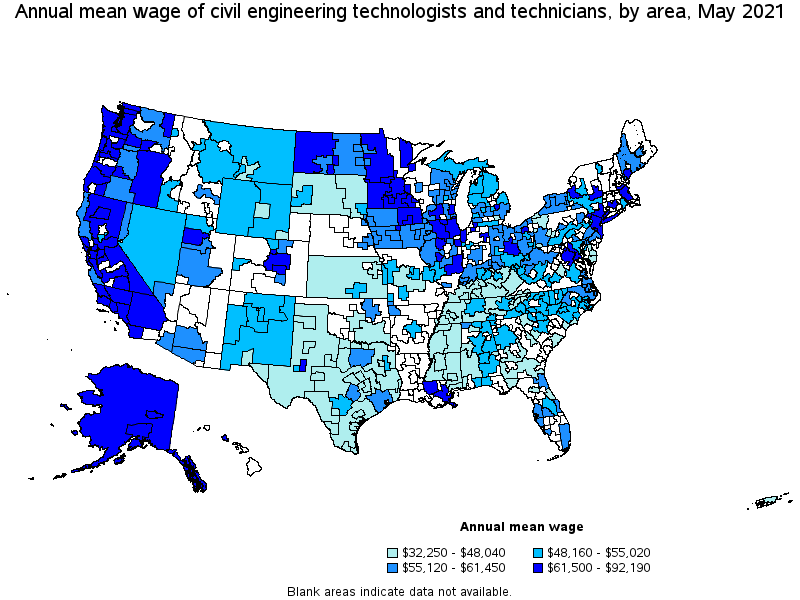
Top paying metropolitan areas for Civil Engineering Technologists and Technicians:
| Metropolitan area | Employment (1) | Employment per thousand jobs | Location quotient (9) | Hourly mean wage | Annual mean wage (2) |
|---|---|---|---|---|---|
| San Francisco-Oakland-Hayward, CA | 590 | 0.26 | 0.58 | $ 44.32 | $ 92,190 |
| Vallejo-Fairfield, CA | 30 | 0.26 | 0.56 | $ 40.02 | $ 83,250 |
| Baton Rouge, LA | 160 | 0.43 | 0.94 | $ 39.11 | $ 81,340 |
| San Jose-Sunnyvale-Santa Clara, CA | 320 | 0.30 | 0.66 | $ 39.06 | $ 81,240 |
| Bridgeport-Stamford-Norwalk, CT | 40 | 0.12 | 0.25 | $ 37.85 | $ 78,730 |
| Anchorage, AK | 160 | 0.96 | 2.11 | $ 37.61 | $ 78,240 |
| Los Angeles-Long Beach-Anaheim, CA | 1,720 | 0.30 | 0.66 | $ 36.84 | $ 76,630 |
| Modesto, CA | 50 | 0.27 | 0.59 | $ 36.75 | $ 76,440 |
| Seattle-Tacoma-Bellevue, WA | 590 | 0.31 | 0.68 | $ 36.74 | $ 76,410 |
| Midland, TX | 100 | 1.06 | 2.33 | $ 36.72 | $ 76,380 |
Nonmetropolitan areas with the highest employment in Civil Engineering Technologists and Technicians:
| Nonmetropolitan area | Employment (1) | Employment per thousand jobs | Location quotient (9) | Hourly mean wage | Annual mean wage (2) |
|---|---|---|---|---|---|
| West Texas Region of Texas nonmetropolitan area | 570 | 3.12 | 6.84 | $ 20.34 | $ 42,300 |
| East Kentucky nonmetropolitan area | 440 | 4.64 | 10.18 | $ 21.69 | $ 45,120 |
| Central Kentucky nonmetropolitan area | 380 | 2.20 | 4.82 | $ 22.37 | $ 46,520 |
| North Texas Region of Texas nonmetropolitan area | 370 | 1.38 | 3.03 | $ 19.29 | $ 40,110 |
| Hill Country Region of Texas nonmetropolitan area | 330 | 1.75 | 3.84 | $ 19.29 | $ 40,120 |
Nonmetropolitan areas with the highest concentration of jobs and location quotients in Civil Engineering Technologists and Technicians:
| Nonmetropolitan area | Employment (1) | Employment per thousand jobs | Location quotient (9) | Hourly mean wage | Annual mean wage (2) |
|---|---|---|---|---|---|
| East Kentucky nonmetropolitan area | 440 | 4.64 | 10.18 | $ 21.69 | $ 45,120 |
| West Texas Region of Texas nonmetropolitan area | 570 | 3.12 | 6.84 | $ 20.34 | $ 42,300 |
| Central Kentucky nonmetropolitan area | 380 | 2.20 | 4.82 | $ 22.37 | $ 46,520 |
| West Tennessee nonmetropolitan area | 260 | 2.06 | 4.53 | $ 19.31 | $ 40,160 |
| West Kentucky nonmetropolitan area | 280 | 1.92 | 4.22 | $ 22.40 | $ 46,580 |
Top paying nonmetropolitan areas for Civil Engineering Technologists and Technicians:
| Nonmetropolitan area | Employment (1) | Employment per thousand jobs | Location quotient (9) | Hourly mean wage | Annual mean wage (2) |
|---|---|---|---|---|---|
| Eastern Sierra-Mother Lode Region of California nonmetropolitan area | 50 | 0.85 | 1.86 | $ 34.22 | $ 71,170 |
| Eastern Oregon nonmetropolitan area | 50 | 0.76 | 1.67 | $ 33.98 | $ 70,680 |
| Alaska nonmetropolitan area | 40 | 0.42 | 0.92 | $ 33.32 | $ 69,300 |
| Coast Oregon nonmetropolitan area | 100 | 0.90 | 1.98 | $ 33.06 | $ 68,760 |
| North Valley-Northern Mountains Region of California nonmetropolitan area | 50 | 0.51 | 1.13 | $ 32.35 | $ 67,290 |
These estimates are calculated with data collected from employers in all industry sectors, all metropolitan and nonmetropolitan areas, and all states and the District of Columbia. The top employment and wage figures are provided above. The complete list is available in the downloadable XLS files.
The percentile wage estimate is the value of a wage below which a certain percent of workers fall. The median wage is the 50th percentile wage estimate—50 percent of workers earn less than the median and 50 percent of workers earn more than the median. More about percentile wages.
(1) Estimates for detailed occupations do not sum to the totals because the totals include occupations not shown separately. Estimates do not include self-employed workers.
(2) Annual wages have been calculated by multiplying the hourly mean wage by a "year-round, full-time" hours figure of 2,080 hours; for those occupations where there is not an hourly wage published, the annual wage has been directly calculated from the reported survey data.
(3) The relative standard error (RSE) is a measure of the reliability of a survey statistic. The smaller the relative standard error, the more precise the estimate.
(7) The value is less than .005 percent of industry employment.
(9) The location quotient is the ratio of the area concentration of occupational employment to the national average concentration. A location quotient greater than one indicates the occupation has a higher share of employment than average, and a location quotient less than one indicates the occupation is less prevalent in the area than average.
Other OEWS estimates and related information:
May 2021 National Occupational Employment and Wage Estimates
May 2021 State Occupational Employment and Wage Estimates
May 2021 Metropolitan and Nonmetropolitan Area Occupational Employment and Wage Estimates
May 2021 National Industry-Specific Occupational Employment and Wage Estimates
Last Modified Date: March 31, 2022