
An official website of the United States government
An official website of the United States government
The .gov means it's official.
Federal government websites often end in .gov or .mil. Before sharing sensitive information,
make sure you're on a federal government site.
The site is secure.
The
https:// ensures that you are connecting to the official website and that any
information you provide is encrypted and transmitted securely.
Investigate atmospheric phenomena and interpret meteorological data, gathered by surface and air stations, satellites, and radar to prepare reports and forecasts for public and other uses. Includes weather analysts and forecasters whose functions require the detailed knowledge of meteorology.
Employment estimate and mean wage estimates for Atmospheric and Space Scientists:
| Employment (1) | Employment RSE (3) |
Mean hourly wage |
Mean annual wage (2) |
Wage RSE (3) |
|---|---|---|---|---|
| 8,520 | 3.5 % | $ 46.58 | $ 96,880 | 1.5 % |
Percentile wage estimates for Atmospheric and Space Scientists:
| Percentile | 10% | 25% | 50% (Median) |
75% | 90% |
|---|---|---|---|---|---|
| Hourly Wage | $ 23.36 | $ 31.30 | $ 45.47 | $ 57.58 | $ 72.48 |
| Annual Wage (2) | $ 48,600 | $ 65,110 | $ 94,570 | $ 119,770 | $ 150,760 |
Industries with the highest published employment and wages for Atmospheric and Space Scientists are provided. For a list of all industries with employment in Atmospheric and Space Scientists, see the Create Customized Tables function.
Industries with the highest levels of employment in Atmospheric and Space Scientists:
| Industry | Employment (1) | Percent of industry employment | Hourly mean wage | Annual mean wage (2) |
|---|---|---|---|---|
| Federal Executive Branch (OEWS Designation) | 2,850 | 0.14 | $ 51.61 | $ 107,340 |
| Radio and Television Broadcasting | 1,570 | 0.82 | $ 40.83 | $ 84,930 |
| Scientific Research and Development Services | 1,340 | 0.17 | $ 54.57 | $ 113,510 |
| Other Professional, Scientific, and Technical Services | 820 | 0.11 | $ 33.72 | $ 70,130 |
| Colleges, Universities, and Professional Schools | 780 | 0.03 | $ 48.27 | $ 100,400 |
Industries with the highest concentration of employment in Atmospheric and Space Scientists:
| Industry | Employment (1) | Percent of industry employment | Hourly mean wage | Annual mean wage (2) |
|---|---|---|---|---|
| Radio and Television Broadcasting | 1,570 | 0.82 | $ 40.83 | $ 84,930 |
| Cable and Other Subscription Programming | 110 | 0.23 | $ 42.28 | $ 87,940 |
| Scientific Research and Development Services | 1,340 | 0.17 | $ 54.57 | $ 113,510 |
| Federal Executive Branch (OEWS Designation) | 2,850 | 0.14 | $ 51.61 | $ 107,340 |
| Other Professional, Scientific, and Technical Services | 820 | 0.11 | $ 33.72 | $ 70,130 |
Top paying industries for Atmospheric and Space Scientists:
| Industry | Employment (1) | Percent of industry employment | Hourly mean wage | Annual mean wage (2) |
|---|---|---|---|---|
| Electric Power Generation, Transmission and Distribution | 60 | 0.02 | $ 61.72 | $ 128,370 |
| Scientific Research and Development Services | 1,340 | 0.17 | $ 54.57 | $ 113,510 |
| Federal Executive Branch (OEWS Designation) | 2,850 | 0.14 | $ 51.61 | $ 107,340 |
| Colleges, Universities, and Professional Schools | 780 | 0.03 | $ 48.27 | $ 100,400 |
| Management of Companies and Enterprises | 110 | (7) | $ 44.96 | $ 93,510 |
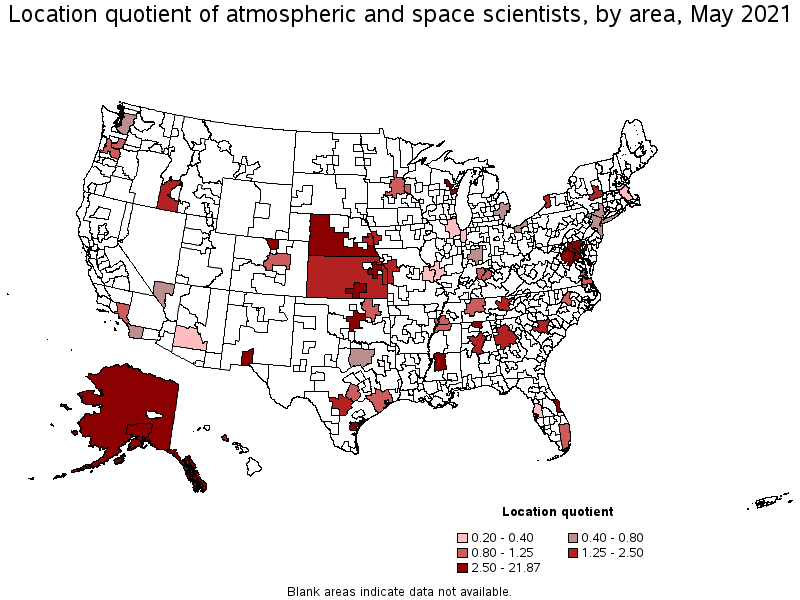
States and areas with the highest published employment, location quotients, and wages for Atmospheric and Space Scientists are provided. For a list of all areas with employment in Atmospheric and Space Scientists, see the Create Customized Tables function.
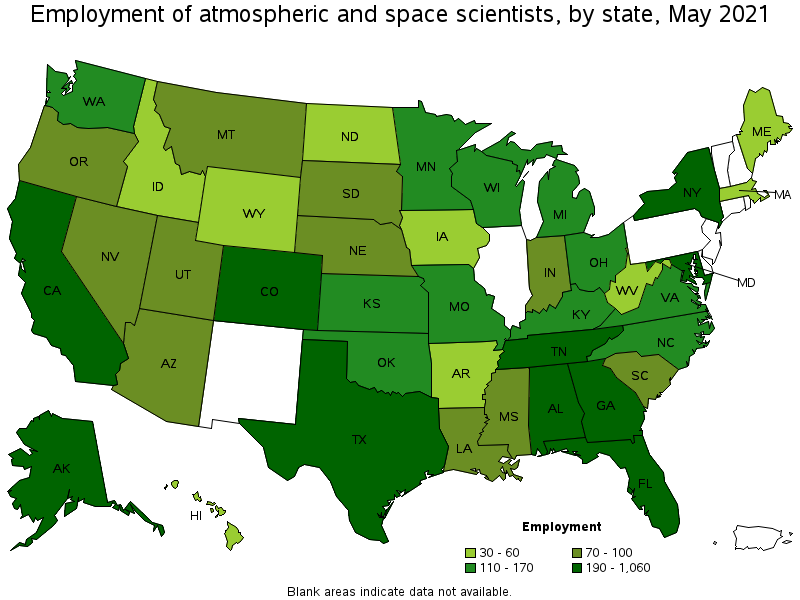
States with the highest employment level in Atmospheric and Space Scientists:
| State | Employment (1) | Employment per thousand jobs | Location quotient (9) | Hourly mean wage | Annual mean wage (2) |
|---|---|---|---|---|---|
| Colorado | 1,060 | 0.40 | 6.65 | $ 51.35 | $ 106,810 |
| Maryland | 930 | 0.36 | 6.03 | $ 50.92 | $ 105,920 |
| Texas | 680 | 0.06 | 0.91 | $ 42.66 | $ 88,740 |
| California | 620 | 0.04 | 0.62 | $ 57.71 | $ 120,040 |
| New York | 390 | 0.04 | 0.74 | $ 47.41 | $ 98,620 |
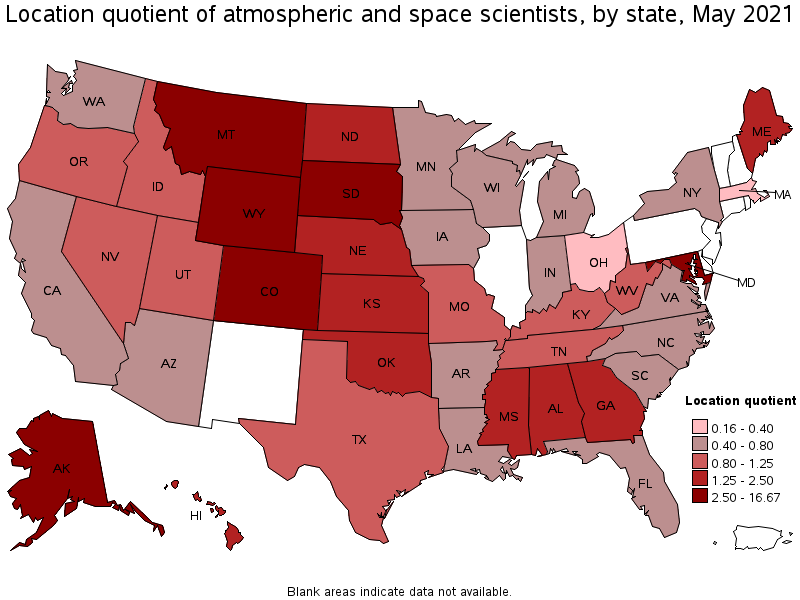
States with the highest concentration of jobs and location quotients in Atmospheric and Space Scientists:
| State | Employment (1) | Employment per thousand jobs | Location quotient (9) | Hourly mean wage | Annual mean wage (2) |
|---|---|---|---|---|---|
| Alaska | 300 | 1.01 | 16.67 | $ 37.26 | $ 77,500 |
| Colorado | 1,060 | 0.40 | 6.65 | $ 51.35 | $ 106,810 |
| Maryland | 930 | 0.36 | 6.03 | $ 50.92 | $ 105,920 |
| Montana | 100 | 0.22 | 3.59 | $ 43.74 | $ 90,970 |
| Wyoming | 50 | 0.18 | 3.04 | $ 44.47 | $ 92,490 |
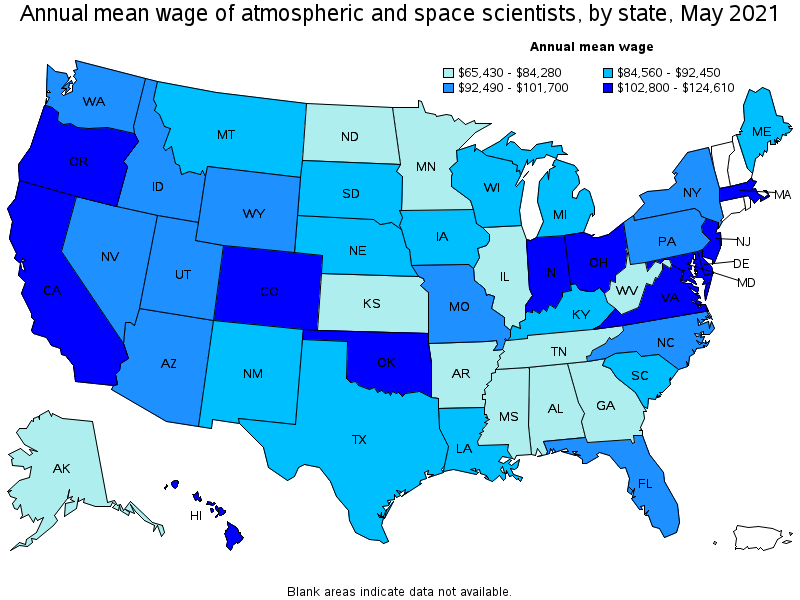
Top paying states for Atmospheric and Space Scientists:
| State | Employment (1) | Employment per thousand jobs | Location quotient (9) | Hourly mean wage | Annual mean wage (2) |
|---|---|---|---|---|---|
| Virginia | 160 | 0.04 | 0.70 | $ 59.91 | $ 124,610 |
| Massachusetts | 30 | 0.01 | 0.16 | $ 59.58 | $ 123,920 |
| California | 620 | 0.04 | 0.62 | $ 57.71 | $ 120,040 |
| Oklahoma | 140 | 0.09 | 1.52 | $ 53.09 | $ 110,420 |
| New Jersey | (8) | (8) | (8) | $ 51.80 | $ 107,740 |
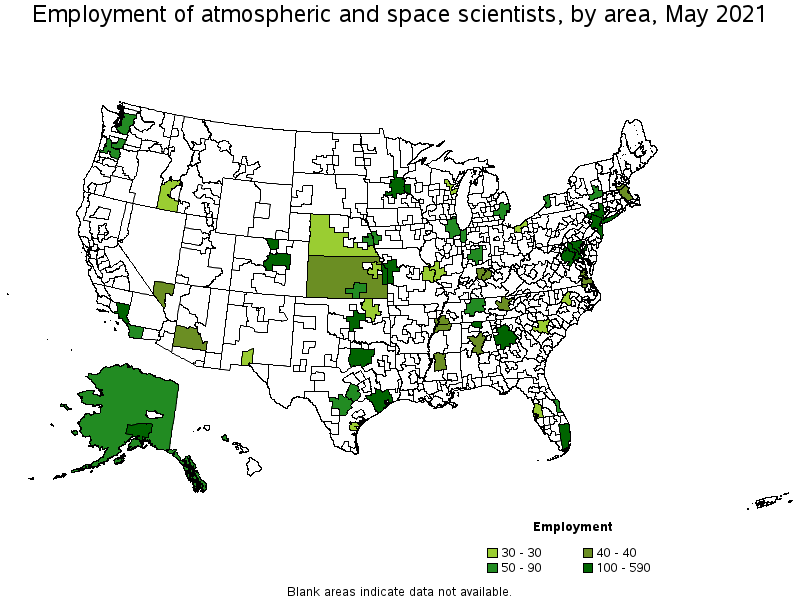
Metropolitan areas with the highest employment level in Atmospheric and Space Scientists:
| Metropolitan area | Employment (1) | Employment per thousand jobs | Location quotient (9) | Hourly mean wage | Annual mean wage (2) |
|---|---|---|---|---|---|
| Washington-Arlington-Alexandria, DC-VA-MD-WV | 590 | 0.20 | 3.34 | $ 53.61 | $ 111,510 |
| Baltimore-Columbia-Towson, MD | 420 | 0.33 | 5.47 | $ 51.67 | $ 107,480 |
| Los Angeles-Long Beach-Anaheim, CA | 330 | 0.06 | 0.94 | (8) | (8) |
| New York-Newark-Jersey City, NY-NJ-PA | 310 | 0.04 | 0.58 | $ 52.74 | $ 109,700 |
| Atlanta-Sandy Springs-Roswell, GA | 290 | 0.11 | 1.87 | $ 39.02 | $ 81,160 |
| Fort Collins, CO | 210 | 1.32 | 21.87 | $ 48.85 | $ 101,600 |
| Houston-The Woodlands-Sugar Land, TX | 150 | 0.05 | 0.87 | $ 41.50 | $ 86,310 |
| Anchorage, AK | 150 | 0.91 | 14.97 | $ 36.47 | $ 75,850 |
| Miami-Fort Lauderdale-West Palm Beach, FL | 140 | 0.06 | 0.94 | $ 51.82 | $ 107,790 |
| Dallas-Fort Worth-Arlington, TX | 130 | 0.04 | 0.59 | $ 50.10 | $ 104,210 |
Metropolitan areas with the highest concentration of jobs and location quotients in Atmospheric and Space Scientists:
| Metropolitan area | Employment (1) | Employment per thousand jobs | Location quotient (9) | Hourly mean wage | Annual mean wage (2) |
|---|---|---|---|---|---|
| Fort Collins, CO | 210 | 1.32 | 21.87 | $ 48.85 | $ 101,600 |
| Anchorage, AK | 150 | 0.91 | 14.97 | $ 36.47 | $ 75,850 |
| Las Cruces, NM | 30 | 0.48 | 7.95 | $ 43.49 | $ 90,450 |
| Huntsville, AL | 110 | 0.46 | 7.54 | $ 42.63 | $ 88,670 |
| Baltimore-Columbia-Towson, MD | 420 | 0.33 | 5.47 | $ 51.67 | $ 107,480 |
| Topeka, KS | 30 | 0.29 | 4.81 | $ 34.35 | $ 71,440 |
| Palm Bay-Melbourne-Titusville, FL | 50 | 0.23 | 3.88 | $ 45.49 | $ 94,610 |
| Washington-Arlington-Alexandria, DC-VA-MD-WV | 590 | 0.20 | 3.34 | $ 53.61 | $ 111,510 |
| Green Bay, WI | 30 | 0.19 | 3.06 | $ 48.10 | $ 100,040 |
| Oklahoma City, OK | 110 | 0.19 | 3.06 | $ 54.15 | $ 112,630 |
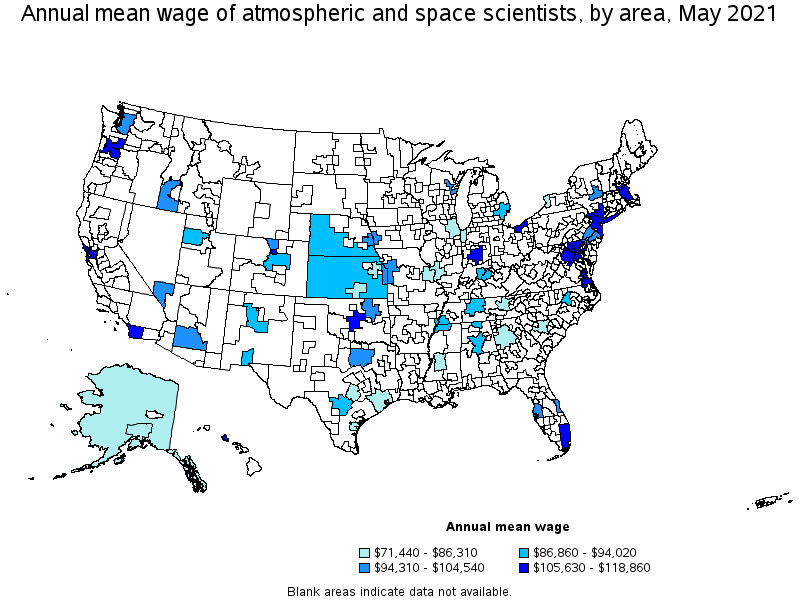
Top paying metropolitan areas for Atmospheric and Space Scientists:
| Metropolitan area | Employment (1) | Employment per thousand jobs | Location quotient (9) | Hourly mean wage | Annual mean wage (2) |
|---|---|---|---|---|---|
| San Francisco-Oakland-Hayward, CA | (8) | (8) | (8) | $ 57.15 | $ 118,860 |
| Boston-Cambridge-Nashua, MA-NH | 40 | 0.01 | 0.23 | $ 56.94 | $ 118,420 |
| Portland-Vancouver-Hillsboro, OR-WA | 60 | 0.05 | 0.83 | $ 55.22 | $ 114,860 |
| Virginia Beach-Norfolk-Newport News, VA-NC | 40 | 0.05 | 0.84 | $ 54.74 | $ 113,870 |
| Boulder, CO | (8) | (8) | (8) | $ 54.53 | $ 113,410 |
| Indianapolis-Carmel-Anderson, IN | 50 | 0.05 | 0.77 | $ 54.46 | $ 113,280 |
| Oklahoma City, OK | 110 | 0.19 | 3.06 | $ 54.15 | $ 112,630 |
| Washington-Arlington-Alexandria, DC-VA-MD-WV | 590 | 0.20 | 3.34 | $ 53.61 | $ 111,510 |
| New York-Newark-Jersey City, NY-NJ-PA | 310 | 0.04 | 0.58 | $ 52.74 | $ 109,700 |
| Miami-Fort Lauderdale-West Palm Beach, FL | 140 | 0.06 | 0.94 | $ 51.82 | $ 107,790 |
Nonmetropolitan areas with the highest employment in Atmospheric and Space Scientists:
| Nonmetropolitan area | Employment (1) | Employment per thousand jobs | Location quotient (9) | Hourly mean wage | Annual mean wage (2) |
|---|---|---|---|---|---|
| Alaska nonmetropolitan area | 90 | 0.95 | 15.62 | $ 38.05 | $ 79,150 |
| Kansas nonmetropolitan area | 40 | 0.10 | 1.62 | $ 42.02 | $ 87,400 |
| South Nebraska nonmetropolitan area | 30 | 0.21 | 3.41 | $ 44.44 | $ 92,440 |
Nonmetropolitan areas with the highest concentration of jobs and location quotients in Atmospheric and Space Scientists:
| Nonmetropolitan area | Employment (1) | Employment per thousand jobs | Location quotient (9) | Hourly mean wage | Annual mean wage (2) |
|---|---|---|---|---|---|
| Alaska nonmetropolitan area | 90 | 0.95 | 15.62 | $ 38.05 | $ 79,150 |
| South Nebraska nonmetropolitan area | 30 | 0.21 | 3.41 | $ 44.44 | $ 92,440 |
| Kansas nonmetropolitan area | 40 | 0.10 | 1.62 | $ 42.02 | $ 87,400 |
Top paying nonmetropolitan areas for Atmospheric and Space Scientists:
| Nonmetropolitan area | Employment (1) | Employment per thousand jobs | Location quotient (9) | Hourly mean wage | Annual mean wage (2) |
|---|---|---|---|---|---|
| South Nebraska nonmetropolitan area | 30 | 0.21 | 3.41 | $ 44.44 | $ 92,440 |
| Kansas nonmetropolitan area | 40 | 0.10 | 1.62 | $ 42.02 | $ 87,400 |
| Alaska nonmetropolitan area | 90 | 0.95 | 15.62 | $ 38.05 | $ 79,150 |
These estimates are calculated with data collected from employers in all industry sectors, all metropolitan and nonmetropolitan areas, and all states and the District of Columbia. The top employment and wage figures are provided above. The complete list is available in the downloadable XLS files.
The percentile wage estimate is the value of a wage below which a certain percent of workers fall. The median wage is the 50th percentile wage estimate—50 percent of workers earn less than the median and 50 percent of workers earn more than the median. More about percentile wages.
(1) Estimates for detailed occupations do not sum to the totals because the totals include occupations not shown separately. Estimates do not include self-employed workers.
(2) Annual wages have been calculated by multiplying the hourly mean wage by a "year-round, full-time" hours figure of 2,080 hours; for those occupations where there is not an hourly wage published, the annual wage has been directly calculated from the reported survey data.
(3) The relative standard error (RSE) is a measure of the reliability of a survey statistic. The smaller the relative standard error, the more precise the estimate.
(7) The value is less than .005 percent of industry employment.
(8) Estimate not released.
(9) The location quotient is the ratio of the area concentration of occupational employment to the national average concentration. A location quotient greater than one indicates the occupation has a higher share of employment than average, and a location quotient less than one indicates the occupation is less prevalent in the area than average.
Other OEWS estimates and related information:
May 2021 National Occupational Employment and Wage Estimates
May 2021 State Occupational Employment and Wage Estimates
May 2021 Metropolitan and Nonmetropolitan Area Occupational Employment and Wage Estimates
May 2021 National Industry-Specific Occupational Employment and Wage Estimates
Last Modified Date: March 31, 2022