
An official website of the United States government
An official website of the United States government
The .gov means it's official.
Federal government websites often end in .gov or .mil. Before sharing sensitive information,
make sure you're on a federal government site.
The site is secure.
The
https:// ensures that you are connecting to the official website and that any
information you provide is encrypted and transmitted securely.
Plan, develop, or conduct surveys. May analyze and interpret the meaning of survey data, determine survey objectives, or suggest or test question wording. Includes social scientists who primarily design questionnaires or supervise survey teams. Excludes �Market Research Analysts and Marketing Specialists� (13-1161) and �Statisticians� (15-2041).
Employment estimate and mean wage estimates for Survey Researchers:
| Employment (1) | Employment RSE (3) |
Mean hourly wage |
Mean annual wage (2) |
Wage RSE (3) |
|---|---|---|---|---|
| 8,850 | 5.3 % | $ 31.10 | $ 64,690 | 3.7 % |
Percentile wage estimates for Survey Researchers:
| Percentile | 10% | 25% | 50% (Median) |
75% | 90% |
|---|---|---|---|---|---|
| Hourly Wage | $ 12.67 | $ 18.67 | $ 28.72 | $ 37.77 | $ 48.65 |
| Annual Wage (2) | $ 26,360 | $ 38,840 | $ 59,740 | $ 78,560 | $ 101,180 |
Industries with the highest published employment and wages for Survey Researchers are provided. For a list of all industries with employment in Survey Researchers, see the Create Customized Tables function.
Industries with the highest levels of employment in Survey Researchers:
| Industry | Employment (1) | Percent of industry employment | Hourly mean wage | Annual mean wage (2) |
|---|---|---|---|---|
| Other Professional, Scientific, and Technical Services | 3,660 | 0.48 | $ 31.43 | $ 65,380 |
| Scientific Research and Development Services | 1,640 | 0.21 | $ 34.58 | $ 71,930 |
| Colleges, Universities, and Professional Schools | 1,140 | 0.04 | $ 26.41 | $ 54,920 |
| State Government, excluding schools and hospitals (OEWS Designation) | 430 | 0.02 | $ 33.09 | $ 68,830 |
| Management, Scientific, and Technical Consulting Services | 310 | 0.02 | $ 25.57 | $ 53,190 |
Industries with the highest concentration of employment in Survey Researchers:
| Industry | Employment (1) | Percent of industry employment | Hourly mean wage | Annual mean wage (2) |
|---|---|---|---|---|
| Other Professional, Scientific, and Technical Services | 3,660 | 0.48 | $ 31.43 | $ 65,380 |
| Scientific Research and Development Services | 1,640 | 0.21 | $ 34.58 | $ 71,930 |
| Grantmaking and Giving Services | 150 | 0.11 | $ 29.98 | $ 62,370 |
| Educational Support Services | 200 | 0.10 | $ 37.50 | $ 78,010 |
| Colleges, Universities, and Professional Schools | 1,140 | 0.04 | $ 26.41 | $ 54,920 |
Top paying industries for Survey Researchers:
| Industry | Employment (1) | Percent of industry employment | Hourly mean wage | Annual mean wage (2) |
|---|---|---|---|---|
| Newspaper, Periodical, Book, and Directory Publishers | 30 | 0.01 | $ 49.85 | $ 103,690 |
| Management of Companies and Enterprises | 40 | (7) | $ 40.69 | $ 84,640 |
| Educational Support Services | 200 | 0.10 | $ 37.50 | $ 78,010 |
| Scientific Research and Development Services | 1,640 | 0.21 | $ 34.58 | $ 71,930 |
| Employment Services | (8) | (8) | $ 33.97 | $ 70,650 |
States and areas with the highest published employment, location quotients, and wages for Survey Researchers are provided. For a list of all areas with employment in Survey Researchers, see the Create Customized Tables function.
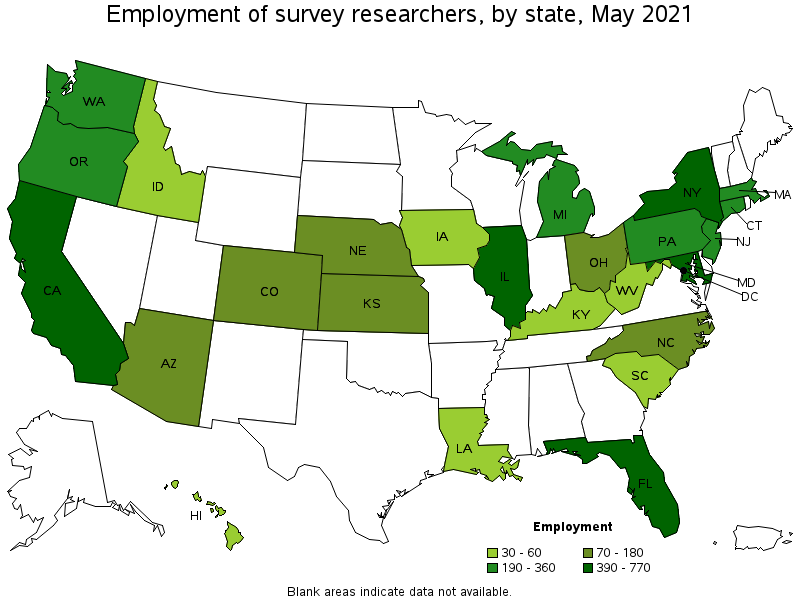
States with the highest employment level in Survey Researchers:
| State | Employment (1) | Employment per thousand jobs | Location quotient (9) | Hourly mean wage | Annual mean wage (2) |
|---|---|---|---|---|---|
| California | 770 | 0.05 | 0.74 | $ 33.59 | $ 69,870 |
| Maryland | 580 | 0.23 | 3.65 | $ 41.64 | $ 86,620 |
| District of Columbia | 500 | 0.76 | 12.15 | $ 46.60 | $ 96,920 |
| Florida | 490 | 0.06 | 0.91 | $ 21.33 | $ 44,370 |
| Illinois | 440 | 0.08 | 1.25 | $ 38.35 | $ 79,770 |
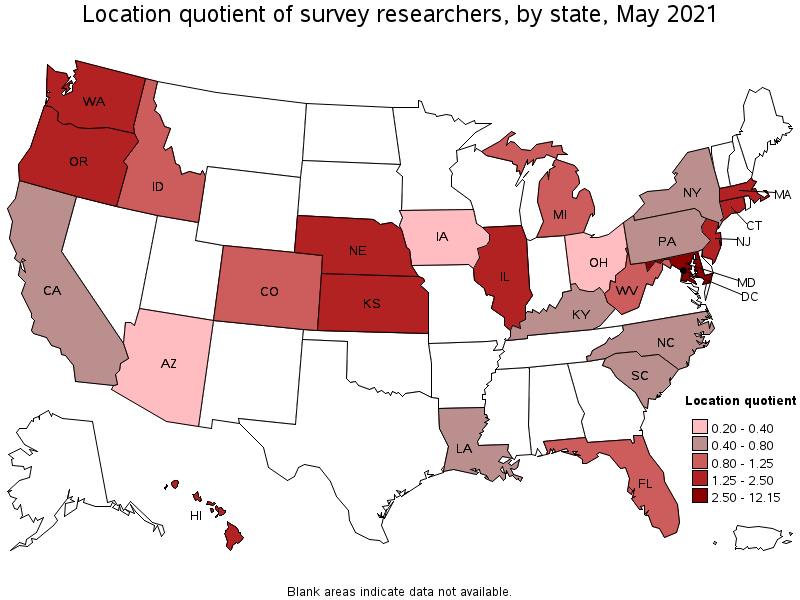
States with the highest concentration of jobs and location quotients in Survey Researchers:
| State | Employment (1) | Employment per thousand jobs | Location quotient (9) | Hourly mean wage | Annual mean wage (2) |
|---|---|---|---|---|---|
| District of Columbia | 500 | 0.76 | 12.15 | $ 46.60 | $ 96,920 |
| Maryland | 580 | 0.23 | 3.65 | $ 41.64 | $ 86,620 |
| Connecticut | 240 | 0.15 | 2.43 | $ 23.93 | $ 49,770 |
| Nebraska | 130 | 0.13 | 2.13 | $ 25.69 | $ 53,430 |
| Kansas | 170 | 0.13 | 2.05 | $ 27.18 | $ 56,520 |
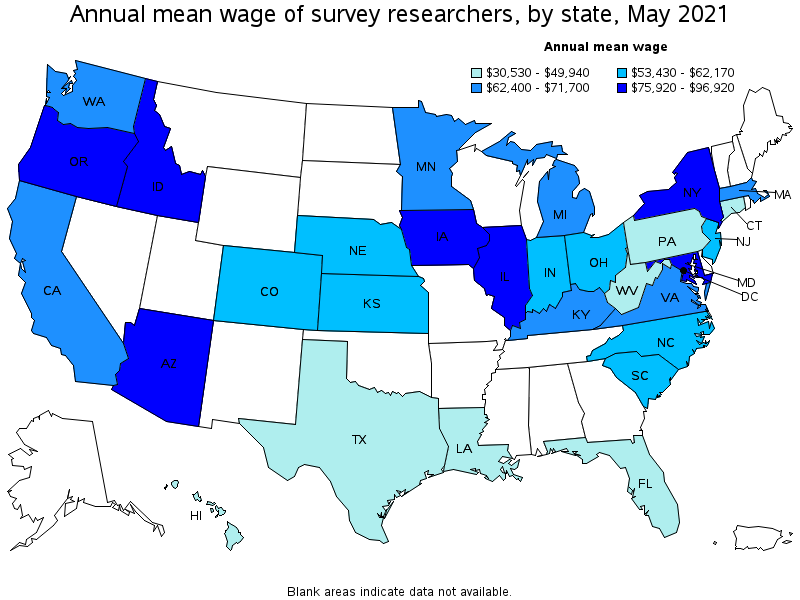
Top paying states for Survey Researchers:
| State | Employment (1) | Employment per thousand jobs | Location quotient (9) | Hourly mean wage | Annual mean wage (2) |
|---|---|---|---|---|---|
| District of Columbia | 500 | 0.76 | 12.15 | $ 46.60 | $ 96,920 |
| Maryland | 580 | 0.23 | 3.65 | $ 41.64 | $ 86,620 |
| New York | 390 | 0.05 | 0.72 | $ 40.64 | $ 84,530 |
| Idaho | 40 | 0.06 | 0.94 | $ 39.56 | $ 82,280 |
| Iowa | 30 | 0.02 | 0.36 | $ 38.64 | $ 80,380 |
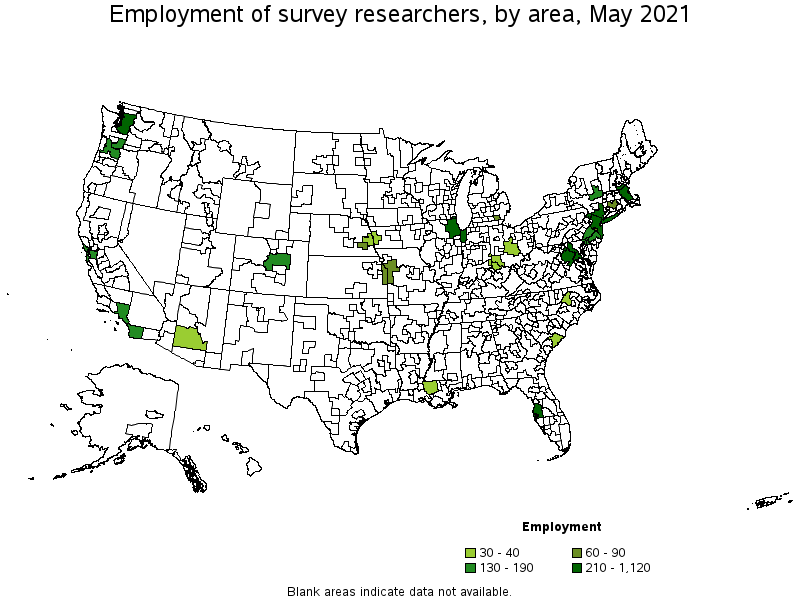
Metropolitan areas with the highest employment level in Survey Researchers:
| Metropolitan area | Employment (1) | Employment per thousand jobs | Location quotient (9) | Hourly mean wage | Annual mean wage (2) |
|---|---|---|---|---|---|
| Washington-Arlington-Alexandria, DC-VA-MD-WV | 1,120 | 0.38 | 6.07 | $ 43.68 | $ 90,860 |
| Chicago-Naperville-Elgin, IL-IN-WI | 420 | 0.10 | 1.56 | $ 38.98 | $ 81,090 |
| New York-Newark-Jersey City, NY-NJ-PA | 400 | 0.05 | 0.73 | $ 35.67 | $ 74,200 |
| Boston-Cambridge-Nashua, MA-NH | 330 | 0.13 | 2.05 | $ 34.16 | $ 71,050 |
| Seattle-Tacoma-Bellevue, WA | 250 | 0.13 | 2.10 | $ 33.25 | $ 69,170 |
| Tampa-St. Petersburg-Clearwater, FL | 210 | 0.16 | 2.55 | $ 21.31 | $ 44,330 |
| San Francisco-Oakland-Hayward, CA | 190 | 0.09 | 1.37 | $ 38.47 | $ 80,010 |
| Los Angeles-Long Beach-Anaheim, CA | 180 | 0.03 | 0.51 | $ 33.16 | $ 68,970 |
| Albany-Schenectady-Troy, NY | 170 | 0.41 | 6.60 | $ 41.46 | $ 86,230 |
| Philadelphia-Camden-Wilmington, PA-NJ-DE-MD | 160 | 0.06 | 0.95 | $ 37.07 | $ 77,110 |
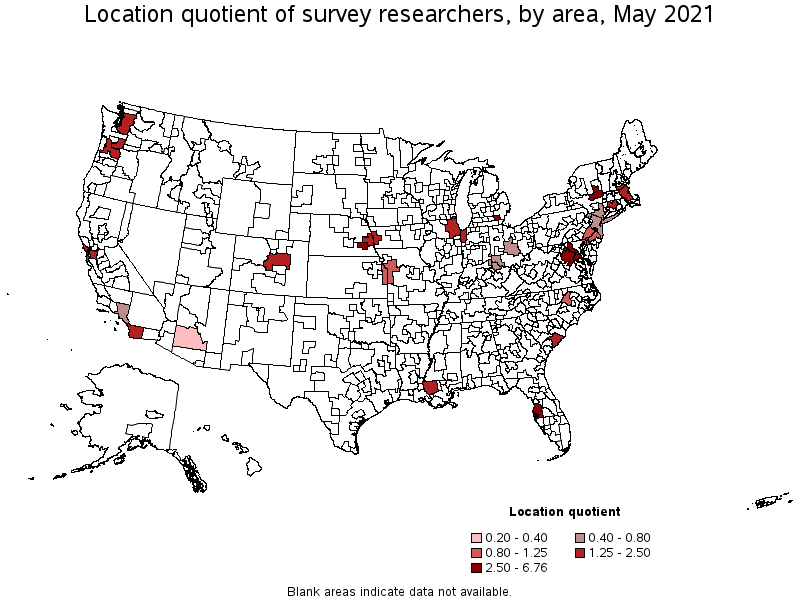
Metropolitan areas with the highest concentration of jobs and location quotients in Survey Researchers:
| Metropolitan area | Employment (1) | Employment per thousand jobs | Location quotient (9) | Hourly mean wage | Annual mean wage (2) |
|---|---|---|---|---|---|
| Ann Arbor, MI | 90 | 0.42 | 6.76 | $ 33.57 | $ 69,830 |
| Lincoln, NE | 70 | 0.42 | 6.73 | $ 26.94 | $ 56,030 |
| Albany-Schenectady-Troy, NY | 170 | 0.41 | 6.60 | $ 41.46 | $ 86,230 |
| Washington-Arlington-Alexandria, DC-VA-MD-WV | 1,120 | 0.38 | 6.07 | $ 43.68 | $ 90,860 |
| Trenton, NJ | 60 | 0.24 | 3.90 | $ 30.67 | $ 63,800 |
| Tampa-St. Petersburg-Clearwater, FL | 210 | 0.16 | 2.55 | $ 21.31 | $ 44,330 |
| Seattle-Tacoma-Bellevue, WA | 250 | 0.13 | 2.10 | $ 33.25 | $ 69,170 |
| Boston-Cambridge-Nashua, MA-NH | 330 | 0.13 | 2.05 | $ 34.16 | $ 71,050 |
| Portland-Vancouver-Hillsboro, OR-WA | 140 | 0.13 | 2.05 | (8) | (8) |
| Hartford-West Hartford-East Hartford, CT | 70 | 0.12 | 1.97 | $ 26.72 | $ 55,590 |
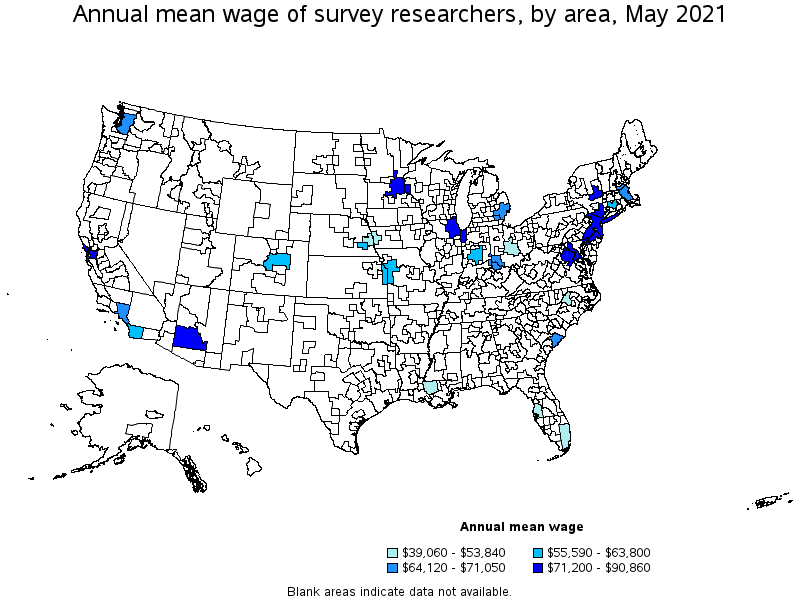
Top paying metropolitan areas for Survey Researchers:
| Metropolitan area | Employment (1) | Employment per thousand jobs | Location quotient (9) | Hourly mean wage | Annual mean wage (2) |
|---|---|---|---|---|---|
| Washington-Arlington-Alexandria, DC-VA-MD-WV | 1,120 | 0.38 | 6.07 | $ 43.68 | $ 90,860 |
| Phoenix-Mesa-Scottsdale, AZ | 40 | 0.02 | 0.27 | $ 42.59 | $ 88,580 |
| Albany-Schenectady-Troy, NY | 170 | 0.41 | 6.60 | $ 41.46 | $ 86,230 |
| Chicago-Naperville-Elgin, IL-IN-WI | 420 | 0.10 | 1.56 | $ 38.98 | $ 81,090 |
| San Francisco-Oakland-Hayward, CA | 190 | 0.09 | 1.37 | $ 38.47 | $ 80,010 |
| Philadelphia-Camden-Wilmington, PA-NJ-DE-MD | 160 | 0.06 | 0.95 | $ 37.07 | $ 77,110 |
| New York-Newark-Jersey City, NY-NJ-PA | 400 | 0.05 | 0.73 | $ 35.67 | $ 74,200 |
| Minneapolis-St. Paul-Bloomington, MN-WI | (8) | (8) | (8) | $ 34.23 | $ 71,200 |
| Boston-Cambridge-Nashua, MA-NH | 330 | 0.13 | 2.05 | $ 34.16 | $ 71,050 |
| Ann Arbor, MI | 90 | 0.42 | 6.76 | $ 33.57 | $ 69,830 |
These estimates are calculated with data collected from employers in all industry sectors, all metropolitan and nonmetropolitan areas, and all states and the District of Columbia. The top employment and wage figures are provided above. The complete list is available in the downloadable XLS files.
The percentile wage estimate is the value of a wage below which a certain percent of workers fall. The median wage is the 50th percentile wage estimate—50 percent of workers earn less than the median and 50 percent of workers earn more than the median. More about percentile wages.
(1) Estimates for detailed occupations do not sum to the totals because the totals include occupations not shown separately. Estimates do not include self-employed workers.
(2) Annual wages have been calculated by multiplying the hourly mean wage by a "year-round, full-time" hours figure of 2,080 hours; for those occupations where there is not an hourly wage published, the annual wage has been directly calculated from the reported survey data.
(3) The relative standard error (RSE) is a measure of the reliability of a survey statistic. The smaller the relative standard error, the more precise the estimate.
(7) The value is less than .005 percent of industry employment.
(8) Estimate not released.
(9) The location quotient is the ratio of the area concentration of occupational employment to the national average concentration. A location quotient greater than one indicates the occupation has a higher share of employment than average, and a location quotient less than one indicates the occupation is less prevalent in the area than average.
Other OEWS estimates and related information:
May 2021 National Occupational Employment and Wage Estimates
May 2021 State Occupational Employment and Wage Estimates
May 2021 Metropolitan and Nonmetropolitan Area Occupational Employment and Wage Estimates
May 2021 National Industry-Specific Occupational Employment and Wage Estimates
Last Modified Date: March 31, 2022