
An official website of the United States government
An official website of the United States government
The .gov means it's official.
Federal government websites often end in .gov or .mil. Before sharing sensitive information,
make sure you're on a federal government site.
The site is secure.
The
https:// ensures that you are connecting to the official website and that any
information you provide is encrypted and transmitted securely.
Diagnose and treat mental and emotional disorders, whether cognitive, affective, or behavioral, within the context of marriage and family systems. Apply psychotherapeutic and family systems theories and techniques in the delivery of services to individuals, couples, and families for the purpose of treating such diagnosed nervous and mental disorders. Excludes �Psychologists� (19-3032 through 19-3039) and �Social Workers� (21-1020).
Employment estimate and mean wage estimates for Marriage and Family Therapists:
| Employment (1) | Employment RSE (3) |
Mean hourly wage |
Mean annual wage (2) |
Wage RSE (3) |
|---|---|---|---|---|
| 54,800 | 3.4 % | $ 28.69 | $ 59,660 | 1.5 % |
Percentile wage estimates for Marriage and Family Therapists:
| Percentile | 10% | 25% | 50% (Median) |
75% | 90% |
|---|---|---|---|---|---|
| Hourly Wage | $ 17.81 | $ 20.63 | $ 23.98 | $ 36.25 | $ 46.41 |
| Annual Wage (2) | $ 37,050 | $ 42,910 | $ 49,880 | $ 75,410 | $ 96,520 |
Industries with the highest published employment and wages for Marriage and Family Therapists are provided. For a list of all industries with employment in Marriage and Family Therapists, see the Create Customized Tables function.
Industries with the highest levels of employment in Marriage and Family Therapists:
| Industry | Employment (1) | Percent of industry employment | Hourly mean wage | Annual mean wage (2) |
|---|---|---|---|---|
| Individual and Family Services | 18,780 | 0.71 | $ 26.36 | $ 54,820 |
| Offices of Other Health Practitioners | 15,310 | 1.57 | $ 28.73 | $ 59,760 |
| Outpatient Care Centers | 6,980 | 0.71 | $ 30.21 | $ 62,830 |
| State Government, excluding schools and hospitals (OEWS Designation) | 4,300 | 0.20 | $ 37.48 | $ 77,960 |
| Residential Intellectual and Developmental Disability, Mental Health, and Substance Abuse Facilities | 2,070 | 0.34 | $ 27.13 | $ 56,420 |
Industries with the highest concentration of employment in Marriage and Family Therapists:
| Industry | Employment (1) | Percent of industry employment | Hourly mean wage | Annual mean wage (2) |
|---|---|---|---|---|
| Offices of Other Health Practitioners | 15,310 | 1.57 | $ 28.73 | $ 59,760 |
| Outpatient Care Centers | 6,980 | 0.71 | $ 30.21 | $ 62,830 |
| Individual and Family Services | 18,780 | 0.71 | $ 26.36 | $ 54,820 |
| Other Residential Care Facilities | 770 | 0.51 | $ 25.44 | $ 52,910 |
| Community Food and Housing, and Emergency and Other Relief Services | 800 | 0.42 | $ 22.07 | $ 45,900 |
Top paying industries for Marriage and Family Therapists:
| Industry | Employment (1) | Percent of industry employment | Hourly mean wage | Annual mean wage (2) |
|---|---|---|---|---|
| Home Health Care Services | (8) | (8) | $ 47.01 | $ 97,780 |
| State Government, excluding schools and hospitals (OEWS Designation) | 4,300 | 0.20 | $ 37.48 | $ 77,960 |
| Local Government, excluding schools and hospitals (OEWS Designation) | 910 | 0.02 | $ 35.65 | $ 74,160 |
| General Medical and Surgical Hospitals | 710 | 0.01 | $ 34.17 | $ 71,060 |
| Offices of Physicians | 950 | 0.04 | $ 33.94 | $ 70,600 |
States and areas with the highest published employment, location quotients, and wages for Marriage and Family Therapists are provided. For a list of all areas with employment in Marriage and Family Therapists, see the Create Customized Tables function.
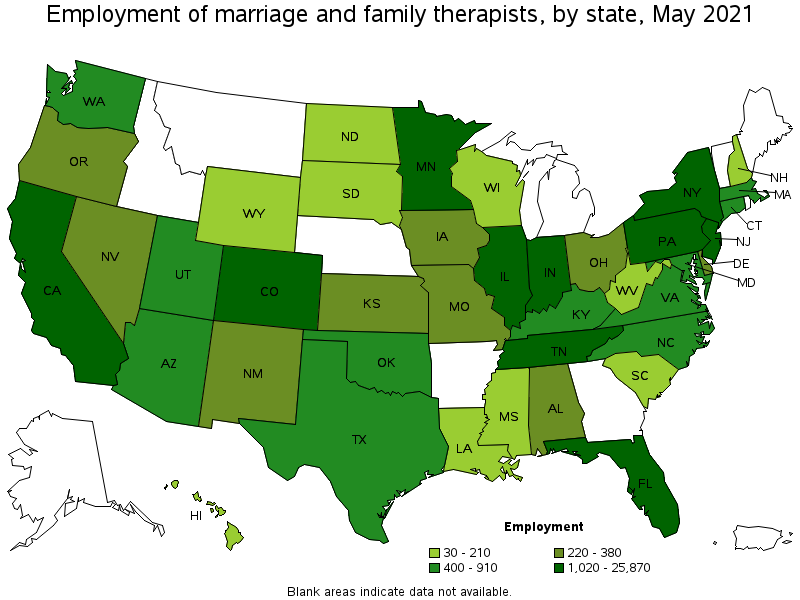
States with the highest employment level in Marriage and Family Therapists:
| State | Employment (1) | Employment per thousand jobs | Location quotient (9) | Hourly mean wage | Annual mean wage (2) |
|---|---|---|---|---|---|
| California | 25,870 | 1.57 | 4.02 | $ 28.52 | $ 59,320 |
| New Jersey | 4,120 | 1.07 | 2.75 | $ 39.10 | $ 81,330 |
| Illinois | 2,540 | 0.45 | 1.16 | $ 25.75 | $ 53,560 |
| Minnesota | 2,310 | 0.84 | 2.17 | $ 33.01 | $ 68,660 |
| Florida | 2,240 | 0.26 | 0.67 | $ 22.31 | $ 46,410 |
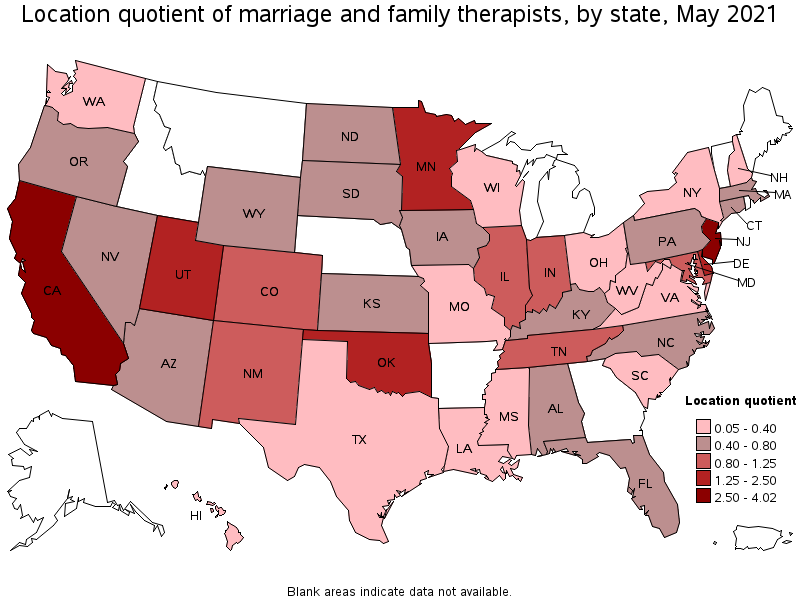
States with the highest concentration of jobs and location quotients in Marriage and Family Therapists:
| State | Employment (1) | Employment per thousand jobs | Location quotient (9) | Hourly mean wage | Annual mean wage (2) |
|---|---|---|---|---|---|
| California | 25,870 | 1.57 | 4.02 | $ 28.52 | $ 59,320 |
| New Jersey | 4,120 | 1.07 | 2.75 | $ 39.10 | $ 81,330 |
| Minnesota | 2,310 | 0.84 | 2.17 | $ 33.01 | $ 68,660 |
| Utah | 910 | 0.59 | 1.51 | $ 41.58 | $ 86,490 |
| Oklahoma | 830 | 0.53 | 1.37 | $ 27.99 | $ 58,210 |
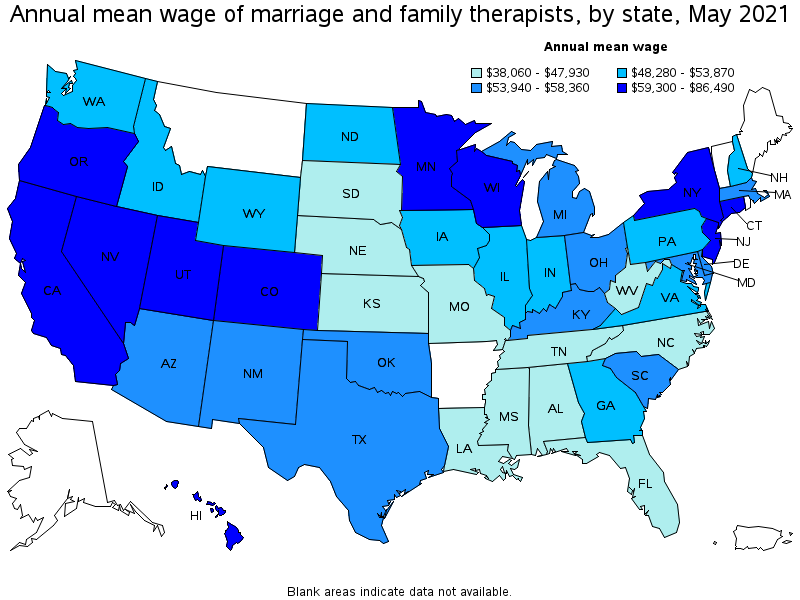
Top paying states for Marriage and Family Therapists:
| State | Employment (1) | Employment per thousand jobs | Location quotient (9) | Hourly mean wage | Annual mean wage (2) |
|---|---|---|---|---|---|
| Utah | 910 | 0.59 | 1.51 | $ 41.58 | $ 86,490 |
| New Jersey | 4,120 | 1.07 | 2.75 | $ 39.10 | $ 81,330 |
| Colorado | 1,130 | 0.43 | 1.10 | $ 35.11 | $ 73,040 |
| Minnesota | 2,310 | 0.84 | 2.17 | $ 33.01 | $ 68,660 |
| Nevada | 310 | 0.24 | 0.62 | $ 32.02 | $ 66,600 |
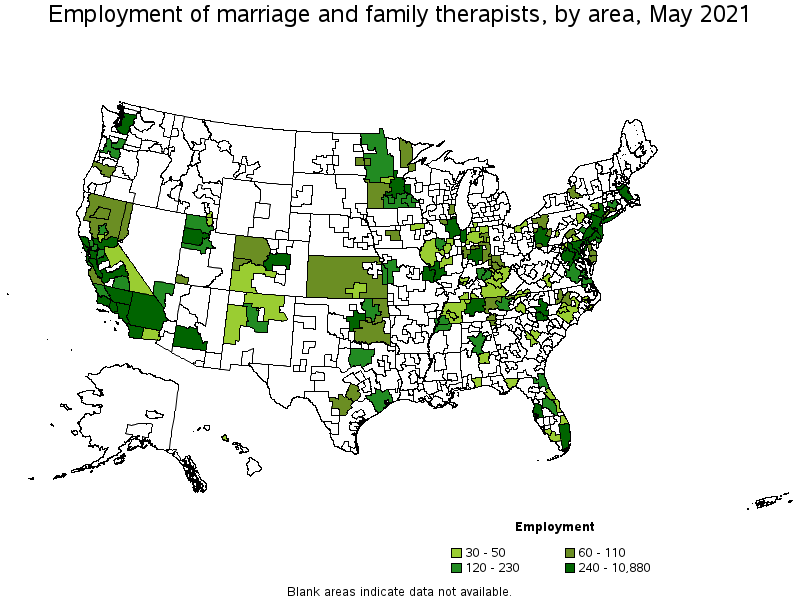
Metropolitan areas with the highest employment level in Marriage and Family Therapists:
| Metropolitan area | Employment (1) | Employment per thousand jobs | Location quotient (9) | Hourly mean wage | Annual mean wage (2) |
|---|---|---|---|---|---|
| Los Angeles-Long Beach-Anaheim, CA | 10,880 | 1.90 | 4.89 | $ 26.81 | $ 55,760 |
| San Diego-Carlsbad, CA | 3,590 | 2.58 | 6.64 | $ 25.16 | $ 52,340 |
| New York-Newark-Jersey City, NY-NJ-PA | 3,270 | 0.38 | 0.97 | $ 36.58 | $ 76,090 |
| San Francisco-Oakland-Hayward, CA | 2,400 | 1.07 | 2.75 | $ 34.88 | $ 72,550 |
| Chicago-Naperville-Elgin, IL-IN-WI | 2,080 | 0.49 | 1.26 | $ 26.54 | $ 55,200 |
| Riverside-San Bernardino-Ontario, CA | 1,740 | 1.14 | 2.93 | $ 28.10 | $ 58,450 |
| Sacramento--Roseville--Arden-Arcade, CA | 1,400 | 1.43 | 3.67 | $ 30.12 | $ 62,660 |
| Minneapolis-St. Paul-Bloomington, MN-WI | 1,370 | 0.75 | 1.93 | $ 33.33 | $ 69,330 |
| Philadelphia-Camden-Wilmington, PA-NJ-DE-MD | 1,360 | 0.51 | 1.32 | $ 34.65 | $ 72,060 |
| San Jose-Sunnyvale-Santa Clara, CA | 1,120 | 1.05 | 2.70 | $ 33.72 | $ 70,130 |
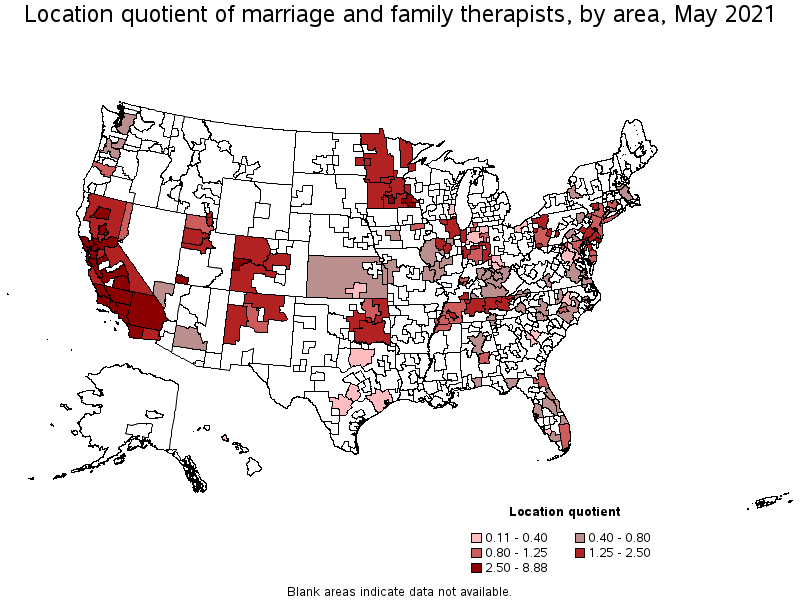
Metropolitan areas with the highest concentration of jobs and location quotients in Marriage and Family Therapists:
| Metropolitan area | Employment (1) | Employment per thousand jobs | Location quotient (9) | Hourly mean wage | Annual mean wage (2) |
|---|---|---|---|---|---|
| Mankato-North Mankato, MN | 180 | 3.45 | 8.88 | $ 34.46 | $ 71,670 |
| San Diego-Carlsbad, CA | 3,590 | 2.58 | 6.64 | $ 25.16 | $ 52,340 |
| San Luis Obispo-Paso Robles-Arroyo Grande, CA | 220 | 1.97 | 5.06 | $ 24.78 | $ 51,530 |
| Los Angeles-Long Beach-Anaheim, CA | 10,880 | 1.90 | 4.89 | $ 26.81 | $ 55,760 |
| Napa, CA | 130 | 1.83 | 4.71 | $ 26.22 | $ 54,540 |
| Modesto, CA | 330 | 1.81 | 4.66 | $ 26.98 | $ 56,120 |
| Rochester, MN | 200 | 1.74 | 4.46 | $ 36.67 | $ 76,280 |
| Atlantic City-Hammonton, NJ | 200 | 1.69 | 4.34 | $ 37.56 | $ 78,120 |
| Santa Rosa, CA | 310 | 1.62 | 4.17 | $ 33.89 | $ 70,480 |
| Chico, CA | 120 | 1.57 | 4.02 | $ 26.63 | $ 55,390 |
Top paying metropolitan areas for Marriage and Family Therapists:
| Metropolitan area | Employment (1) | Employment per thousand jobs | Location quotient (9) | Hourly mean wage | Annual mean wage (2) |
|---|---|---|---|---|---|
| Kingston, NY | 30 | 0.61 | 1.56 | $ 54.85 | $ 114,090 |
| Salt Lake City, UT | 370 | 0.50 | 1.30 | $ 43.59 | $ 90,670 |
| Provo-Orem, UT | 230 | 0.84 | 2.16 | $ 41.47 | $ 86,260 |
| Ogden-Clearfield, UT | 120 | 0.46 | 1.17 | $ 41.08 | $ 85,450 |
| Trenton, NJ | 320 | 1.39 | 3.59 | $ 40.35 | $ 83,940 |
| St. George, UT | 90 | 1.16 | 2.99 | $ 39.07 | $ 81,270 |
| Yuba City, CA | 40 | 0.87 | 2.23 | $ 38.25 | $ 79,560 |
| Boulder, CO | (8) | (8) | (8) | $ 38.19 | $ 79,440 |
| Vallejo-Fairfield, CA | 160 | 1.25 | 3.20 | $ 37.67 | $ 78,350 |
| Atlantic City-Hammonton, NJ | 200 | 1.69 | 4.34 | $ 37.56 | $ 78,120 |
Nonmetropolitan areas with the highest employment in Marriage and Family Therapists:
| Nonmetropolitan area | Employment (1) | Employment per thousand jobs | Location quotient (9) | Hourly mean wage | Annual mean wage (2) |
|---|---|---|---|---|---|
| Northwest Minnesota nonmetropolitan area | 140 | 0.79 | 2.03 | $ 29.59 | $ 61,550 |
| Southeast Minnesota nonmetropolitan area | 120 | 0.79 | 2.04 | $ 33.01 | $ 68,660 |
| Southeast Oklahoma nonmetropolitan area | 110 | 0.68 | 1.75 | $ 30.79 | $ 64,030 |
| Western Pennsylvania nonmetropolitan area | 110 | 0.80 | 2.05 | $ 22.29 | $ 46,370 |
| North Valley-Northern Mountains Region of California nonmetropolitan area | 90 | 0.90 | 2.33 | $ 28.40 | $ 59,070 |
Nonmetropolitan areas with the highest concentration of jobs and location quotients in Marriage and Family Therapists:
| Nonmetropolitan area | Employment (1) | Employment per thousand jobs | Location quotient (9) | Hourly mean wage | Annual mean wage (2) |
|---|---|---|---|---|---|
| North Valley-Northern Mountains Region of California nonmetropolitan area | 90 | 0.90 | 2.33 | $ 28.40 | $ 59,070 |
| Eastern Sierra-Mother Lode Region of California nonmetropolitan area | 50 | 0.87 | 2.24 | $ 26.89 | $ 55,940 |
| Western Pennsylvania nonmetropolitan area | 110 | 0.80 | 2.05 | $ 22.29 | $ 46,370 |
| Southeast Minnesota nonmetropolitan area | 120 | 0.79 | 2.04 | $ 33.01 | $ 68,660 |
| Northwest Minnesota nonmetropolitan area | 140 | 0.79 | 2.03 | $ 29.59 | $ 61,550 |
Top paying nonmetropolitan areas for Marriage and Family Therapists:
| Nonmetropolitan area | Employment (1) | Employment per thousand jobs | Location quotient (9) | Hourly mean wage | Annual mean wage (2) |
|---|---|---|---|---|---|
| Southeast Minnesota nonmetropolitan area | 120 | 0.79 | 2.04 | $ 33.01 | $ 68,660 |
| Northwest Colorado nonmetropolitan area | 60 | 0.54 | 1.40 | $ 31.31 | $ 65,120 |
| Southeast Oklahoma nonmetropolitan area | 110 | 0.68 | 1.75 | $ 30.79 | $ 64,030 |
| Southwest Colorado nonmetropolitan area | 50 | 0.51 | 1.31 | $ 30.35 | $ 63,130 |
| Northwest Minnesota nonmetropolitan area | 140 | 0.79 | 2.03 | $ 29.59 | $ 61,550 |
These estimates are calculated with data collected from employers in all industry sectors, all metropolitan and nonmetropolitan areas, and all states and the District of Columbia. The top employment and wage figures are provided above. The complete list is available in the downloadable XLS files.
The percentile wage estimate is the value of a wage below which a certain percent of workers fall. The median wage is the 50th percentile wage estimate—50 percent of workers earn less than the median and 50 percent of workers earn more than the median. More about percentile wages.
(1) Estimates for detailed occupations do not sum to the totals because the totals include occupations not shown separately. Estimates do not include self-employed workers.
(2) Annual wages have been calculated by multiplying the hourly mean wage by a "year-round, full-time" hours figure of 2,080 hours; for those occupations where there is not an hourly wage published, the annual wage has been directly calculated from the reported survey data.
(3) The relative standard error (RSE) is a measure of the reliability of a survey statistic. The smaller the relative standard error, the more precise the estimate.
(8) Estimate not released.
(9) The location quotient is the ratio of the area concentration of occupational employment to the national average concentration. A location quotient greater than one indicates the occupation has a higher share of employment than average, and a location quotient less than one indicates the occupation is less prevalent in the area than average.
Other OEWS estimates and related information:
May 2021 National Occupational Employment and Wage Estimates
May 2021 State Occupational Employment and Wage Estimates
May 2021 Metropolitan and Nonmetropolitan Area Occupational Employment and Wage Estimates
May 2021 National Industry-Specific Occupational Employment and Wage Estimates
Last Modified Date: March 31, 2022