
An official website of the United States government
An official website of the United States government
The .gov means it's official.
Federal government websites often end in .gov or .mil. Before sharing sensitive information,
make sure you're on a federal government site.
The site is secure.
The
https:// ensures that you are connecting to the official website and that any
information you provide is encrypted and transmitted securely.
Assist lawyers by investigating facts, preparing legal documents, or researching legal precedent. Conduct research to support a legal proceeding, to formulate a defense, or to initiate legal action. Excludes �Legal Secretaries and Administrative Assistants� (43-6012).
Employment estimate and mean wage estimates for Paralegals and Legal Assistants:
| Employment (1) | Employment RSE (3) |
Mean hourly wage |
Mean annual wage (2) |
Wage RSE (3) |
|---|---|---|---|---|
| 336,250 | 1.8 % | $ 28.04 | $ 58,330 | 1.1 % |
Percentile wage estimates for Paralegals and Legal Assistants:
| Percentile | 10% | 25% | 50% (Median) |
75% | 90% |
|---|---|---|---|---|---|
| Hourly Wage | $ 17.51 | $ 21.82 | $ 27.03 | $ 34.98 | $ 42.61 |
| Annual Wage (2) | $ 36,410 | $ 45,390 | $ 56,230 | $ 72,750 | $ 88,640 |
Industries with the highest published employment and wages for Paralegals and Legal Assistants are provided. For a list of all industries with employment in Paralegals and Legal Assistants, see the Create Customized Tables function.
Industries with the highest levels of employment in Paralegals and Legal Assistants:
| Industry | Employment (1) | Percent of industry employment | Hourly mean wage | Annual mean wage (2) |
|---|---|---|---|---|
| Legal Services | 258,310 | 22.64 | $ 26.78 | $ 55,690 |
| Federal Executive Branch (OEWS Designation) | 15,480 | 0.73 | $ 35.38 | $ 73,580 |
| Local Government, excluding schools and hospitals (OEWS Designation) | 14,890 | 0.28 | $ 27.78 | $ 57,770 |
| State Government, excluding schools and hospitals (OEWS Designation) | 9,240 | 0.42 | $ 25.99 | $ 54,060 |
| Management of Companies and Enterprises | 7,250 | 0.29 | $ 37.73 | $ 78,480 |
Industries with the highest concentration of employment in Paralegals and Legal Assistants:
| Industry | Employment (1) | Percent of industry employment | Hourly mean wage | Annual mean wage (2) |
|---|---|---|---|---|
| Legal Services | 258,310 | 22.64 | $ 26.78 | $ 55,690 |
| Lessors of Nonfinancial Intangible Assets (except Copyrighted Works) | 160 | 0.81 | $ 40.98 | $ 85,240 |
| Federal Executive Branch (OEWS Designation) | 15,480 | 0.73 | $ 35.38 | $ 73,580 |
| Other Investment Pools and Funds | 70 | 0.53 | $ 32.00 | $ 66,550 |
| Insurance Carriers | 5,050 | 0.42 | $ 33.46 | $ 69,600 |
Top paying industries for Paralegals and Legal Assistants:
| Industry | Employment (1) | Percent of industry employment | Hourly mean wage | Annual mean wage (2) |
|---|---|---|---|---|
| Merchant Wholesalers, Nondurable Goods (4244 and 4248 only) | 40 | (7) | $ 54.19 | $ 112,700 |
| Petroleum and Coal Products Manufacturing | 30 | 0.03 | $ 49.99 | $ 103,990 |
| Scientific Research and Development Services | 700 | 0.09 | $ 47.01 | $ 97,780 |
| Computer and Peripheral Equipment Manufacturing | 40 | 0.03 | $ 44.83 | $ 93,240 |
| Aerospace Product and Parts Manufacturing | 100 | 0.02 | $ 43.65 | $ 90,800 |
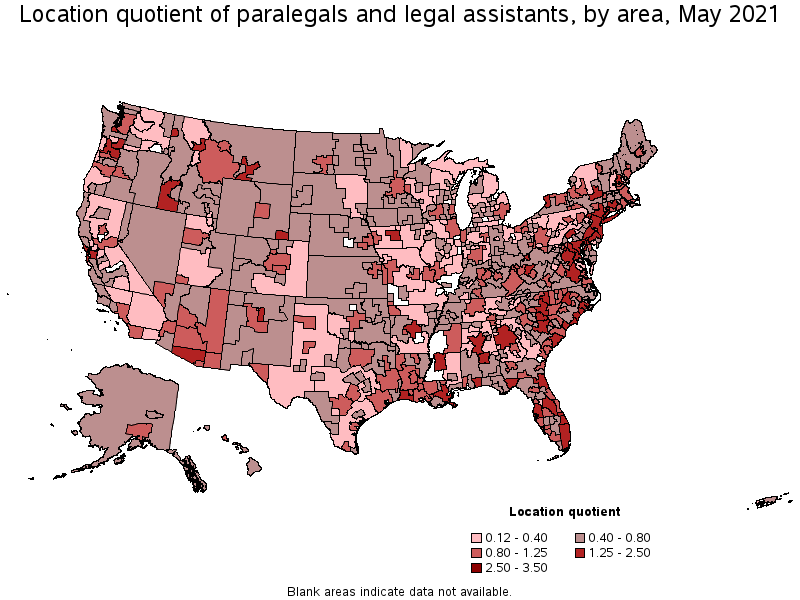
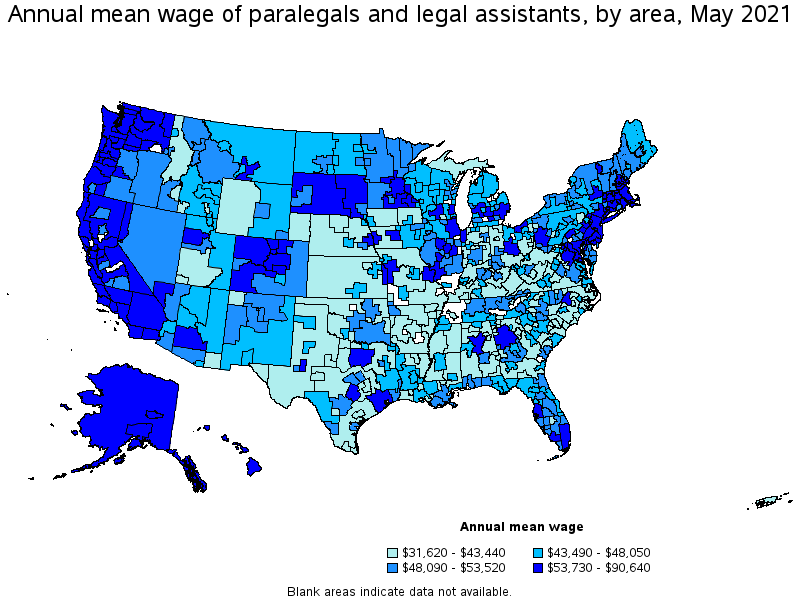
States and areas with the highest published employment, location quotients, and wages for Paralegals and Legal Assistants are provided. For a list of all areas with employment in Paralegals and Legal Assistants, see the Create Customized Tables function.
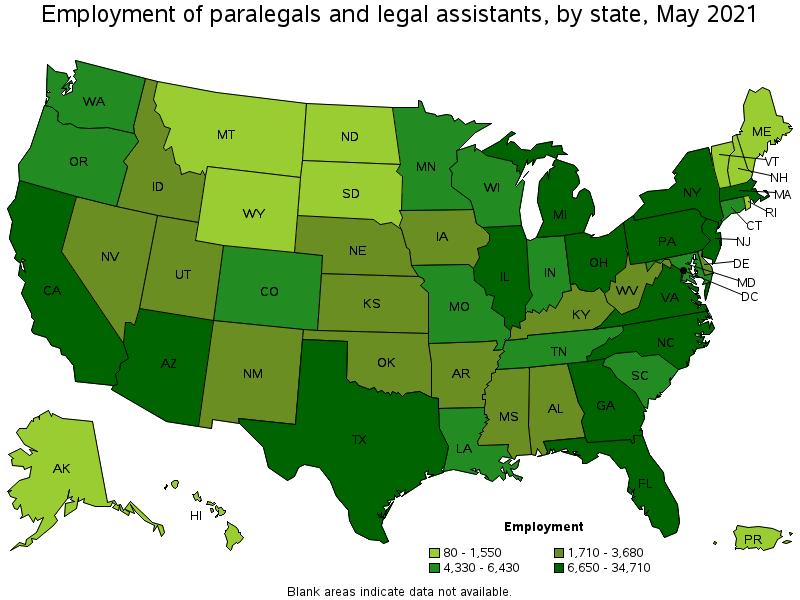
States with the highest employment level in Paralegals and Legal Assistants:
| State | Employment (1) | Employment per thousand jobs | Location quotient (9) | Hourly mean wage | Annual mean wage (2) |
|---|---|---|---|---|---|
| California | 34,710 | 2.10 | 0.88 | $ 33.79 | $ 70,290 |
| New York | 30,400 | 3.51 | 1.47 | $ 30.42 | $ 63,270 |
| Florida | 30,000 | 3.49 | 1.46 | $ 25.93 | $ 53,940 |
| Texas | 25,780 | 2.11 | 0.88 | $ 26.94 | $ 56,030 |
| Illinois | 13,630 | 2.43 | 1.02 | $ 29.29 | $ 60,920 |
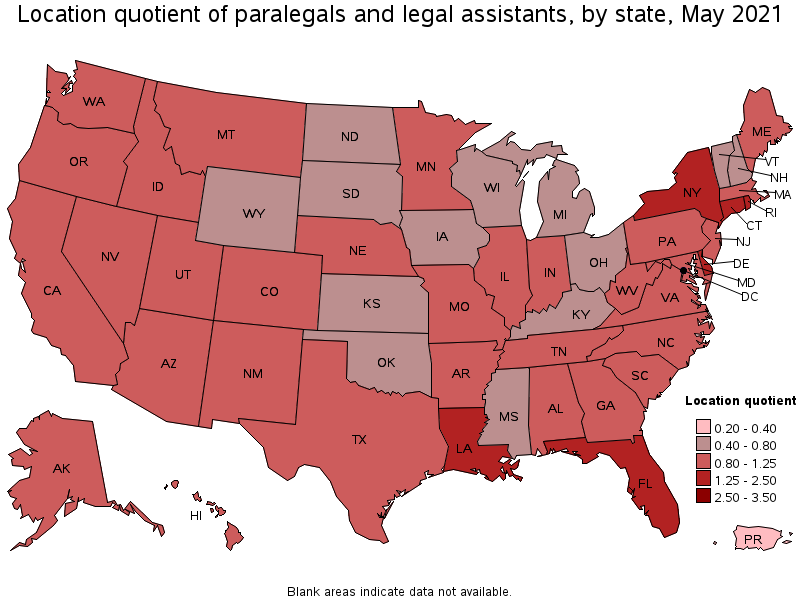
States with the highest concentration of jobs and location quotients in Paralegals and Legal Assistants:
| State | Employment (1) | Employment per thousand jobs | Location quotient (9) | Hourly mean wage | Annual mean wage (2) |
|---|---|---|---|---|---|
| District of Columbia | 5,540 | 8.36 | 3.50 | $ 40.11 | $ 83,420 |
| Delaware | 2,120 | 4.86 | 2.04 | $ 28.58 | $ 59,450 |
| New York | 30,400 | 3.51 | 1.47 | $ 30.42 | $ 63,270 |
| Florida | 30,000 | 3.49 | 1.46 | $ 25.93 | $ 53,940 |
| Rhode Island | 1,550 | 3.39 | 1.42 | $ 28.70 | $ 59,700 |
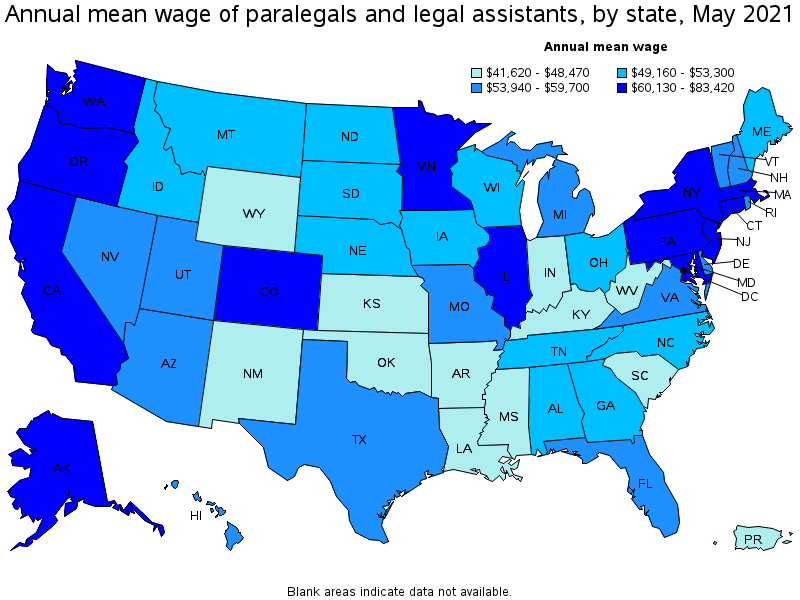
Top paying states for Paralegals and Legal Assistants:
| State | Employment (1) | Employment per thousand jobs | Location quotient (9) | Hourly mean wage | Annual mean wage (2) |
|---|---|---|---|---|---|
| District of Columbia | 5,540 | 8.36 | 3.50 | $ 40.11 | $ 83,420 |
| Washington | 6,430 | 2.01 | 0.84 | $ 34.57 | $ 71,900 |
| California | 34,710 | 2.10 | 0.88 | $ 33.79 | $ 70,290 |
| Massachusetts | 8,430 | 2.48 | 1.04 | $ 32.12 | $ 66,820 |
| New Jersey | 7,590 | 1.97 | 0.83 | $ 31.71 | $ 65,950 |
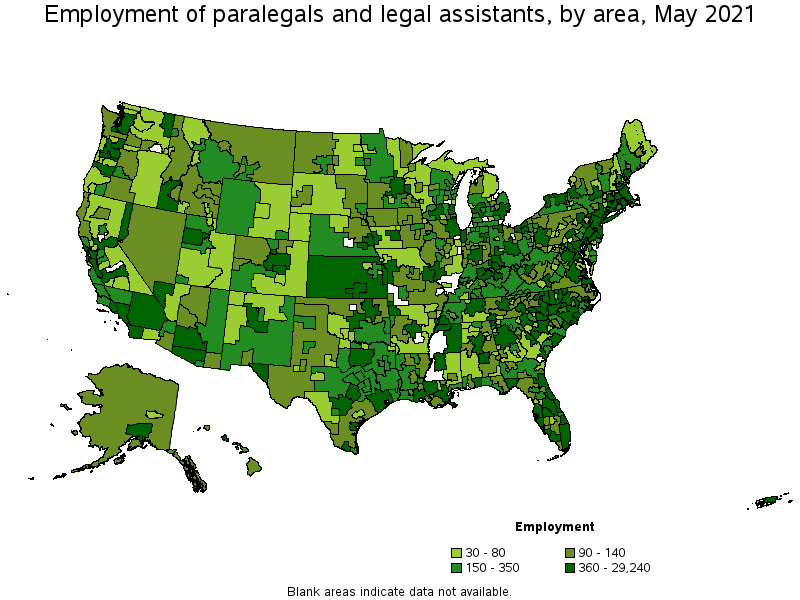
Metropolitan areas with the highest employment level in Paralegals and Legal Assistants:
| Metropolitan area | Employment (1) | Employment per thousand jobs | Location quotient (9) | Hourly mean wage | Annual mean wage (2) |
|---|---|---|---|---|---|
| New York-Newark-Jersey City, NY-NJ-PA | 29,240 | 3.37 | 1.41 | $ 32.05 | $ 66,660 |
| Los Angeles-Long Beach-Anaheim, CA | 14,810 | 2.59 | 1.09 | $ 33.26 | $ 69,180 |
| Chicago-Naperville-Elgin, IL-IN-WI | 11,990 | 2.83 | 1.19 | $ 29.77 | $ 61,920 |
| Miami-Fort Lauderdale-West Palm Beach, FL | 11,190 | 4.56 | 1.91 | $ 27.97 | $ 58,180 |
| Washington-Arlington-Alexandria, DC-VA-MD-WV | 10,860 | 3.70 | 1.55 | $ 35.90 | $ 74,670 |
| Philadelphia-Camden-Wilmington, PA-NJ-DE-MD | 9,600 | 3.62 | 1.52 | $ 31.49 | $ 65,500 |
| Atlanta-Sandy Springs-Roswell, GA | 8,450 | 3.27 | 1.37 | $ 26.68 | $ 55,490 |
| San Francisco-Oakland-Hayward, CA | 7,660 | 3.42 | 1.43 | $ 36.37 | $ 75,640 |
| Dallas-Fort Worth-Arlington, TX | 7,480 | 2.08 | 0.87 | $ 29.46 | $ 61,280 |
| Houston-The Woodlands-Sugar Land, TX | 7,150 | 2.47 | 1.03 | $ 28.84 | $ 59,980 |
Metropolitan areas with the highest concentration of jobs and location quotients in Paralegals and Legal Assistants:
| Metropolitan area | Employment (1) | Employment per thousand jobs | Location quotient (9) | Hourly mean wage | Annual mean wage (2) |
|---|---|---|---|---|---|
| New Orleans-Metairie, LA | 2,640 | 5.22 | 2.19 | $ 24.85 | $ 51,690 |
| Charleston, WV | 490 | 4.97 | 2.08 | $ 25.58 | $ 53,210 |
| Miami-Fort Lauderdale-West Palm Beach, FL | 11,190 | 4.56 | 1.91 | $ 27.97 | $ 58,180 |
| Columbia, SC | 1,660 | 4.56 | 1.91 | $ 22.98 | $ 47,790 |
| Tallahassee, FL | 760 | 4.44 | 1.86 | $ 22.78 | $ 47,390 |
| Santa Fe, NM | 240 | 4.27 | 1.79 | $ 23.82 | $ 49,550 |
| Jackson, MS | 1,030 | 4.20 | 1.76 | $ 21.67 | $ 45,060 |
| Jacksonville, NC | 200 | 4.17 | 1.75 | $ 20.96 | $ 43,600 |
| Port St. Lucie, FL | 620 | 4.13 | 1.73 | $ 23.49 | $ 48,850 |
| Little Rock-North Little Rock-Conway, AR | 1,340 | 4.13 | 1.73 | $ 19.95 | $ 41,500 |
Top paying metropolitan areas for Paralegals and Legal Assistants:
| Metropolitan area | Employment (1) | Employment per thousand jobs | Location quotient (9) | Hourly mean wage | Annual mean wage (2) |
|---|---|---|---|---|---|
| San Jose-Sunnyvale-Santa Clara, CA | 1,930 | 1.80 | 0.75 | $ 43.58 | $ 90,640 |
| Seattle-Tacoma-Bellevue, WA | 4,560 | 2.38 | 1.00 | $ 37.00 | $ 76,960 |
| San Francisco-Oakland-Hayward, CA | 7,660 | 3.42 | 1.43 | $ 36.37 | $ 75,640 |
| Washington-Arlington-Alexandria, DC-VA-MD-WV | 10,860 | 3.70 | 1.55 | $ 35.90 | $ 74,670 |
| Los Angeles-Long Beach-Anaheim, CA | 14,810 | 2.59 | 1.09 | $ 33.26 | $ 69,180 |
| Boston-Cambridge-Nashua, MA-NH | 6,760 | 2.62 | 1.10 | $ 33.22 | $ 69,090 |
| San Diego-Carlsbad, CA | 2,890 | 2.08 | 0.87 | $ 33.07 | $ 68,790 |
| Santa Rosa, CA | 310 | 1.62 | 0.68 | $ 33.03 | $ 68,700 |
| Portland-Vancouver-Hillsboro, OR-WA | 3,630 | 3.23 | 1.36 | $ 32.50 | $ 67,590 |
| Vallejo-Fairfield, CA | 80 | 0.65 | 0.27 | $ 32.47 | $ 67,540 |
Nonmetropolitan areas with the highest employment in Paralegals and Legal Assistants:
| Nonmetropolitan area | Employment (1) | Employment per thousand jobs | Location quotient (9) | Hourly mean wage | Annual mean wage (2) |
|---|---|---|---|---|---|
| Piedmont North Carolina nonmetropolitan area | 520 | 2.11 | 0.89 | $ 18.97 | $ 39,450 |
| Northeast Mississippi nonmetropolitan area | 430 | 1.93 | 0.81 | $ 17.70 | $ 36,810 |
| Kansas nonmetropolitan area | 390 | 1.03 | 0.43 | $ 17.19 | $ 35,750 |
| Southeast Coastal North Carolina nonmetropolitan area | 360 | 1.51 | 0.63 | $ 18.61 | $ 38,710 |
| North Texas Region of Texas nonmetropolitan area | 300 | 1.14 | 0.48 | $ 19.32 | $ 40,180 |
Nonmetropolitan areas with the highest concentration of jobs and location quotients in Paralegals and Legal Assistants:
| Nonmetropolitan area | Employment (1) | Employment per thousand jobs | Location quotient (9) | Hourly mean wage | Annual mean wage (2) |
|---|---|---|---|---|---|
| Central New Hampshire nonmetropolitan area | 270 | 3.07 | 1.29 | $ 27.70 | $ 57,620 |
| Central Louisiana nonmetropolitan area | 190 | 2.61 | 1.09 | $ 21.24 | $ 44,190 |
| Arizona nonmetropolitan area | 210 | 2.30 | 0.96 | $ 21.73 | $ 45,200 |
| Northeast South Carolina nonmetropolitan area | 210 | 2.25 | 0.94 | $ 19.53 | $ 40,620 |
| Piedmont North Carolina nonmetropolitan area | 520 | 2.11 | 0.89 | $ 18.97 | $ 39,450 |
Top paying nonmetropolitan areas for Paralegals and Legal Assistants:
| Nonmetropolitan area | Employment (1) | Employment per thousand jobs | Location quotient (9) | Hourly mean wage | Annual mean wage (2) |
|---|---|---|---|---|---|
| Northwest Colorado nonmetropolitan area | 140 | 1.16 | 0.49 | $ 34.30 | $ 71,350 |
| Eastern Sierra-Mother Lode Region of California nonmetropolitan area | 40 | 0.65 | 0.27 | $ 32.83 | $ 68,280 |
| Massachusetts nonmetropolitan area | 100 | 1.71 | 0.71 | $ 31.66 | $ 65,860 |
| Hawaii / Kauai nonmetropolitan area | 140 | 1.62 | 0.68 | $ 30.82 | $ 64,100 |
| Alaska nonmetropolitan area | 140 | 1.46 | 0.61 | $ 30.33 | $ 63,080 |
These estimates are calculated with data collected from employers in all industry sectors, all metropolitan and nonmetropolitan areas, and all states and the District of Columbia. The top employment and wage figures are provided above. The complete list is available in the downloadable XLS files.
The percentile wage estimate is the value of a wage below which a certain percent of workers fall. The median wage is the 50th percentile wage estimate—50 percent of workers earn less than the median and 50 percent of workers earn more than the median. More about percentile wages.
(1) Estimates for detailed occupations do not sum to the totals because the totals include occupations not shown separately. Estimates do not include self-employed workers.
(2) Annual wages have been calculated by multiplying the hourly mean wage by a "year-round, full-time" hours figure of 2,080 hours; for those occupations where there is not an hourly wage published, the annual wage has been directly calculated from the reported survey data.
(3) The relative standard error (RSE) is a measure of the reliability of a survey statistic. The smaller the relative standard error, the more precise the estimate.
(7) The value is less than .005 percent of industry employment.
(9) The location quotient is the ratio of the area concentration of occupational employment to the national average concentration. A location quotient greater than one indicates the occupation has a higher share of employment than average, and a location quotient less than one indicates the occupation is less prevalent in the area than average.
Other OEWS estimates and related information:
May 2021 National Occupational Employment and Wage Estimates
May 2021 State Occupational Employment and Wage Estimates
May 2021 Metropolitan and Nonmetropolitan Area Occupational Employment and Wage Estimates
May 2021 National Industry-Specific Occupational Employment and Wage Estimates
Last Modified Date: March 31, 2022