
An official website of the United States government
An official website of the United States government
The .gov means it's official.
Federal government websites often end in .gov or .mil. Before sharing sensitive information,
make sure you're on a federal government site.
The site is secure.
The
https:// ensures that you are connecting to the official website and that any
information you provide is encrypted and transmitted securely.
Teach or instruct individuals or groups for the primary purpose of self-enrichment or recreation, rather than for an occupational objective, educational attainment, competition, or fitness. Excludes �Coaches and Scouts� (27-2022) and �Exercise Trainers and Group Fitness Instructors� (39-9031). Flight instructors are included with �Aircraft Pilots and Flight Engineers� (53-2010).
Employment estimate and mean wage estimates for Self-Enrichment Teachers:
| Employment (1) | Employment RSE (3) |
Mean hourly wage |
Mean annual wage (2) |
Wage RSE (3) |
|---|---|---|---|---|
| 216,910 | 1.6 % | $ 23.67 | $ 49,230 | 1.1 % |
Percentile wage estimates for Self-Enrichment Teachers:
| Percentile | 10% | 25% | 50% (Median) |
75% | 90% |
|---|---|---|---|---|---|
| Hourly Wage | $ 11.47 | $ 14.38 | $ 20.95 | $ 28.81 | $ 37.82 |
| Annual Wage (2) | $ 23,860 | $ 29,900 | $ 43,580 | $ 59,920 | $ 78,660 |
Industries with the highest published employment and wages for Self-Enrichment Teachers are provided. For a list of all industries with employment in Self-Enrichment Teachers, see the Create Customized Tables function.
Industries with the highest levels of employment in Self-Enrichment Teachers:
| Industry | Employment (1) | Percent of industry employment | Hourly mean wage | Annual mean wage (2) |
|---|---|---|---|---|
| Other Schools and Instruction | 114,020 | 28.66 | $ 22.93 | $ 47,700 |
| Other Amusement and Recreation Industries | 12,280 | 1.11 | $ 18.96 | $ 39,430 |
| Elementary and Secondary Schools | 11,040 | 0.14 | $ 27.44 | $ 57,080 |
| Local Government, excluding schools and hospitals (OEWS Designation) | 6,930 | 0.13 | $ 20.21 | $ 42,040 |
| Individual and Family Services | 6,540 | 0.25 | $ 23.26 | $ 48,370 |
Industries with the highest concentration of employment in Self-Enrichment Teachers:
| Industry | Employment (1) | Percent of industry employment | Hourly mean wage | Annual mean wage (2) |
|---|---|---|---|---|
| Other Schools and Instruction | 114,020 | 28.66 | $ 22.93 | $ 47,700 |
| Performing Arts Companies | 5,810 | 8.39 | $ 28.19 | $ 58,630 |
| Business Schools and Computer and Management Training | 3,590 | 5.03 | $ 24.52 | $ 51,000 |
| Museums, Historical Sites, and Similar Institutions | 4,540 | 3.44 | $ 19.96 | $ 41,510 |
| Religious Organizations | 5,230 | 2.92 | $ 34.96 | $ 72,720 |
Top paying industries for Self-Enrichment Teachers:
| Industry | Employment (1) | Percent of industry employment | Hourly mean wage | Annual mean wage (2) |
|---|---|---|---|---|
| Junior Colleges | 3,390 | 0.55 | $ 40.46 | $ 84,160 |
| Other Personal Services | (8) | (8) | $ 37.45 | $ 77,890 |
| Religious Organizations | 5,230 | 2.92 | $ 34.96 | $ 72,720 |
| Promoters of Performing Arts, Sports, and Similar Events | 990 | 1.27 | $ 33.13 | $ 68,900 |
| Grantmaking and Giving Services | 1,240 | 0.89 | $ 33.07 | $ 68,790 |
States and areas with the highest published employment, location quotients, and wages for Self-Enrichment Teachers are provided. For a list of all areas with employment in Self-Enrichment Teachers, see the Create Customized Tables function.
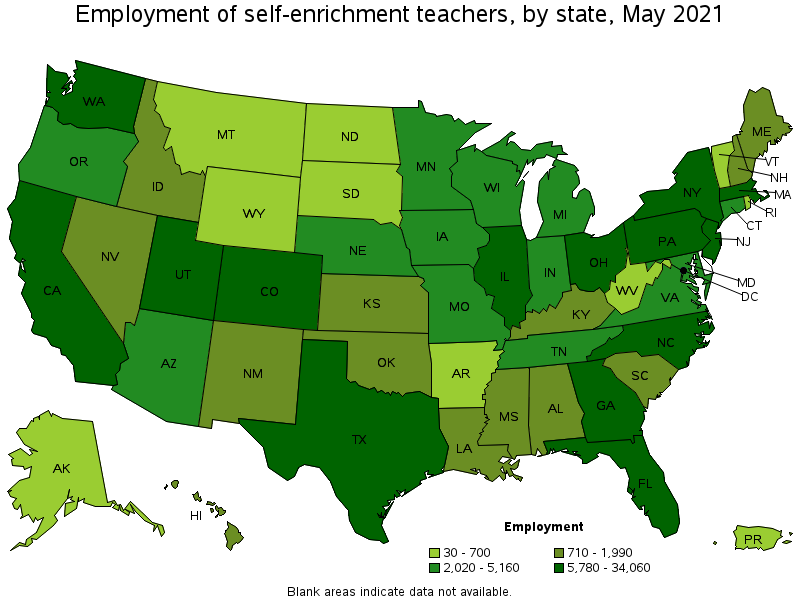
States with the highest employment level in Self-Enrichment Teachers:
| State | Employment (1) | Employment per thousand jobs | Location quotient (9) | Hourly mean wage | Annual mean wage (2) |
|---|---|---|---|---|---|
| California | 34,060 | 2.06 | 1.34 | $ 26.60 | $ 55,330 |
| New York | 26,520 | 3.06 | 1.99 | $ 33.59 | $ 69,860 |
| Texas | 10,030 | 0.82 | 0.53 | $ 17.76 | $ 36,930 |
| Florida | 9,470 | 1.10 | 0.71 | $ 20.07 | $ 41,740 |
| Massachusetts | 8,490 | 2.50 | 1.62 | $ 26.88 | $ 55,910 |
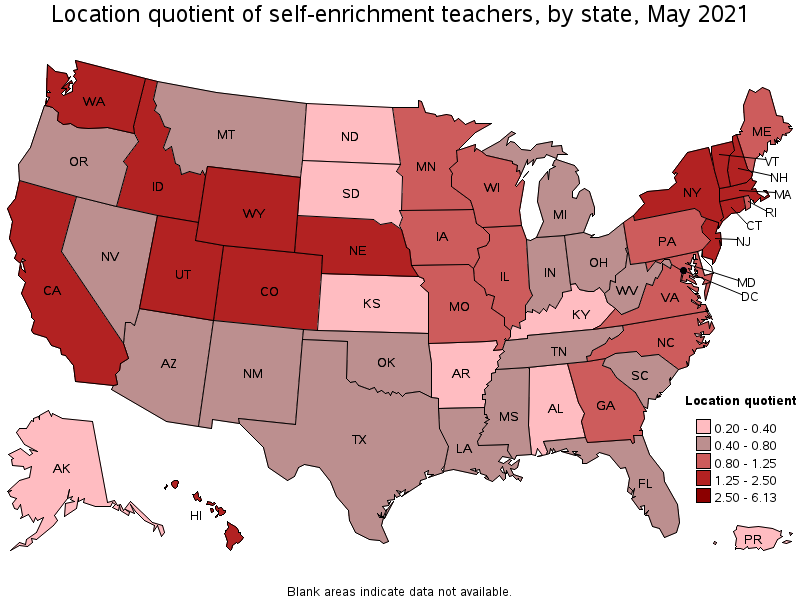
States with the highest concentration of jobs and location quotients in Self-Enrichment Teachers:
| State | Employment (1) | Employment per thousand jobs | Location quotient (9) | Hourly mean wage | Annual mean wage (2) |
|---|---|---|---|---|---|
| Utah | 5,780 | 3.72 | 2.41 | $ 21.26 | $ 44,210 |
| New York | 26,520 | 3.06 | 1.99 | $ 33.59 | $ 69,860 |
| Hawaii | 1,530 | 2.79 | 1.81 | $ 27.01 | $ 56,170 |
| Colorado | 7,190 | 2.74 | 1.78 | $ 20.87 | $ 43,410 |
| Massachusetts | 8,490 | 2.50 | 1.62 | $ 26.88 | $ 55,910 |
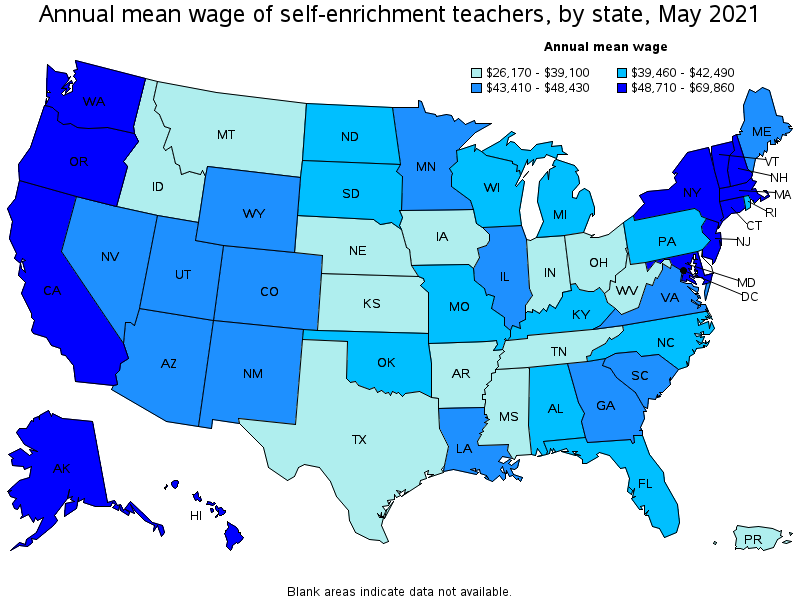
Top paying states for Self-Enrichment Teachers:
| State | Employment (1) | Employment per thousand jobs | Location quotient (9) | Hourly mean wage | Annual mean wage (2) |
|---|---|---|---|---|---|
| New York | 26,520 | 3.06 | 1.99 | $ 33.59 | $ 69,860 |
| New Jersey | 8,460 | 2.20 | 1.43 | $ 27.08 | $ 56,320 |
| Hawaii | 1,530 | 2.79 | 1.81 | $ 27.01 | $ 56,170 |
| Massachusetts | 8,490 | 2.50 | 1.62 | $ 26.88 | $ 55,910 |
| California | 34,060 | 2.06 | 1.34 | $ 26.60 | $ 55,330 |
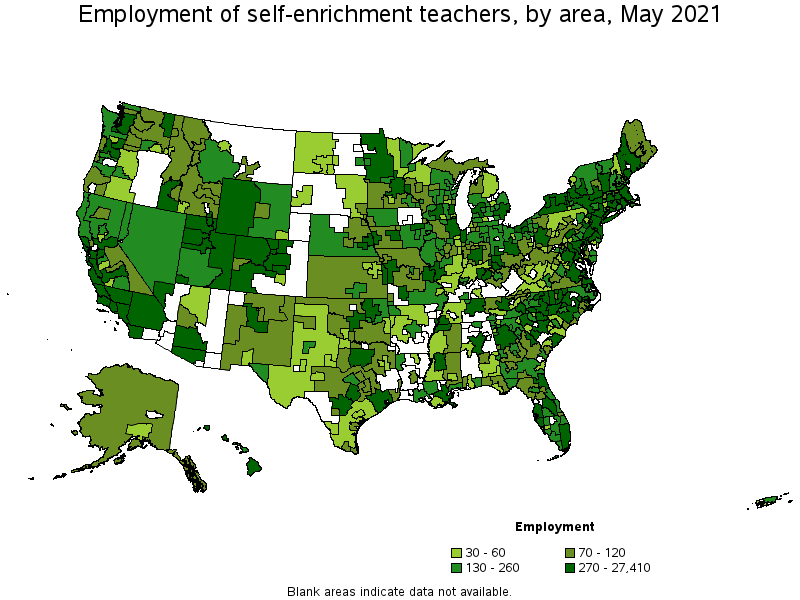
Metropolitan areas with the highest employment level in Self-Enrichment Teachers:
| Metropolitan area | Employment (1) | Employment per thousand jobs | Location quotient (9) | Hourly mean wage | Annual mean wage (2) |
|---|---|---|---|---|---|
| New York-Newark-Jersey City, NY-NJ-PA | 27,410 | 3.16 | 2.05 | $ 33.82 | $ 70,350 |
| Los Angeles-Long Beach-Anaheim, CA | 11,170 | 1.95 | 1.27 | $ 27.08 | $ 56,330 |
| Chicago-Naperville-Elgin, IL-IN-WI | 6,810 | 1.61 | 1.04 | $ 22.67 | $ 47,150 |
| Boston-Cambridge-Nashua, MA-NH | 6,530 | 2.52 | 1.64 | $ 27.43 | $ 57,060 |
| San Francisco-Oakland-Hayward, CA | 6,450 | 2.88 | 1.87 | $ 28.86 | $ 60,020 |
| Atlanta-Sandy Springs-Roswell, GA | 4,500 | 1.74 | 1.13 | $ 24.22 | $ 50,370 |
| Philadelphia-Camden-Wilmington, PA-NJ-DE-MD | 4,430 | 1.67 | 1.08 | $ 21.99 | $ 45,740 |
| Washington-Arlington-Alexandria, DC-VA-MD-WV | 4,350 | 1.48 | 0.96 | $ 26.15 | $ 54,390 |
| Seattle-Tacoma-Bellevue, WA | 4,140 | 2.16 | 1.40 | $ 24.52 | $ 51,000 |
| San Diego-Carlsbad, CA | 3,730 | 2.69 | 1.74 | $ 24.76 | $ 51,500 |
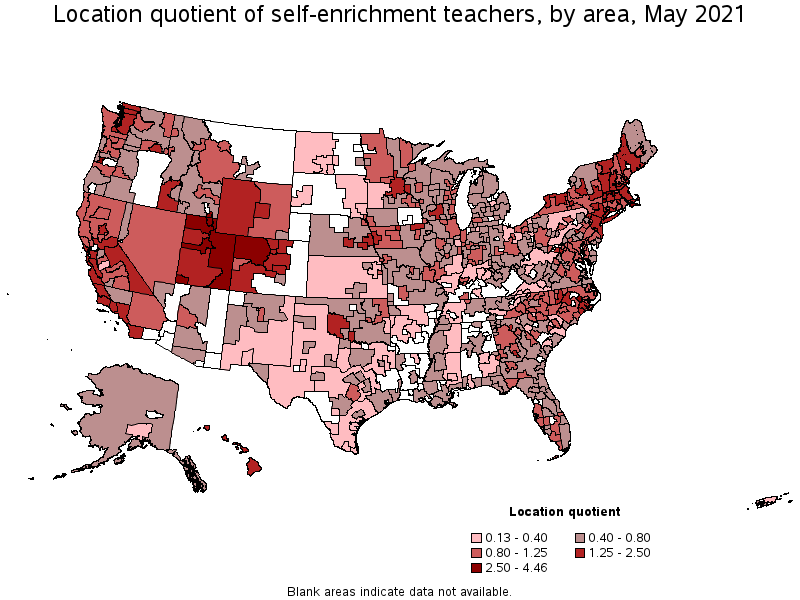
Metropolitan areas with the highest concentration of jobs and location quotients in Self-Enrichment Teachers:
| Metropolitan area | Employment (1) | Employment per thousand jobs | Location quotient (9) | Hourly mean wage | Annual mean wage (2) |
|---|---|---|---|---|---|
| Provo-Orem, UT | 1,380 | 5.07 | 3.30 | $ 20.62 | $ 42,880 |
| Corvallis, OR | 170 | 4.88 | 3.17 | $ 23.38 | $ 48,640 |
| St. George, UT | 320 | 4.25 | 2.76 | $ 17.69 | $ 36,790 |
| Logan, UT-ID | 270 | 4.19 | 2.72 | $ 17.71 | $ 36,830 |
| Ogden-Clearfield, UT | 1,110 | 4.14 | 2.69 | $ 21.19 | $ 44,070 |
| Greenville, NC | 300 | 3.96 | 2.57 | $ 16.38 | $ 34,060 |
| Boulder, CO | 690 | 3.79 | 2.46 | $ 22.02 | $ 45,810 |
| Santa Cruz-Watsonville, CA | 340 | 3.60 | 2.34 | $ 26.11 | $ 54,310 |
| Olympia-Tumwater, WA | 380 | 3.43 | 2.23 | $ 24.59 | $ 51,150 |
| Greeley, CO | 330 | 3.28 | 2.13 | $ 19.98 | $ 41,550 |
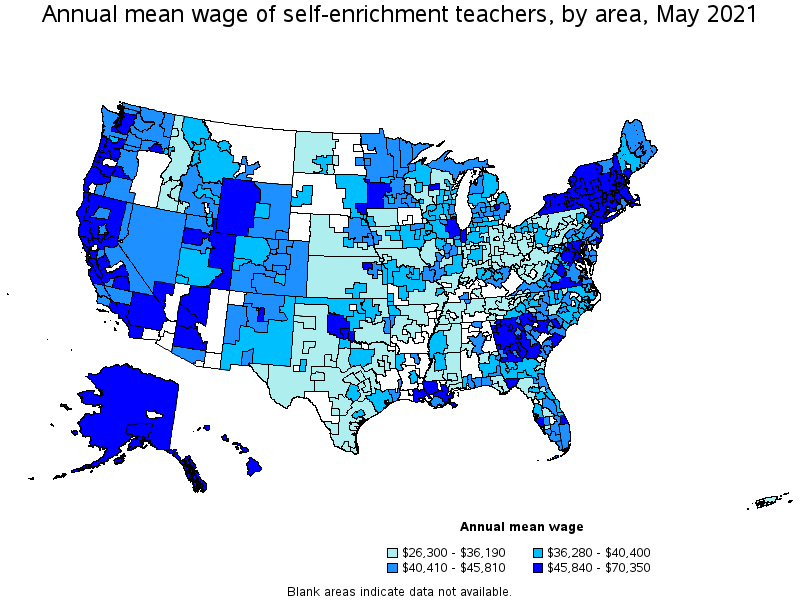
Top paying metropolitan areas for Self-Enrichment Teachers:
| Metropolitan area | Employment (1) | Employment per thousand jobs | Location quotient (9) | Hourly mean wage | Annual mean wage (2) |
|---|---|---|---|---|---|
| New York-Newark-Jersey City, NY-NJ-PA | 27,410 | 3.16 | 2.05 | $ 33.82 | $ 70,350 |
| Kahului-Wailuku-Lahaina, HI | 210 | 3.28 | 2.13 | $ 32.04 | $ 66,650 |
| Utica-Rome, NY | 270 | 2.35 | 1.52 | $ 30.52 | $ 63,470 |
| San Jose-Sunnyvale-Santa Clara, CA | 2,390 | 2.24 | 1.46 | $ 29.34 | $ 61,030 |
| Fresno, CA | 540 | 1.45 | 0.94 | $ 29.14 | $ 60,610 |
| Ithaca, NY | 130 | 2.88 | 1.87 | $ 28.94 | $ 60,190 |
| San Francisco-Oakland-Hayward, CA | 6,450 | 2.88 | 1.87 | $ 28.86 | $ 60,020 |
| Portsmouth, NH-ME | 200 | 2.27 | 1.47 | $ 28.54 | $ 59,360 |
| Burlington-South Burlington, VT | 190 | 1.69 | 1.10 | $ 28.28 | $ 58,820 |
| California-Lexington Park, MD | 60 | 1.27 | 0.82 | $ 28.24 | $ 58,730 |
Nonmetropolitan areas with the highest employment in Self-Enrichment Teachers:
| Nonmetropolitan area | Employment (1) | Employment per thousand jobs | Location quotient (9) | Hourly mean wage | Annual mean wage (2) |
|---|---|---|---|---|---|
| Northwest Colorado nonmetropolitan area | 680 | 5.87 | 3.81 | $ 19.38 | $ 40,300 |
| Eastern Utah nonmetropolitan area | 550 | 6.87 | 4.46 | $ 22.47 | $ 46,740 |
| Southwest Maine nonmetropolitan area | 530 | 2.92 | 1.89 | $ 18.92 | $ 39,340 |
| Piedmont North Carolina nonmetropolitan area | 390 | 1.61 | 1.05 | $ 16.61 | $ 34,540 |
| Western Wyoming nonmetropolitan area | 330 | 3.48 | 2.26 | $ 23.18 | $ 48,210 |
Nonmetropolitan areas with the highest concentration of jobs and location quotients in Self-Enrichment Teachers:
| Nonmetropolitan area | Employment (1) | Employment per thousand jobs | Location quotient (9) | Hourly mean wage | Annual mean wage (2) |
|---|---|---|---|---|---|
| Eastern Utah nonmetropolitan area | 550 | 6.87 | 4.46 | $ 22.47 | $ 46,740 |
| Northwest Colorado nonmetropolitan area | 680 | 5.87 | 3.81 | $ 19.38 | $ 40,300 |
| Massachusetts nonmetropolitan area | 260 | 4.43 | 2.88 | $ 26.45 | $ 55,010 |
| Western Wyoming nonmetropolitan area | 330 | 3.48 | 2.26 | $ 23.18 | $ 48,210 |
| Southwest Colorado nonmetropolitan area | 320 | 3.27 | 2.13 | $ 19.79 | $ 41,170 |
Top paying nonmetropolitan areas for Self-Enrichment Teachers:
| Nonmetropolitan area | Employment (1) | Employment per thousand jobs | Location quotient (9) | Hourly mean wage | Annual mean wage (2) |
|---|---|---|---|---|---|
| Southwest Oklahoma nonmetropolitan area | 120 | 2.08 | 1.35 | $ 30.19 | $ 62,790 |
| North Valley-Northern Mountains Region of California nonmetropolitan area | 170 | 1.77 | 1.15 | $ 29.58 | $ 61,520 |
| Central New Hampshire nonmetropolitan area | 150 | 1.65 | 1.07 | $ 26.79 | $ 55,730 |
| Massachusetts nonmetropolitan area | 260 | 4.43 | 2.88 | $ 26.45 | $ 55,010 |
| West Central-Southwest New Hampshire nonmetropolitan area | 200 | 2.08 | 1.35 | $ 25.65 | $ 53,350 |
These estimates are calculated with data collected from employers in all industry sectors, all metropolitan and nonmetropolitan areas, and all states and the District of Columbia. The top employment and wage figures are provided above. The complete list is available in the downloadable XLS files.
The percentile wage estimate is the value of a wage below which a certain percent of workers fall. The median wage is the 50th percentile wage estimate—50 percent of workers earn less than the median and 50 percent of workers earn more than the median. More about percentile wages.
(1) Estimates for detailed occupations do not sum to the totals because the totals include occupations not shown separately. Estimates do not include self-employed workers.
(2) Annual wages have been calculated by multiplying the hourly mean wage by a "year-round, full-time" hours figure of 2,080 hours; for those occupations where there is not an hourly wage published, the annual wage has been directly calculated from the reported survey data.
(3) The relative standard error (RSE) is a measure of the reliability of a survey statistic. The smaller the relative standard error, the more precise the estimate.
(8) Estimate not released.
(9) The location quotient is the ratio of the area concentration of occupational employment to the national average concentration. A location quotient greater than one indicates the occupation has a higher share of employment than average, and a location quotient less than one indicates the occupation is less prevalent in the area than average.
Other OEWS estimates and related information:
May 2021 National Occupational Employment and Wage Estimates
May 2021 State Occupational Employment and Wage Estimates
May 2021 Metropolitan and Nonmetropolitan Area Occupational Employment and Wage Estimates
May 2021 National Industry-Specific Occupational Employment and Wage Estimates
Last Modified Date: March 31, 2022