
An official website of the United States government
An official website of the United States government
The .gov means it's official.
Federal government websites often end in .gov or .mil. Before sharing sensitive information,
make sure you're on a federal government site.
The site is secure.
The
https:// ensures that you are connecting to the official website and that any
information you provide is encrypted and transmitted securely.
Design and develop manufactured products, such as cars, home appliances, and children�s toys. Combine artistic talent with research on product use, marketing, and materials to create the most functional and appealing product design.
Employment estimate and mean wage estimates for Commercial and Industrial Designers:
| Employment (1) | Employment RSE (3) |
Mean hourly wage |
Mean annual wage (2) |
Wage RSE (3) |
|---|---|---|---|---|
| 27,940 | 3.2 % | $ 38.31 | $ 79,680 | 3.1 % |
Percentile wage estimates for Commercial and Industrial Designers:
| Percentile | 10% | 25% | 50% (Median) |
75% | 90% |
|---|---|---|---|---|---|
| Hourly Wage | $ 21.56 | $ 27.44 | $ 37.03 | $ 47.44 | $ 61.64 |
| Annual Wage (2) | $ 44,840 | $ 57,070 | $ 77,030 | $ 98,680 | $ 128,210 |
Industries with the highest published employment and wages for Commercial and Industrial Designers are provided. For a list of all industries with employment in Commercial and Industrial Designers, see the Create Customized Tables function.
Industries with the highest levels of employment in Commercial and Industrial Designers:
| Industry | Employment (1) | Percent of industry employment | Hourly mean wage | Annual mean wage (2) |
|---|---|---|---|---|
| Specialized Design Services | 3,600 | 2.66 | $ 43.21 | $ 89,870 |
| Architectural, Engineering, and Related Services | 3,030 | 0.20 | $ 42.91 | $ 89,260 |
| Management of Companies and Enterprises | 2,190 | 0.09 | $ 44.27 | $ 92,090 |
| Merchant Wholesalers, Durable Goods (4232, 4233, 4235, 4236, 4237, and 4239 only) | 1,890 | 0.14 | $ 33.19 | $ 69,040 |
| Furniture and Related Product Manufacturing (3371 and 3372 only) | 1,640 | 0.49 | $ 28.91 | $ 60,120 |
Industries with the highest concentration of employment in Commercial and Industrial Designers:
| Industry | Employment (1) | Percent of industry employment | Hourly mean wage | Annual mean wage (2) |
|---|---|---|---|---|
| Specialized Design Services | 3,600 | 2.66 | $ 43.21 | $ 89,870 |
| Electric Lighting Equipment Manufacturing | 240 | 0.61 | $ 29.46 | $ 61,290 |
| Furniture and Related Product Manufacturing (3371 and 3372 only) | 1,640 | 0.49 | $ 28.91 | $ 60,120 |
| Fabric Mills | 200 | 0.45 | $ 36.47 | $ 75,850 |
| Other Miscellaneous Manufacturing | 1,180 | 0.43 | $ 33.96 | $ 70,650 |
Top paying industries for Commercial and Industrial Designers:
| Industry | Employment (1) | Percent of industry employment | Hourly mean wage | Annual mean wage (2) |
|---|---|---|---|---|
| Other Information Services | (8) | (8) | $ 64.19 | $ 133,520 |
| Semiconductor and Other Electronic Component Manufacturing | 260 | 0.07 | $ 59.92 | $ 124,630 |
| Other Transportation Equipment Manufacturing | 110 | 0.29 | $ 59.14 | $ 123,010 |
| Communications Equipment Manufacturing | (8) | (8) | $ 57.76 | $ 120,140 |
| Computer and Peripheral Equipment Manufacturing | 300 | 0.19 | $ 54.90 | $ 114,190 |
States and areas with the highest published employment, location quotients, and wages for Commercial and Industrial Designers are provided. For a list of all areas with employment in Commercial and Industrial Designers, see the Create Customized Tables function.
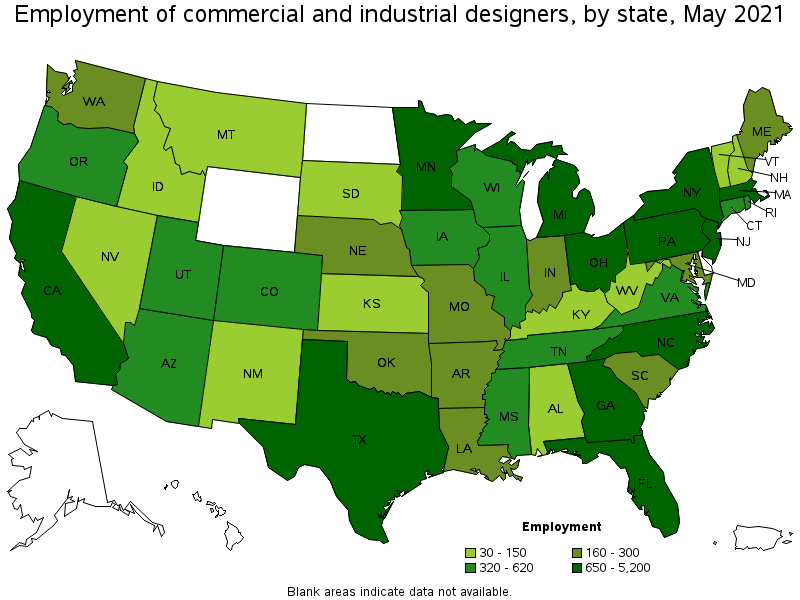
States with the highest employment level in Commercial and Industrial Designers:
| State | Employment (1) | Employment per thousand jobs | Location quotient (9) | Hourly mean wage | Annual mean wage (2) |
|---|---|---|---|---|---|
| California | 5,200 | 0.31 | 1.59 | $ 44.79 | $ 93,170 |
| Michigan | 3,610 | 0.89 | 4.49 | $ 39.05 | $ 81,220 |
| New York | 1,870 | 0.22 | 1.09 | $ 39.50 | $ 82,160 |
| Massachusetts | 1,330 | 0.39 | 1.98 | $ 39.00 | $ 81,110 |
| Ohio | 1,300 | 0.25 | 1.26 | $ 35.22 | $ 73,260 |
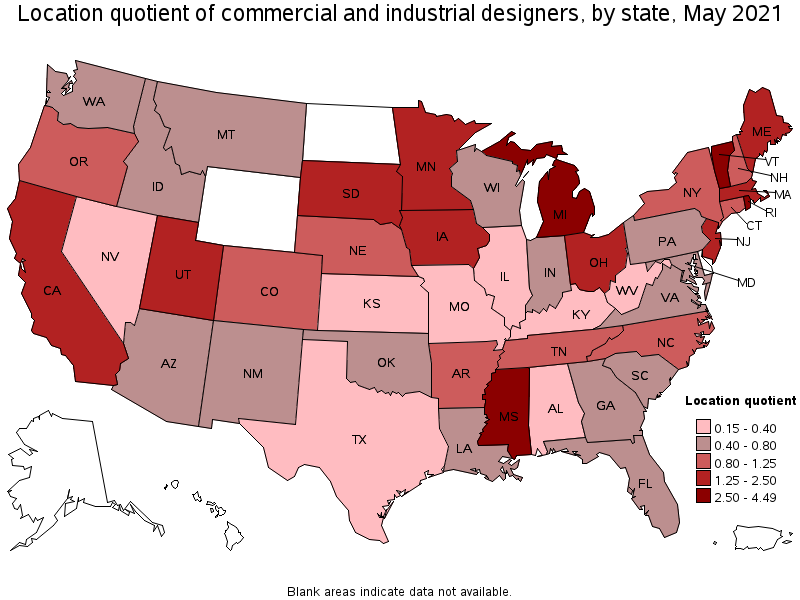
States with the highest concentration of jobs and location quotients in Commercial and Industrial Designers:
| State | Employment (1) | Employment per thousand jobs | Location quotient (9) | Hourly mean wage | Annual mean wage (2) |
|---|---|---|---|---|---|
| Michigan | 3,610 | 0.89 | 4.49 | $ 39.05 | $ 81,220 |
| Rhode Island | 330 | 0.73 | 3.66 | $ 44.53 | $ 92,620 |
| Mississippi | 620 | 0.56 | 2.82 | (8) | (8) |
| Vermont | 150 | 0.54 | 2.70 | $ 38.91 | $ 80,940 |
| Massachusetts | 1,330 | 0.39 | 1.98 | $ 39.00 | $ 81,110 |
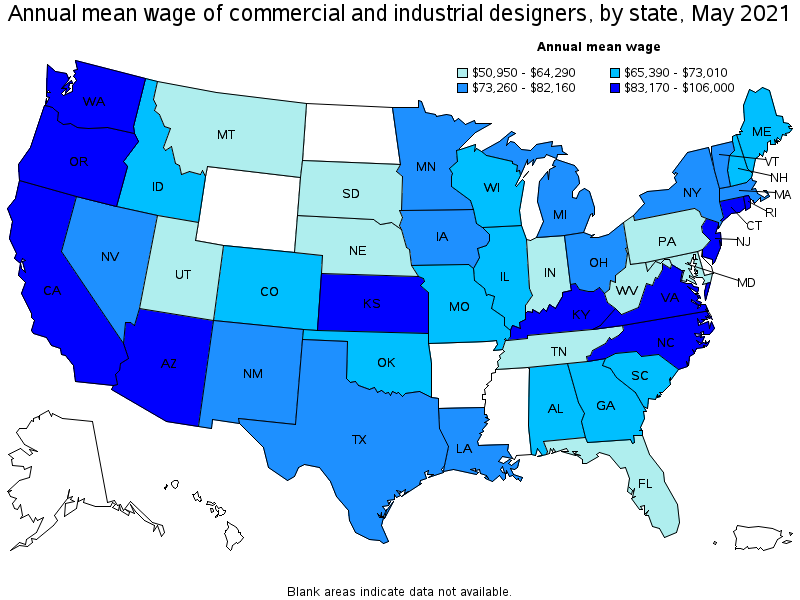
Top paying states for Commercial and Industrial Designers:
| State | Employment (1) | Employment per thousand jobs | Location quotient (9) | Hourly mean wage | Annual mean wage (2) |
|---|---|---|---|---|---|
| Virginia | 490 | 0.13 | 0.66 | $ 50.96 | $ 106,000 |
| Arizona | 350 | 0.12 | 0.61 | $ 50.76 | $ 105,580 |
| Kansas | 90 | 0.07 | 0.33 | $ 45.35 | $ 94,320 |
| California | 5,200 | 0.31 | 1.59 | $ 44.79 | $ 93,170 |
| Rhode Island | 330 | 0.73 | 3.66 | $ 44.53 | $ 92,620 |
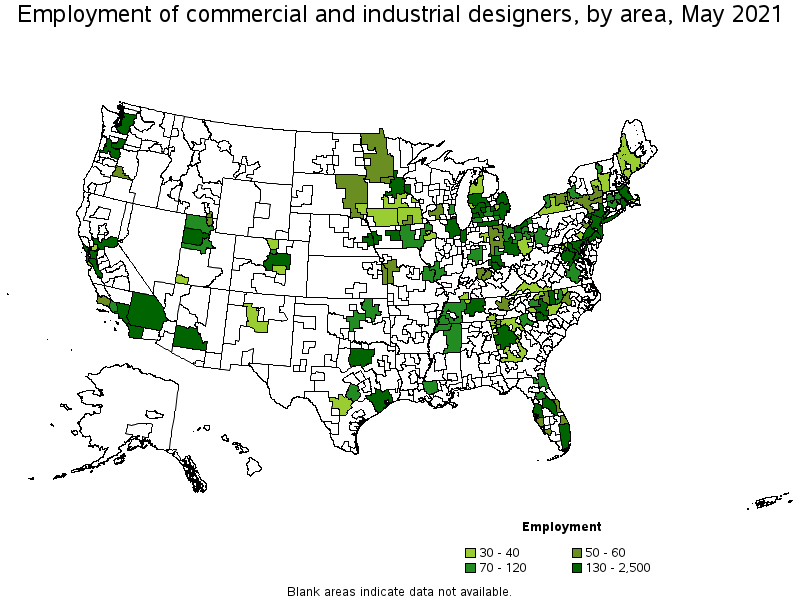
Metropolitan areas with the highest employment level in Commercial and Industrial Designers:
| Metropolitan area | Employment (1) | Employment per thousand jobs | Location quotient (9) | Hourly mean wage | Annual mean wage (2) |
|---|---|---|---|---|---|
| Detroit-Warren-Dearborn, MI | 2,500 | 1.39 | 7.01 | $ 41.26 | $ 85,820 |
| Los Angeles-Long Beach-Anaheim, CA | 2,480 | 0.43 | 2.19 | $ 45.74 | $ 95,140 |
| New York-Newark-Jersey City, NY-NJ-PA | 2,050 | 0.24 | 1.19 | $ 41.27 | $ 85,840 |
| Boston-Cambridge-Nashua, MA-NH | 1,000 | 0.39 | 1.95 | $ 40.14 | $ 83,480 |
| Minneapolis-St. Paul-Bloomington, MN-WI | 720 | 0.40 | 2.00 | $ 37.41 | $ 77,810 |
| San Francisco-Oakland-Hayward, CA | 710 | 0.32 | 1.59 | $ 50.02 | $ 104,050 |
| San Jose-Sunnyvale-Santa Clara, CA | 460 | 0.43 | 2.18 | $ 53.54 | $ 111,370 |
| Atlanta-Sandy Springs-Roswell, GA | 450 | 0.17 | 0.88 | $ 33.14 | $ 68,940 |
| San Diego-Carlsbad, CA | 400 | 0.29 | 1.46 | $ 44.44 | $ 92,440 |
| Providence-Warwick, RI-MA | 390 | 0.73 | 3.68 | $ 43.05 | $ 89,530 |
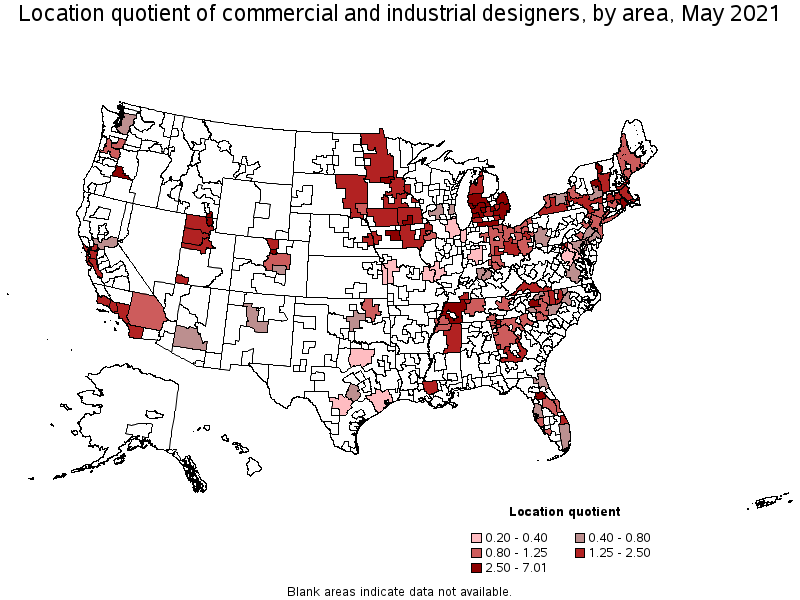
Metropolitan areas with the highest concentration of jobs and location quotients in Commercial and Industrial Designers:
| Metropolitan area | Employment (1) | Employment per thousand jobs | Location quotient (9) | Hourly mean wage | Annual mean wage (2) |
|---|---|---|---|---|---|
| Detroit-Warren-Dearborn, MI | 2,500 | 1.39 | 7.01 | $ 41.26 | $ 85,820 |
| Dalton, GA | 60 | 0.96 | 4.84 | $ 39.29 | $ 81,720 |
| Burlington-South Burlington, VT | 100 | 0.90 | 4.53 | $ 39.45 | $ 82,060 |
| Logan, UT-ID | 50 | 0.80 | 4.05 | $ 29.85 | $ 62,090 |
| Providence-Warwick, RI-MA | 390 | 0.73 | 3.68 | $ 43.05 | $ 89,530 |
| Des Moines-West Des Moines, IA | 260 | 0.72 | 3.61 | $ 45.51 | $ 94,650 |
| Grand Rapids-Wyoming, MI | 360 | 0.70 | 3.54 | $ 35.01 | $ 72,830 |
| Ocala, FL | 70 | 0.65 | 3.29 | $ 26.78 | $ 55,700 |
| Glens Falls, NY | 30 | 0.64 | 3.23 | $ 31.41 | $ 65,340 |
| Muskegon, MI | 30 | 0.60 | 3.01 | $ 24.52 | $ 50,990 |
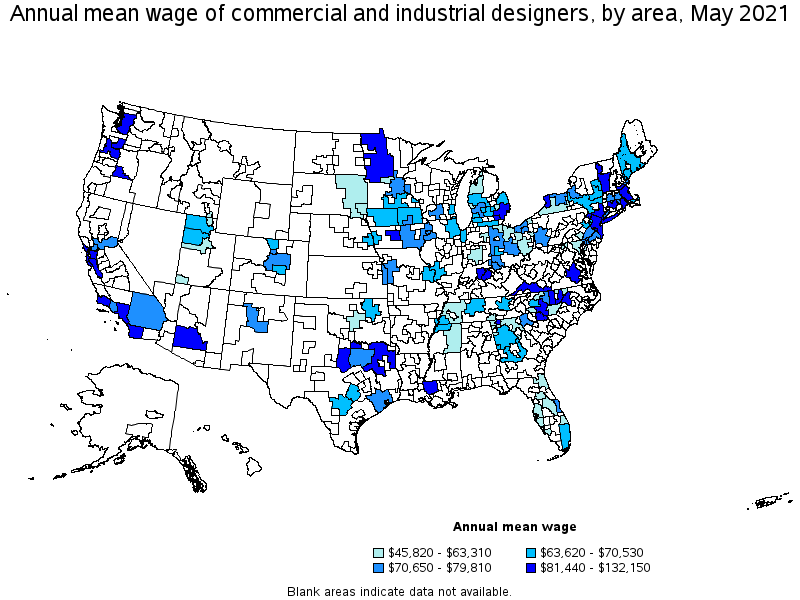
Top paying metropolitan areas for Commercial and Industrial Designers:
| Metropolitan area | Employment (1) | Employment per thousand jobs | Location quotient (9) | Hourly mean wage | Annual mean wage (2) |
|---|---|---|---|---|---|
| Durham-Chapel Hill, NC | 120 | 0.39 | 1.98 | $ 63.53 | $ 132,150 |
| San Jose-Sunnyvale-Santa Clara, CA | 460 | 0.43 | 2.18 | $ 53.54 | $ 111,370 |
| Phoenix-Mesa-Scottsdale, AZ | 310 | 0.15 | 0.75 | $ 52.29 | $ 108,760 |
| San Francisco-Oakland-Hayward, CA | 710 | 0.32 | 1.59 | $ 50.02 | $ 104,050 |
| Hartford-West Hartford-East Hartford, CT | 110 | 0.21 | 1.04 | $ 49.47 | $ 102,890 |
| Raleigh, NC | 50 | 0.09 | 0.44 | $ 48.27 | $ 100,400 |
| Los Angeles-Long Beach-Anaheim, CA | 2,480 | 0.43 | 2.19 | $ 45.74 | $ 95,140 |
| Des Moines-West Des Moines, IA | 260 | 0.72 | 3.61 | $ 45.51 | $ 94,650 |
| Ann Arbor, MI | 70 | 0.34 | 1.70 | $ 44.53 | $ 92,610 |
| San Diego-Carlsbad, CA | 400 | 0.29 | 1.46 | $ 44.44 | $ 92,440 |
Nonmetropolitan areas with the highest employment in Commercial and Industrial Designers:
| Nonmetropolitan area | Employment (1) | Employment per thousand jobs | Location quotient (9) | Hourly mean wage | Annual mean wage (2) |
|---|---|---|---|---|---|
| Balance of Lower Peninsula of Michigan nonmetropolitan area | 190 | 0.73 | 3.69 | $ 32.64 | $ 67,890 |
| Northeast Mississippi nonmetropolitan area | 90 | 0.41 | 2.09 | $ 23.30 | $ 48,460 |
| Southeast Iowa nonmetropolitan area | 80 | 0.38 | 1.90 | $ 34.88 | $ 72,550 |
| North Northeastern Ohio nonmetropolitan area (noncontiguous) | 70 | 0.23 | 1.17 | $ 30.44 | $ 63,310 |
| West Tennessee nonmetropolitan area | 70 | 0.53 | 2.68 | $ 22.14 | $ 46,040 |
Nonmetropolitan areas with the highest concentration of jobs and location quotients in Commercial and Industrial Designers:
| Nonmetropolitan area | Employment (1) | Employment per thousand jobs | Location quotient (9) | Hourly mean wage | Annual mean wage (2) |
|---|---|---|---|---|---|
| Balance of Lower Peninsula of Michigan nonmetropolitan area | 190 | 0.73 | 3.69 | $ 32.64 | $ 67,890 |
| West Tennessee nonmetropolitan area | 70 | 0.53 | 2.68 | $ 22.14 | $ 46,040 |
| Northeast Mississippi nonmetropolitan area | 90 | 0.41 | 2.09 | $ 23.30 | $ 48,460 |
| Northeast Iowa nonmetropolitan area | 40 | 0.40 | 2.00 | $ 32.52 | $ 67,640 |
| Southwest Virginia nonmetropolitan area | 40 | 0.39 | 1.95 | $ 42.05 | $ 87,460 |
Top paying nonmetropolitan areas for Commercial and Industrial Designers:
| Nonmetropolitan area | Employment (1) | Employment per thousand jobs | Location quotient (9) | Hourly mean wage | Annual mean wage (2) |
|---|---|---|---|---|---|
| North Texas Region of Texas nonmetropolitan area | (8) | (8) | (8) | $ 44.76 | $ 93,100 |
| Southwest Virginia nonmetropolitan area | 40 | 0.39 | 1.95 | $ 42.05 | $ 87,460 |
| Southern Vermont nonmetropolitan area | 30 | 0.33 | 1.65 | $ 40.38 | $ 83,980 |
| Northwest Minnesota nonmetropolitan area | 50 | 0.27 | 1.34 | $ 39.15 | $ 81,440 |
| Southeast Iowa nonmetropolitan area | 80 | 0.38 | 1.90 | $ 34.88 | $ 72,550 |
These estimates are calculated with data collected from employers in all industry sectors, all metropolitan and nonmetropolitan areas, and all states and the District of Columbia. The top employment and wage figures are provided above. The complete list is available in the downloadable XLS files.
The percentile wage estimate is the value of a wage below which a certain percent of workers fall. The median wage is the 50th percentile wage estimate—50 percent of workers earn less than the median and 50 percent of workers earn more than the median. More about percentile wages.
(1) Estimates for detailed occupations do not sum to the totals because the totals include occupations not shown separately. Estimates do not include self-employed workers.
(2) Annual wages have been calculated by multiplying the hourly mean wage by a "year-round, full-time" hours figure of 2,080 hours; for those occupations where there is not an hourly wage published, the annual wage has been directly calculated from the reported survey data.
(3) The relative standard error (RSE) is a measure of the reliability of a survey statistic. The smaller the relative standard error, the more precise the estimate.
(8) Estimate not released.
(9) The location quotient is the ratio of the area concentration of occupational employment to the national average concentration. A location quotient greater than one indicates the occupation has a higher share of employment than average, and a location quotient less than one indicates the occupation is less prevalent in the area than average.
Other OEWS estimates and related information:
May 2021 National Occupational Employment and Wage Estimates
May 2021 State Occupational Employment and Wage Estimates
May 2021 Metropolitan and Nonmetropolitan Area Occupational Employment and Wage Estimates
May 2021 National Industry-Specific Occupational Employment and Wage Estimates
Last Modified Date: March 31, 2022