
An official website of the United States government
An official website of the United States government
The .gov means it's official.
Federal government websites often end in .gov or .mil. Before sharing sensitive information,
make sure you're on a federal government site.
The site is secure.
The
https:// ensures that you are connecting to the official website and that any
information you provide is encrypted and transmitted securely.
Design clothing and accessories. Create original designs or adapt fashion trends.
Employment estimate and mean wage estimates for Fashion Designers:
| Employment (1) | Employment RSE (3) |
Mean hourly wage |
Mean annual wage (2) |
Wage RSE (3) |
|---|---|---|---|---|
| 19,310 | 5.3 % | $ 40.22 | $ 83,650 | 2.5 % |
Percentile wage estimates for Fashion Designers:
| Percentile | 10% | 25% | 50% (Median) |
75% | 90% |
|---|---|---|---|---|---|
| Hourly Wage | $ 18.02 | $ 24.34 | $ 37.24 | $ 48.71 | $ 62.92 |
| Annual Wage (2) | $ 37,480 | $ 50,630 | $ 77,450 | $ 101,320 | $ 130,870 |
Industries with the highest published employment and wages for Fashion Designers are provided. For a list of all industries with employment in Fashion Designers, see the Create Customized Tables function.
Industries with the highest levels of employment in Fashion Designers:
| Industry | Employment (1) | Percent of industry employment | Hourly mean wage | Annual mean wage (2) |
|---|---|---|---|---|
| Apparel, Piece Goods, and Notions Merchant Wholesalers | 7,340 | 5.68 | $ 43.53 | $ 90,540 |
| Management of Companies and Enterprises | 4,270 | 0.17 | $ 44.65 | $ 92,870 |
| Cut and Sew Apparel Manufacturing | 1,880 | 2.66 | $ 35.74 | $ 74,340 |
| Electronic Shopping and Mail-Order Houses | 1,820 | 0.39 | $ 24.32 | $ 50,580 |
| Specialized Design Services | 1,090 | 0.81 | $ 43.09 | $ 89,620 |
Industries with the highest concentration of employment in Fashion Designers:
| Industry | Employment (1) | Percent of industry employment | Hourly mean wage | Annual mean wage (2) |
|---|---|---|---|---|
| Apparel, Piece Goods, and Notions Merchant Wholesalers | 7,340 | 5.68 | $ 43.53 | $ 90,540 |
| Cut and Sew Apparel Manufacturing | 1,880 | 2.66 | $ 35.74 | $ 74,340 |
| Apparel Accessories and Other Apparel Manufacturing | 100 | 0.95 | $ 27.36 | $ 56,920 |
| Specialized Design Services | 1,090 | 0.81 | $ 43.09 | $ 89,620 |
| Electronic Shopping and Mail-Order Houses | 1,820 | 0.39 | $ 24.32 | $ 50,580 |
Top paying industries for Fashion Designers:
| Industry | Employment (1) | Percent of industry employment | Hourly mean wage | Annual mean wage (2) |
|---|---|---|---|---|
| Motion Picture and Video Industries | 450 | 0.14 | $ 52.43 | $ 109,060 |
| Management of Companies and Enterprises | 4,270 | 0.17 | $ 44.65 | $ 92,870 |
| Employment Services | 390 | 0.01 | $ 44.54 | $ 92,650 |
| Clothing Stores | 520 | 0.07 | $ 44.49 | $ 92,540 |
| Apparel, Piece Goods, and Notions Merchant Wholesalers | 7,340 | 5.68 | $ 43.53 | $ 90,540 |
States and areas with the highest published employment, location quotients, and wages for Fashion Designers are provided. For a list of all areas with employment in Fashion Designers, see the Create Customized Tables function.
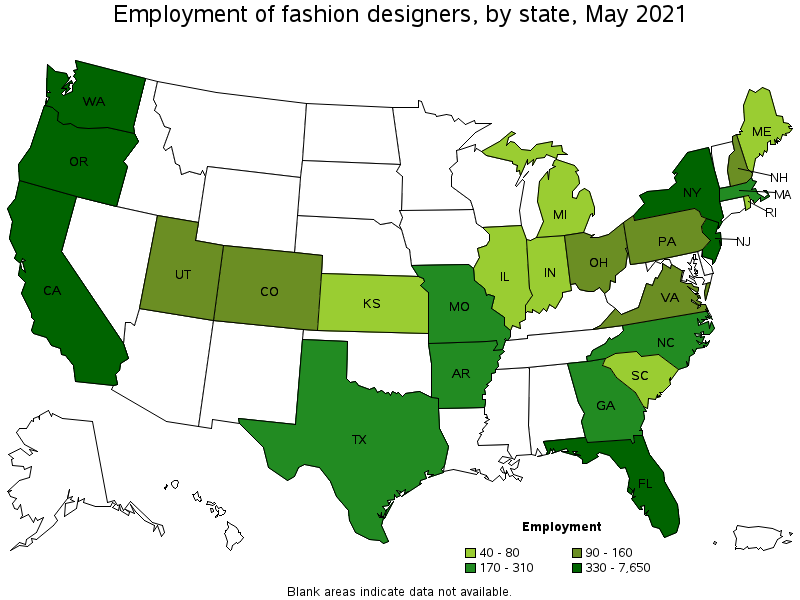
States with the highest employment level in Fashion Designers:
| State | Employment (1) | Employment per thousand jobs | Location quotient (9) | Hourly mean wage | Annual mean wage (2) |
|---|---|---|---|---|---|
| New York | 7,650 | 0.88 | 6.44 | $ 44.32 | $ 92,180 |
| California | 5,250 | 0.32 | 2.32 | $ 44.41 | $ 92,360 |
| Oregon | 600 | 0.33 | 2.38 | $ 42.25 | $ 87,890 |
| Florida | 460 | 0.05 | 0.39 | $ 30.83 | $ 64,130 |
| Washington | 410 | 0.13 | 0.92 | $ 44.42 | $ 92,400 |
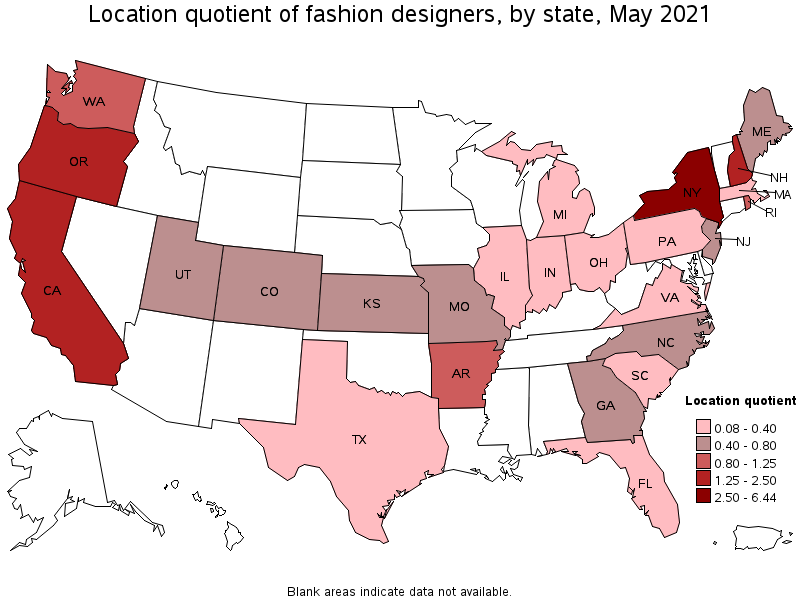
States with the highest concentration of jobs and location quotients in Fashion Designers:
| State | Employment (1) | Employment per thousand jobs | Location quotient (9) | Hourly mean wage | Annual mean wage (2) |
|---|---|---|---|---|---|
| New York | 7,650 | 0.88 | 6.44 | $ 44.32 | $ 92,180 |
| Oregon | 600 | 0.33 | 2.38 | $ 42.25 | $ 87,890 |
| California | 5,250 | 0.32 | 2.32 | $ 44.41 | $ 92,360 |
| New Hampshire | 130 | 0.20 | 1.47 | $ 43.96 | $ 91,440 |
| Arkansas | 180 | 0.15 | 1.11 | (8) | (8) |
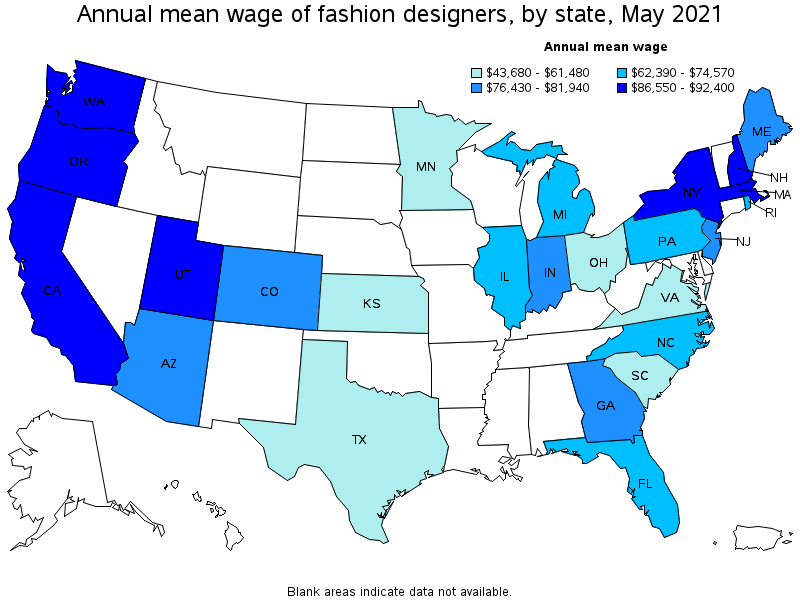
Top paying states for Fashion Designers:
| State | Employment (1) | Employment per thousand jobs | Location quotient (9) | Hourly mean wage | Annual mean wage (2) |
|---|---|---|---|---|---|
| Washington | 410 | 0.13 | 0.92 | $ 44.42 | $ 92,400 |
| California | 5,250 | 0.32 | 2.32 | $ 44.41 | $ 92,360 |
| New York | 7,650 | 0.88 | 6.44 | $ 44.32 | $ 92,180 |
| New Hampshire | 130 | 0.20 | 1.47 | $ 43.96 | $ 91,440 |
| Oregon | 600 | 0.33 | 2.38 | $ 42.25 | $ 87,890 |
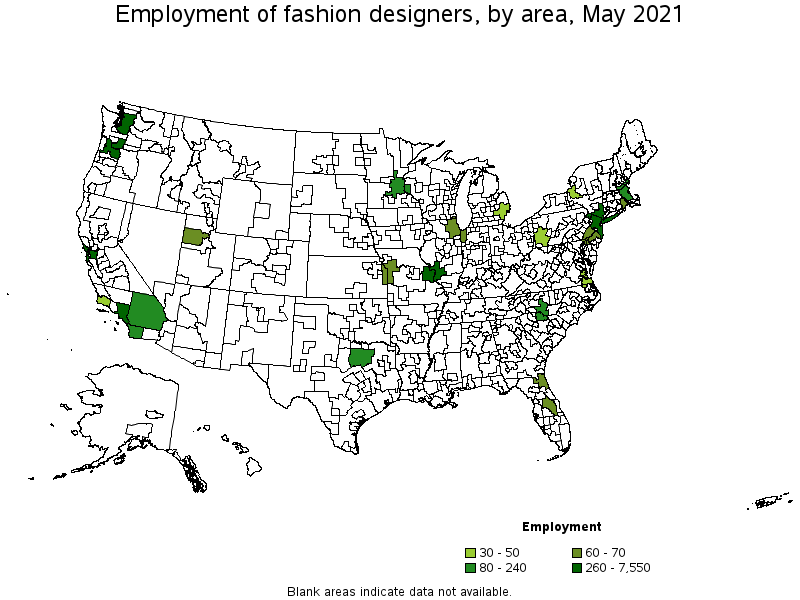
Metropolitan areas with the highest employment level in Fashion Designers:
| Metropolitan area | Employment (1) | Employment per thousand jobs | Location quotient (9) | Hourly mean wage | Annual mean wage (2) |
|---|---|---|---|---|---|
| New York-Newark-Jersey City, NY-NJ-PA | 7,550 | 0.87 | 6.35 | $ 44.46 | $ 92,480 |
| Los Angeles-Long Beach-Anaheim, CA | 3,840 | 0.67 | 4.90 | $ 43.83 | $ 91,170 |
| San Francisco-Oakland-Hayward, CA | 500 | 0.22 | 1.63 | $ 47.95 | $ 99,730 |
| Portland-Vancouver-Hillsboro, OR-WA | 500 | 0.45 | 3.25 | $ 42.41 | $ 88,210 |
| Seattle-Tacoma-Bellevue, WA | 370 | 0.19 | 1.42 | $ 45.11 | $ 93,830 |
| St. Louis, MO-IL | 260 | 0.20 | 1.46 | (8) | (8) |
| Minneapolis-St. Paul-Bloomington, MN-WI | 240 | 0.13 | 0.95 | $ 30.73 | $ 63,920 |
| San Diego-Carlsbad, CA | 200 | 0.14 | 1.06 | $ 43.36 | $ 90,180 |
| Riverside-San Bernardino-Ontario, CA | 160 | 0.11 | 0.77 | $ 43.61 | $ 90,700 |
| Boston-Cambridge-Nashua, MA-NH | 140 | 0.05 | 0.39 | $ 41.84 | $ 87,030 |
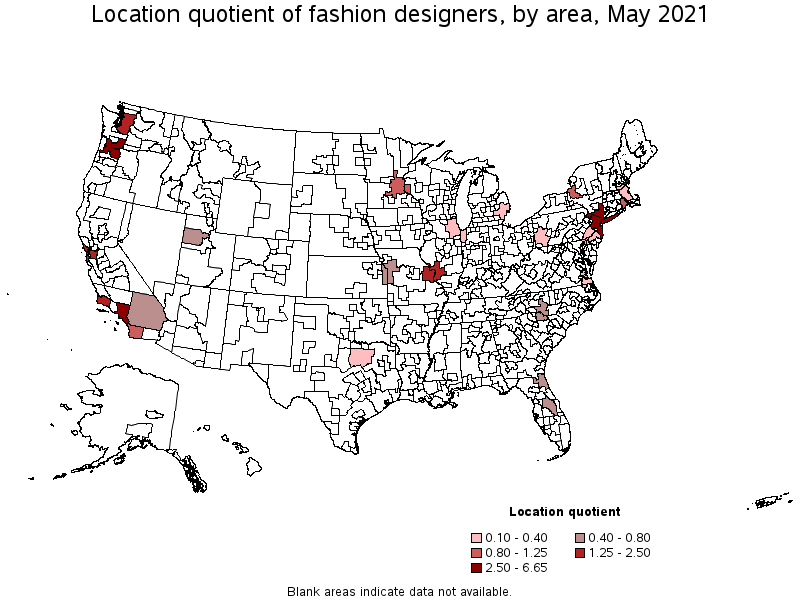
Metropolitan areas with the highest concentration of jobs and location quotients in Fashion Designers:
| Metropolitan area | Employment (1) | Employment per thousand jobs | Location quotient (9) | Hourly mean wage | Annual mean wage (2) |
|---|---|---|---|---|---|
| Portsmouth, NH-ME | 80 | 0.91 | 6.65 | $ 47.57 | $ 98,940 |
| New York-Newark-Jersey City, NY-NJ-PA | 7,550 | 0.87 | 6.35 | $ 44.46 | $ 92,480 |
| Los Angeles-Long Beach-Anaheim, CA | 3,840 | 0.67 | 4.90 | $ 43.83 | $ 91,170 |
| Portland-Vancouver-Hillsboro, OR-WA | 500 | 0.45 | 3.25 | $ 42.41 | $ 88,210 |
| Santa Maria-Santa Barbara, CA | 50 | 0.24 | 1.78 | $ 45.90 | $ 95,460 |
| San Francisco-Oakland-Hayward, CA | 500 | 0.22 | 1.63 | $ 47.95 | $ 99,730 |
| St. Louis, MO-IL | 260 | 0.20 | 1.46 | (8) | (8) |
| Seattle-Tacoma-Bellevue, WA | 370 | 0.19 | 1.42 | $ 45.11 | $ 93,830 |
| Syracuse, NY | 40 | 0.15 | 1.12 | $ 34.80 | $ 72,380 |
| San Diego-Carlsbad, CA | 200 | 0.14 | 1.06 | $ 43.36 | $ 90,180 |
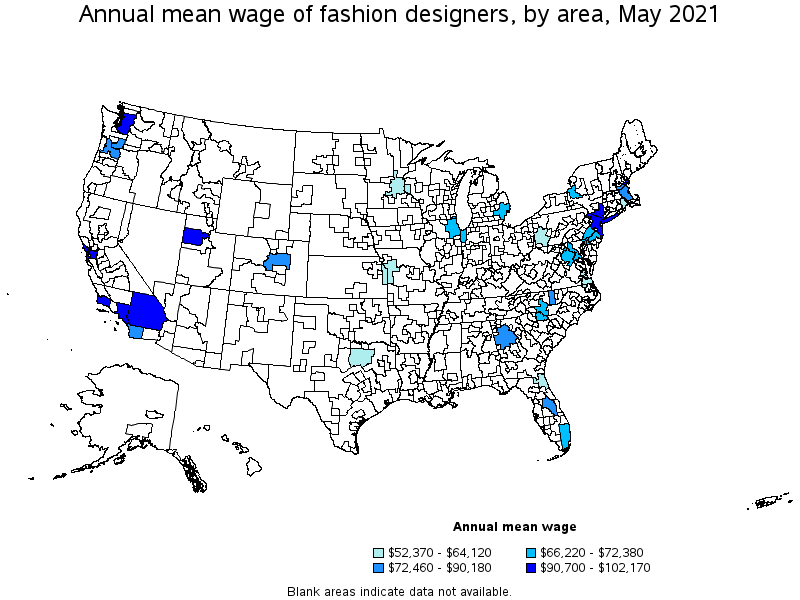
Top paying metropolitan areas for Fashion Designers:
| Metropolitan area | Employment (1) | Employment per thousand jobs | Location quotient (9) | Hourly mean wage | Annual mean wage (2) |
|---|---|---|---|---|---|
| Salt Lake City, UT | 60 | 0.08 | 0.61 | $ 49.12 | $ 102,170 |
| San Francisco-Oakland-Hayward, CA | 500 | 0.22 | 1.63 | $ 47.95 | $ 99,730 |
| Portsmouth, NH-ME | 80 | 0.91 | 6.65 | $ 47.57 | $ 98,940 |
| Santa Maria-Santa Barbara, CA | 50 | 0.24 | 1.78 | $ 45.90 | $ 95,460 |
| Seattle-Tacoma-Bellevue, WA | 370 | 0.19 | 1.42 | $ 45.11 | $ 93,830 |
| New York-Newark-Jersey City, NY-NJ-PA | 7,550 | 0.87 | 6.35 | $ 44.46 | $ 92,480 |
| Los Angeles-Long Beach-Anaheim, CA | 3,840 | 0.67 | 4.90 | $ 43.83 | $ 91,170 |
| Riverside-San Bernardino-Ontario, CA | 160 | 0.11 | 0.77 | $ 43.61 | $ 90,700 |
| San Diego-Carlsbad, CA | 200 | 0.14 | 1.06 | $ 43.36 | $ 90,180 |
| Portland-Vancouver-Hillsboro, OR-WA | 500 | 0.45 | 3.25 | $ 42.41 | $ 88,210 |
These estimates are calculated with data collected from employers in all industry sectors, all metropolitan and nonmetropolitan areas, and all states and the District of Columbia. The top employment and wage figures are provided above. The complete list is available in the downloadable XLS files.
The percentile wage estimate is the value of a wage below which a certain percent of workers fall. The median wage is the 50th percentile wage estimate—50 percent of workers earn less than the median and 50 percent of workers earn more than the median. More about percentile wages.
(1) Estimates for detailed occupations do not sum to the totals because the totals include occupations not shown separately. Estimates do not include self-employed workers.
(2) Annual wages have been calculated by multiplying the hourly mean wage by a "year-round, full-time" hours figure of 2,080 hours; for those occupations where there is not an hourly wage published, the annual wage has been directly calculated from the reported survey data.
(3) The relative standard error (RSE) is a measure of the reliability of a survey statistic. The smaller the relative standard error, the more precise the estimate.
(8) Estimate not released.
(9) The location quotient is the ratio of the area concentration of occupational employment to the national average concentration. A location quotient greater than one indicates the occupation has a higher share of employment than average, and a location quotient less than one indicates the occupation is less prevalent in the area than average.
Other OEWS estimates and related information:
May 2021 National Occupational Employment and Wage Estimates
May 2021 State Occupational Employment and Wage Estimates
May 2021 Metropolitan and Nonmetropolitan Area Occupational Employment and Wage Estimates
May 2021 National Industry-Specific Occupational Employment and Wage Estimates
Last Modified Date: March 31, 2022