
An official website of the United States government
An official website of the United States government
The .gov means it's official.
Federal government websites often end in .gov or .mil. Before sharing sensitive information,
make sure you're on a federal government site.
The site is secure.
The
https:// ensures that you are connecting to the official website and that any
information you provide is encrypted and transmitted securely.
Plan, design, and furnish the internal space of rooms or buildings. Design interior environments or create physical layouts that are practical, aesthetic, and conducive to the intended purposes. May specialize in a particular field, style, or phase of interior design. Excludes �Merchandise Displayers and Window Trimmers� (27-1026).
Employment estimate and mean wage estimates for Interior Designers:
| Employment (1) | Employment RSE (3) |
Mean hourly wage |
Mean annual wage (2) |
Wage RSE (3) |
|---|---|---|---|---|
| 61,970 | 2.4 % | $ 30.08 | $ 62,570 | 1.2 % |
Percentile wage estimates for Interior Designers:
| Percentile | 10% | 25% | 50% (Median) |
75% | 90% |
|---|---|---|---|---|---|
| Hourly Wage | $ 14.87 | $ 22.32 | $ 29.01 | $ 37.35 | $ 47.63 |
| Annual Wage (2) | $ 30,930 | $ 46,420 | $ 60,340 | $ 77,700 | $ 99,070 |
Industries with the highest published employment and wages for Interior Designers are provided. For a list of all industries with employment in Interior Designers, see the Create Customized Tables function.
Industries with the highest levels of employment in Interior Designers:
| Industry | Employment (1) | Percent of industry employment | Hourly mean wage | Annual mean wage (2) |
|---|---|---|---|---|
| Specialized Design Services | 22,490 | 16.60 | $ 29.98 | $ 62,350 |
| Architectural, Engineering, and Related Services | 12,200 | 0.81 | $ 34.21 | $ 71,150 |
| Furniture Stores | 6,590 | 3.13 | $ 27.64 | $ 57,500 |
| Residential Building Construction | 3,710 | 0.44 | $ 26.44 | $ 55,000 |
| Merchant Wholesalers, Durable Goods (4232, 4233, 4235, 4236, 4237, and 4239 only) | 3,170 | 0.23 | $ 31.70 | $ 65,930 |
Industries with the highest concentration of employment in Interior Designers:
| Industry | Employment (1) | Percent of industry employment | Hourly mean wage | Annual mean wage (2) |
|---|---|---|---|---|
| Specialized Design Services | 22,490 | 16.60 | $ 29.98 | $ 62,350 |
| Furniture Stores | 6,590 | 3.13 | $ 27.64 | $ 57,500 |
| Home Furnishings Stores | 2,510 | 1.11 | $ 24.23 | $ 50,390 |
| Architectural, Engineering, and Related Services | 12,200 | 0.81 | $ 34.21 | $ 71,150 |
| Residential Building Construction | 3,710 | 0.44 | $ 26.44 | $ 55,000 |
Top paying industries for Interior Designers:
| Industry | Employment (1) | Percent of industry employment | Hourly mean wage | Annual mean wage (2) |
|---|---|---|---|---|
| Securities, Commodity Contracts, and Other Financial Investments and Related Activities | 70 | 0.01 | $ 63.17 | $ 131,390 |
| Federal Executive Branch (OEWS Designation) | 400 | 0.02 | $ 41.91 | $ 87,180 |
| General Medical and Surgical Hospitals | 100 | (7) | $ 38.77 | $ 80,640 |
| Management of Companies and Enterprises | 1,960 | 0.08 | $ 38.26 | $ 79,590 |
| State Government, excluding schools and hospitals (OEWS Designation) | 50 | (7) | $ 36.71 | $ 76,350 |
States and areas with the highest published employment, location quotients, and wages for Interior Designers are provided. For a list of all areas with employment in Interior Designers, see the Create Customized Tables function.
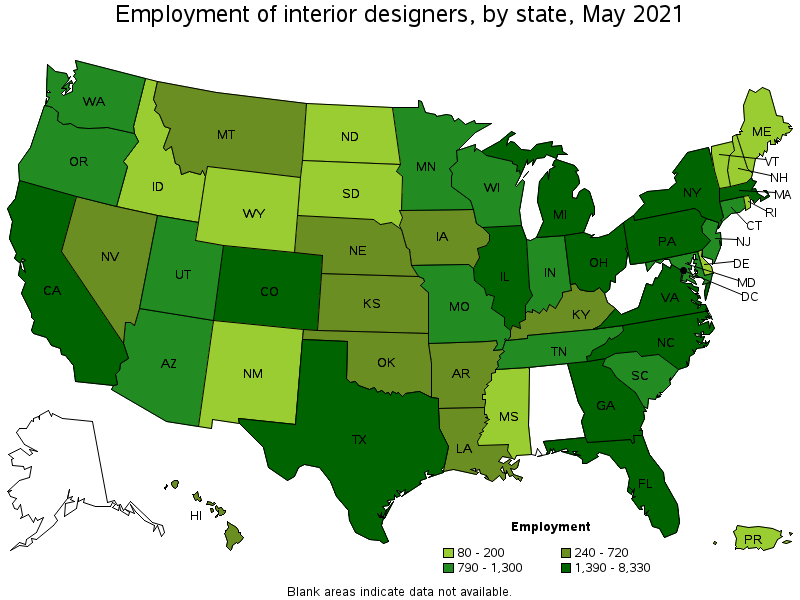
States with the highest employment level in Interior Designers:
| State | Employment (1) | Employment per thousand jobs | Location quotient (9) | Hourly mean wage | Annual mean wage (2) |
|---|---|---|---|---|---|
| California | 8,330 | 0.50 | 1.15 | $ 33.79 | $ 70,290 |
| Florida | 6,470 | 0.75 | 1.71 | $ 29.14 | $ 60,600 |
| New York | 6,110 | 0.71 | 1.60 | $ 34.72 | $ 72,220 |
| Texas | 4,690 | 0.38 | 0.87 | $ 28.54 | $ 59,370 |
| Illinois | 2,390 | 0.43 | 0.97 | $ 30.42 | $ 63,270 |
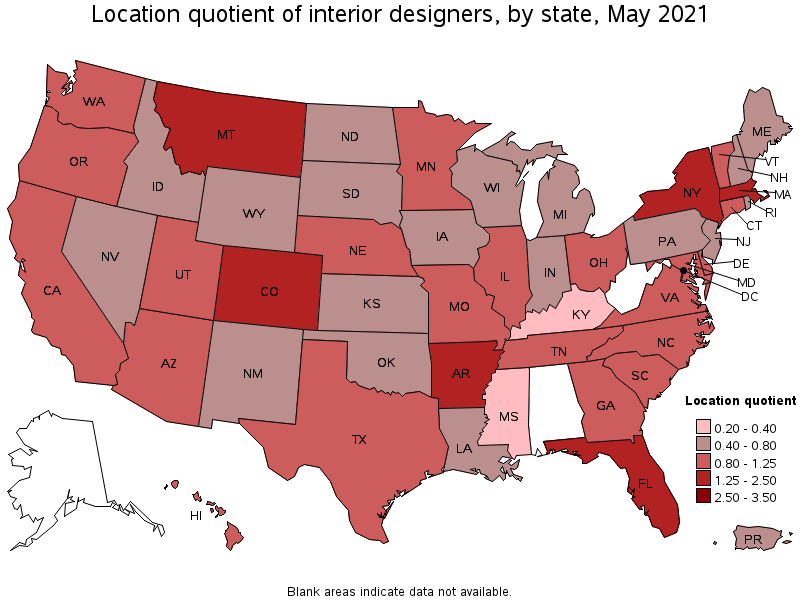
States with the highest concentration of jobs and location quotients in Interior Designers:
| State | Employment (1) | Employment per thousand jobs | Location quotient (9) | Hourly mean wage | Annual mean wage (2) |
|---|---|---|---|---|---|
| District of Columbia | 690 | 1.05 | 2.38 | $ 38.18 | $ 79,420 |
| Florida | 6,470 | 0.75 | 1.71 | $ 29.14 | $ 60,600 |
| Colorado | 1,950 | 0.75 | 1.70 | $ 32.15 | $ 66,880 |
| New York | 6,110 | 0.71 | 1.60 | $ 34.72 | $ 72,220 |
| Montana | 290 | 0.61 | 1.39 | $ 21.72 | $ 45,190 |
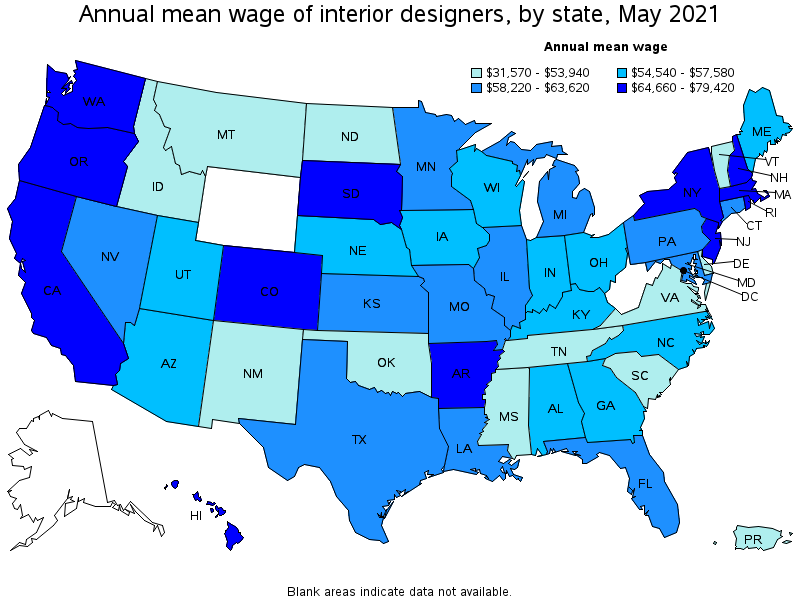
Top paying states for Interior Designers:
| State | Employment (1) | Employment per thousand jobs | Location quotient (9) | Hourly mean wage | Annual mean wage (2) |
|---|---|---|---|---|---|
| District of Columbia | 690 | 1.05 | 2.38 | $ 38.18 | $ 79,420 |
| Rhode Island | 130 | 0.28 | 0.64 | $ 37.14 | $ 77,250 |
| Massachusetts | 1,870 | 0.55 | 1.25 | $ 35.16 | $ 73,140 |
| New York | 6,110 | 0.71 | 1.60 | $ 34.72 | $ 72,220 |
| California | 8,330 | 0.50 | 1.15 | $ 33.79 | $ 70,290 |
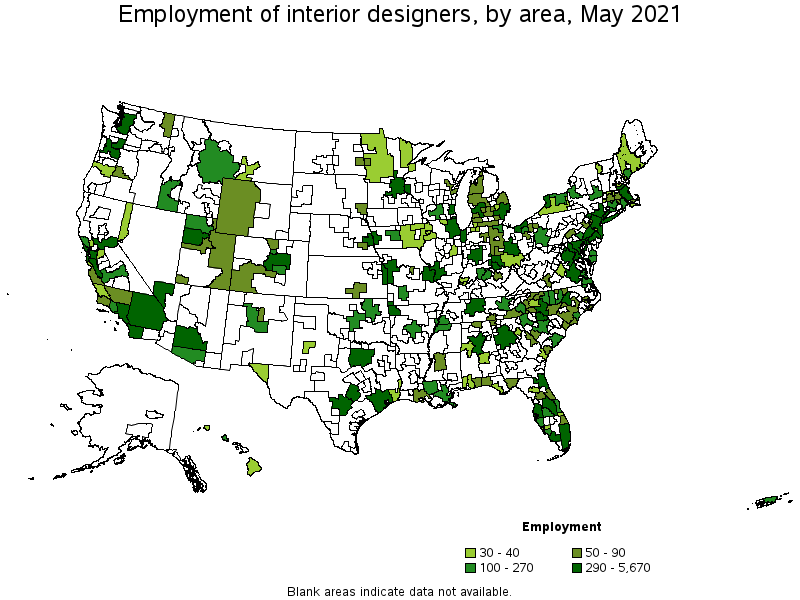
Metropolitan areas with the highest employment level in Interior Designers:
| Metropolitan area | Employment (1) | Employment per thousand jobs | Location quotient (9) | Hourly mean wage | Annual mean wage (2) |
|---|---|---|---|---|---|
| New York-Newark-Jersey City, NY-NJ-PA | 5,670 | 0.65 | 1.49 | $ 34.80 | $ 72,390 |
| Los Angeles-Long Beach-Anaheim, CA | 3,450 | 0.60 | 1.37 | $ 33.04 | $ 68,730 |
| Miami-Fort Lauderdale-West Palm Beach, FL | 2,600 | 1.06 | 2.41 | $ 30.81 | $ 64,070 |
| Chicago-Naperville-Elgin, IL-IN-WI | 2,080 | 0.49 | 1.12 | $ 31.31 | $ 65,120 |
| San Francisco-Oakland-Hayward, CA | 1,930 | 0.86 | 1.96 | $ 39.07 | $ 81,260 |
| Dallas-Fort Worth-Arlington, TX | 1,850 | 0.51 | 1.17 | $ 29.01 | $ 60,340 |
| Washington-Arlington-Alexandria, DC-VA-MD-WV | 1,680 | 0.57 | 1.30 | $ 33.68 | $ 70,060 |
| Boston-Cambridge-Nashua, MA-NH | 1,650 | 0.64 | 1.45 | $ 36.09 | $ 75,060 |
| Atlanta-Sandy Springs-Roswell, GA | 1,650 | 0.64 | 1.45 | $ 26.55 | $ 55,220 |
| Denver-Aurora-Lakewood, CO | 1,330 | 0.91 | 2.07 | $ 33.05 | $ 68,740 |
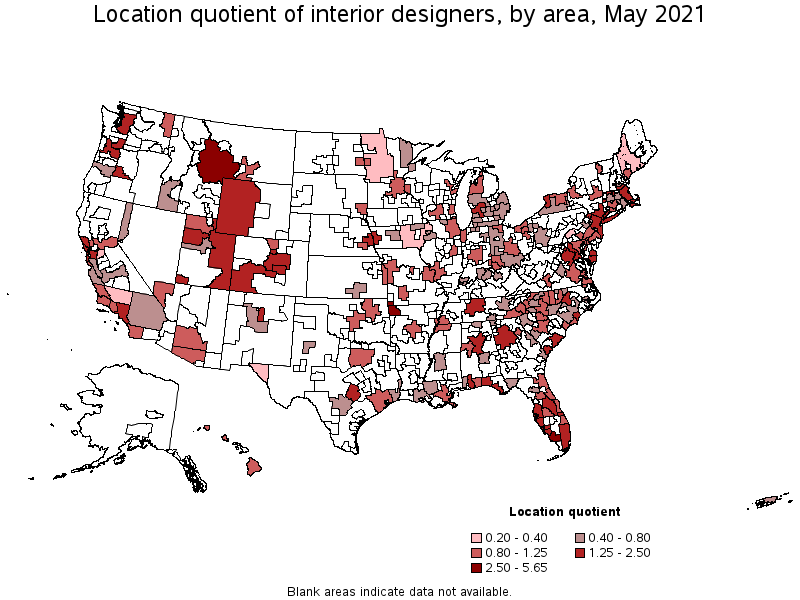
Metropolitan areas with the highest concentration of jobs and location quotients in Interior Designers:
| Metropolitan area | Employment (1) | Employment per thousand jobs | Location quotient (9) | Hourly mean wage | Annual mean wage (2) |
|---|---|---|---|---|---|
| Naples-Immokalee-Marco Island, FL | 360 | 2.49 | 5.65 | $ 36.41 | $ 75,740 |
| Fayetteville-Springdale-Rogers, AR-MO | 490 | 2.02 | 4.58 | (8) | (8) |
| Miami-Fort Lauderdale-West Palm Beach, FL | 2,600 | 1.06 | 2.41 | $ 30.81 | $ 64,070 |
| St. George, UT | 80 | 1.03 | 2.35 | $ 23.30 | $ 48,470 |
| North Port-Sarasota-Bradenton, FL | 270 | 0.93 | 2.12 | $ 23.03 | $ 47,900 |
| Denver-Aurora-Lakewood, CO | 1,330 | 0.91 | 2.07 | $ 33.05 | $ 68,740 |
| Cape Coral-Fort Myers, FL | 230 | 0.88 | 2.00 | $ 30.12 | $ 62,650 |
| Sebastian-Vero Beach, FL | 40 | 0.87 | 1.98 | $ 23.99 | $ 49,900 |
| Wilmington, NC | 110 | 0.87 | 1.97 | $ 22.73 | $ 47,290 |
| Bridgeport-Stamford-Norwalk, CT | 320 | 0.86 | 1.96 | $ 29.97 | $ 62,340 |
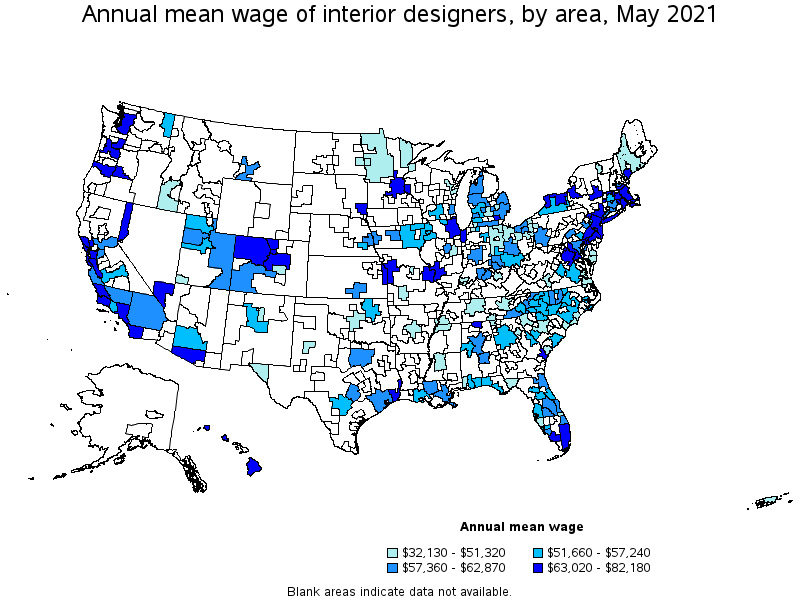
Top paying metropolitan areas for Interior Designers:
| Metropolitan area | Employment (1) | Employment per thousand jobs | Location quotient (9) | Hourly mean wage | Annual mean wage (2) |
|---|---|---|---|---|---|
| Albany-Schenectady-Troy, NY | 190 | 0.46 | 1.05 | $ 39.51 | $ 82,180 |
| San Francisco-Oakland-Hayward, CA | 1,930 | 0.86 | 1.96 | $ 39.07 | $ 81,260 |
| Savannah, GA | 40 | 0.22 | 0.50 | $ 38.62 | $ 80,320 |
| San Jose-Sunnyvale-Santa Clara, CA | 330 | 0.31 | 0.70 | $ 37.72 | $ 78,460 |
| Naples-Immokalee-Marco Island, FL | 360 | 2.49 | 5.65 | $ 36.41 | $ 75,740 |
| Boston-Cambridge-Nashua, MA-NH | 1,650 | 0.64 | 1.45 | $ 36.09 | $ 75,060 |
| Boulder, CO | 120 | 0.65 | 1.48 | $ 35.63 | $ 74,110 |
| Syracuse, NY | 100 | 0.37 | 0.84 | $ 35.42 | $ 73,670 |
| Beaumont-Port Arthur, TX | 40 | 0.27 | 0.61 | $ 35.10 | $ 73,000 |
| New York-Newark-Jersey City, NY-NJ-PA | 5,670 | 0.65 | 1.49 | $ 34.80 | $ 72,390 |
Nonmetropolitan areas with the highest employment in Interior Designers:
| Nonmetropolitan area | Employment (1) | Employment per thousand jobs | Location quotient (9) | Hourly mean wage | Annual mean wage (2) |
|---|---|---|---|---|---|
| Southwest Montana nonmetropolitan area | 180 | 1.27 | 2.88 | (8) | (8) |
| Southwest Colorado nonmetropolitan area | 80 | 0.84 | 1.90 | $ 30.23 | $ 62,870 |
| Southeast Coastal North Carolina nonmetropolitan area | 70 | 0.28 | 0.64 | $ 25.79 | $ 53,640 |
| Piedmont North Carolina nonmetropolitan area | 60 | 0.26 | 0.60 | $ 26.98 | $ 56,120 |
| Northwest Lower Peninsula of Michigan nonmetropolitan area | 60 | 0.52 | 1.19 | $ 27.96 | $ 58,160 |
Nonmetropolitan areas with the highest concentration of jobs and location quotients in Interior Designers:
| Nonmetropolitan area | Employment (1) | Employment per thousand jobs | Location quotient (9) | Hourly mean wage | Annual mean wage (2) |
|---|---|---|---|---|---|
| Southwest Montana nonmetropolitan area | 180 | 1.27 | 2.88 | (8) | (8) |
| Southwest Colorado nonmetropolitan area | 80 | 0.84 | 1.90 | $ 30.23 | $ 62,870 |
| Massachusetts nonmetropolitan area | 40 | 0.71 | 1.61 | $ 30.36 | $ 63,150 |
| Eastern Utah nonmetropolitan area | 50 | 0.60 | 1.37 | $ 29.74 | $ 61,850 |
| Western Wyoming nonmetropolitan area | 50 | 0.56 | 1.27 | (8) | (8) |
Top paying nonmetropolitan areas for Interior Designers:
| Nonmetropolitan area | Employment (1) | Employment per thousand jobs | Location quotient (9) | Hourly mean wage | Annual mean wage (2) |
|---|---|---|---|---|---|
| Northwest Colorado nonmetropolitan area | (8) | (8) | (8) | $ 31.68 | $ 65,900 |
| Hawaii / Kauai nonmetropolitan area | 40 | 0.50 | 1.13 | $ 30.63 | $ 63,700 |
| Massachusetts nonmetropolitan area | 40 | 0.71 | 1.61 | $ 30.36 | $ 63,150 |
| Southwest Colorado nonmetropolitan area | 80 | 0.84 | 1.90 | $ 30.23 | $ 62,870 |
| Eastern Utah nonmetropolitan area | 50 | 0.60 | 1.37 | $ 29.74 | $ 61,850 |
These estimates are calculated with data collected from employers in all industry sectors, all metropolitan and nonmetropolitan areas, and all states and the District of Columbia. The top employment and wage figures are provided above. The complete list is available in the downloadable XLS files.
The percentile wage estimate is the value of a wage below which a certain percent of workers fall. The median wage is the 50th percentile wage estimate—50 percent of workers earn less than the median and 50 percent of workers earn more than the median. More about percentile wages.
(1) Estimates for detailed occupations do not sum to the totals because the totals include occupations not shown separately. Estimates do not include self-employed workers.
(2) Annual wages have been calculated by multiplying the hourly mean wage by a "year-round, full-time" hours figure of 2,080 hours; for those occupations where there is not an hourly wage published, the annual wage has been directly calculated from the reported survey data.
(3) The relative standard error (RSE) is a measure of the reliability of a survey statistic. The smaller the relative standard error, the more precise the estimate.
(7) The value is less than .005 percent of industry employment.
(8) Estimate not released.
(9) The location quotient is the ratio of the area concentration of occupational employment to the national average concentration. A location quotient greater than one indicates the occupation has a higher share of employment than average, and a location quotient less than one indicates the occupation is less prevalent in the area than average.
Other OEWS estimates and related information:
May 2021 National Occupational Employment and Wage Estimates
May 2021 State Occupational Employment and Wage Estimates
May 2021 Metropolitan and Nonmetropolitan Area Occupational Employment and Wage Estimates
May 2021 National Industry-Specific Occupational Employment and Wage Estimates
Last Modified Date: March 31, 2022