
An official website of the United States government
An official website of the United States government
The .gov means it's official.
Federal government websites often end in .gov or .mil. Before sharing sensitive information,
make sure you're on a federal government site.
The site is secure.
The
https:// ensures that you are connecting to the official website and that any
information you provide is encrypted and transmitted securely.
Plan and erect commercial displays, such as those in windows and interiors of retail stores and at trade exhibitions.
Employment estimate and mean wage estimates for Merchandise Displayers and Window Trimmers:
| Employment (1) | Employment RSE (3) |
Mean hourly wage |
Mean annual wage (2) |
Wage RSE (3) |
|---|---|---|---|---|
| 159,790 | 1.4 % | $ 17.08 | $ 35,520 | 0.8 % |
Percentile wage estimates for Merchandise Displayers and Window Trimmers:
| Percentile | 10% | 25% | 50% (Median) |
75% | 90% |
|---|---|---|---|---|---|
| Hourly Wage | $ 12.77 | $ 14.06 | $ 15.41 | $ 18.24 | $ 22.74 |
| Annual Wage (2) | $ 26,560 | $ 29,240 | $ 32,060 | $ 37,930 | $ 47,290 |
Industries with the highest published employment and wages for Merchandise Displayers and Window Trimmers are provided. For a list of all industries with employment in Merchandise Displayers and Window Trimmers, see the Create Customized Tables function.
Industries with the highest levels of employment in Merchandise Displayers and Window Trimmers:
| Industry | Employment (1) | Percent of industry employment | Hourly mean wage | Annual mean wage (2) |
|---|---|---|---|---|
| Building Material and Supplies Dealers | 44,840 | 3.60 | $ 16.12 | $ 33,540 |
| Merchant Wholesalers, Nondurable Goods (4244 and 4248 only) | 41,830 | 4.51 | $ 17.47 | $ 36,330 |
| Advertising, Public Relations, and Related Services | 14,030 | 3.22 | $ 15.16 | $ 31,520 |
| General Merchandise Stores | 9,090 | 0.29 | $ 17.22 | $ 35,830 |
| Beverage Manufacturing | 8,110 | 2.89 | $ 18.78 | $ 39,060 |
Industries with the highest concentration of employment in Merchandise Displayers and Window Trimmers:
| Industry | Employment (1) | Percent of industry employment | Hourly mean wage | Annual mean wage (2) |
|---|---|---|---|---|
| Merchant Wholesalers, Nondurable Goods (4244 and 4248 only) | 41,830 | 4.51 | $ 17.47 | $ 36,330 |
| Building Material and Supplies Dealers | 44,840 | 3.60 | $ 16.12 | $ 33,540 |
| Advertising, Public Relations, and Related Services | 14,030 | 3.22 | $ 15.16 | $ 31,520 |
| Beverage Manufacturing | 8,110 | 2.89 | $ 18.78 | $ 39,060 |
| Other Support Services | 5,130 | 1.83 | $ 14.14 | $ 29,400 |
Top paying industries for Merchandise Displayers and Window Trimmers:
| Industry | Employment (1) | Percent of industry employment | Hourly mean wage | Annual mean wage (2) |
|---|---|---|---|---|
| Electronic Shopping and Mail-Order Houses | 340 | 0.07 | $ 31.09 | $ 64,660 |
| Other Food Manufacturing | 30 | 0.01 | $ 27.55 | $ 57,300 |
| Cut and Sew Apparel Manufacturing | 180 | 0.25 | $ 26.76 | $ 55,670 |
| Management of Companies and Enterprises | 4,340 | 0.17 | $ 25.80 | $ 53,670 |
| Specialized Design Services | 100 | 0.07 | $ 25.11 | $ 52,230 |
States and areas with the highest published employment, location quotients, and wages for Merchandise Displayers and Window Trimmers are provided. For a list of all areas with employment in Merchandise Displayers and Window Trimmers, see the Create Customized Tables function.
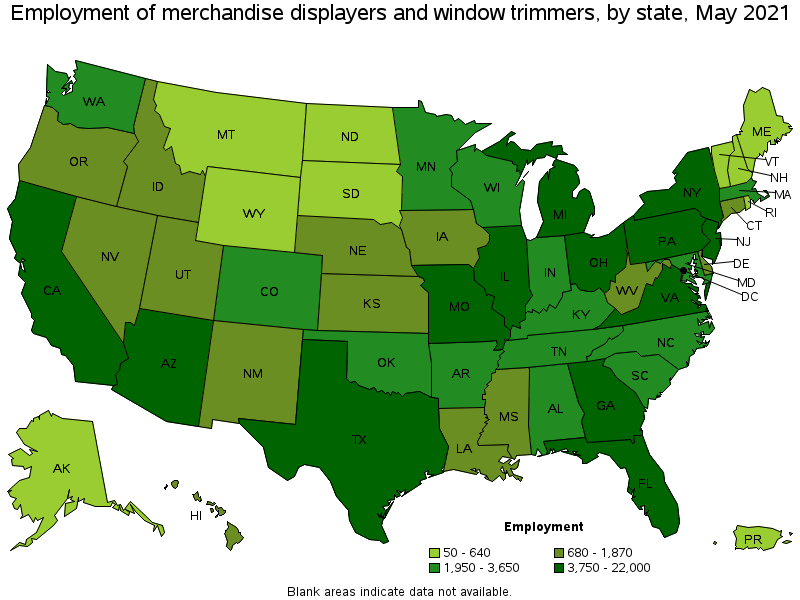
States with the highest employment level in Merchandise Displayers and Window Trimmers:
| State | Employment (1) | Employment per thousand jobs | Location quotient (9) | Hourly mean wage | Annual mean wage (2) |
|---|---|---|---|---|---|
| California | 22,000 | 1.33 | 1.17 | $ 18.44 | $ 38,360 |
| Florida | 11,240 | 1.31 | 1.15 | $ 15.49 | $ 32,210 |
| Texas | 9,580 | 0.78 | 0.69 | $ 16.39 | $ 34,100 |
| Pennsylvania | 7,630 | 1.37 | 1.20 | $ 17.23 | $ 35,840 |
| New York | 7,310 | 0.84 | 0.74 | $ 19.86 | $ 41,300 |
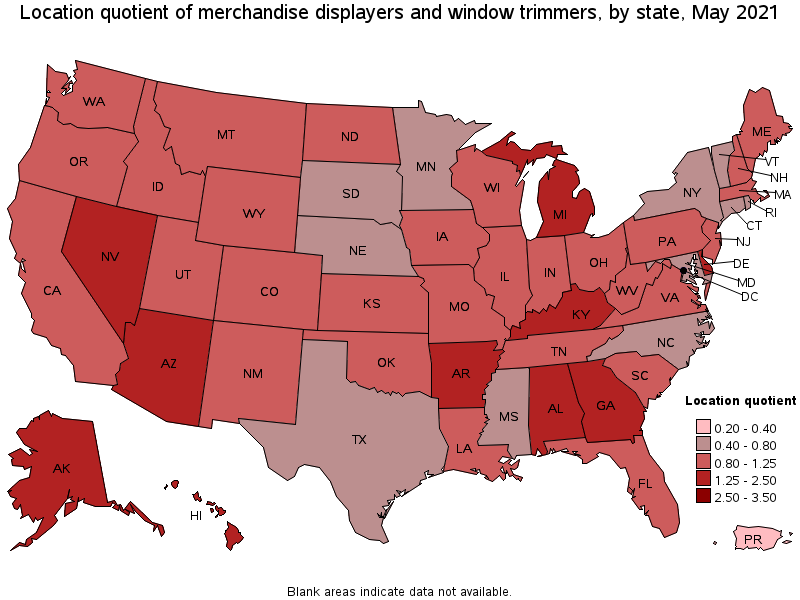
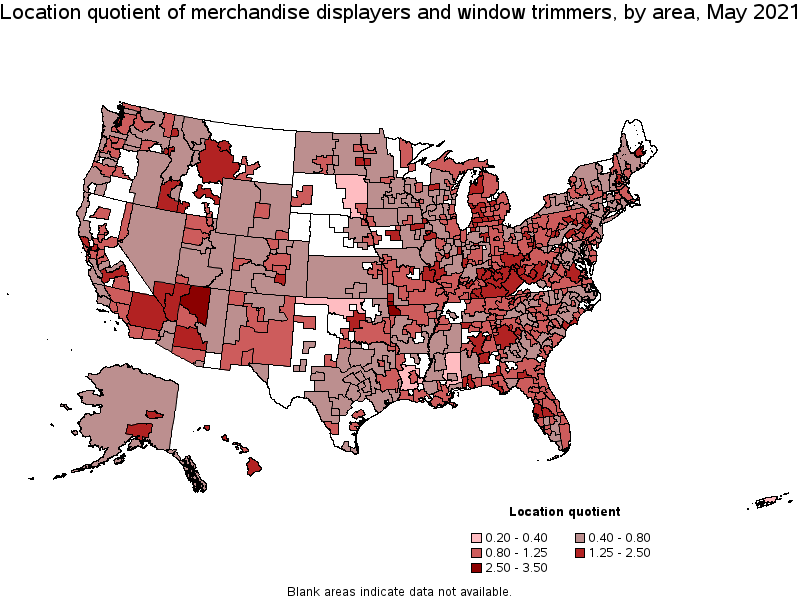
States with the highest concentration of jobs and location quotients in Merchandise Displayers and Window Trimmers:
| State | Employment (1) | Employment per thousand jobs | Location quotient (9) | Hourly mean wage | Annual mean wage (2) |
|---|---|---|---|---|---|
| Alaska | 500 | 1.70 | 1.50 | $ 17.01 | $ 35,380 |
| Hawaii | 900 | 1.64 | 1.45 | $ 16.78 | $ 34,900 |
| Arkansas | 1,950 | 1.64 | 1.44 | $ 15.91 | $ 33,090 |
| Kentucky | 2,970 | 1.62 | 1.43 | $ 16.57 | $ 34,470 |
| Georgia | 6,950 | 1.59 | 1.40 | $ 17.55 | $ 36,510 |
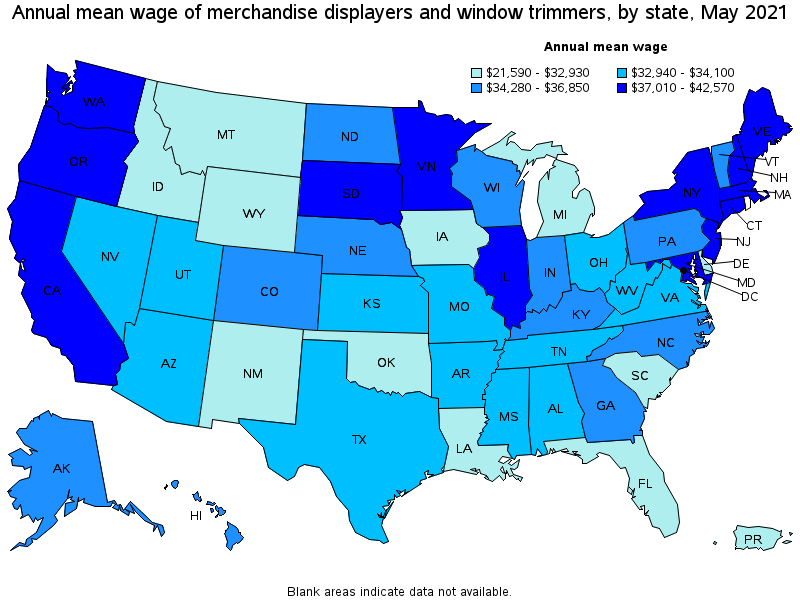
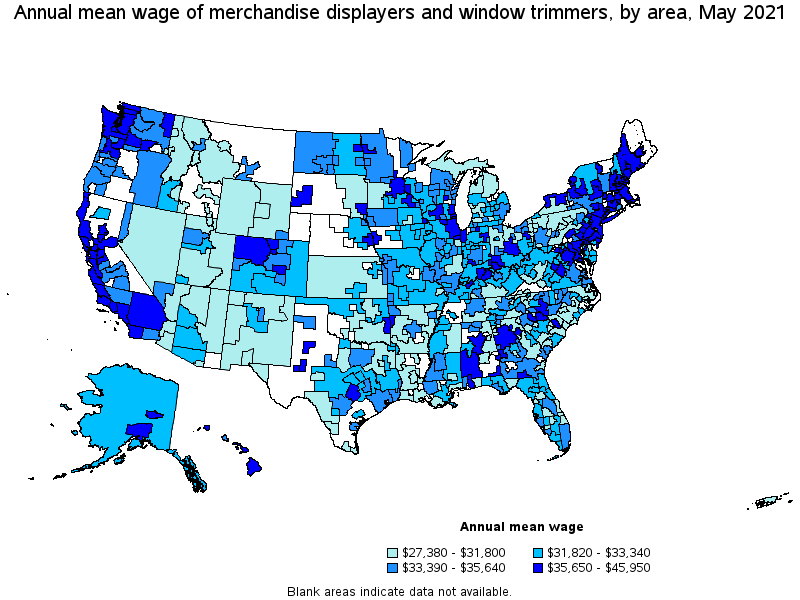
Top paying states for Merchandise Displayers and Window Trimmers:
| State | Employment (1) | Employment per thousand jobs | Location quotient (9) | Hourly mean wage | Annual mean wage (2) |
|---|---|---|---|---|---|
| Washington | 3,320 | 1.03 | 0.91 | $ 20.47 | $ 42,570 |
| Maine | 640 | 1.08 | 0.95 | $ 20.45 | $ 42,530 |
| New York | 7,310 | 0.84 | 0.74 | $ 19.86 | $ 41,300 |
| Massachusetts | 3,140 | 0.92 | 0.82 | $ 19.08 | $ 39,690 |
| New Jersey | 3,900 | 1.01 | 0.89 | $ 18.84 | $ 39,180 |
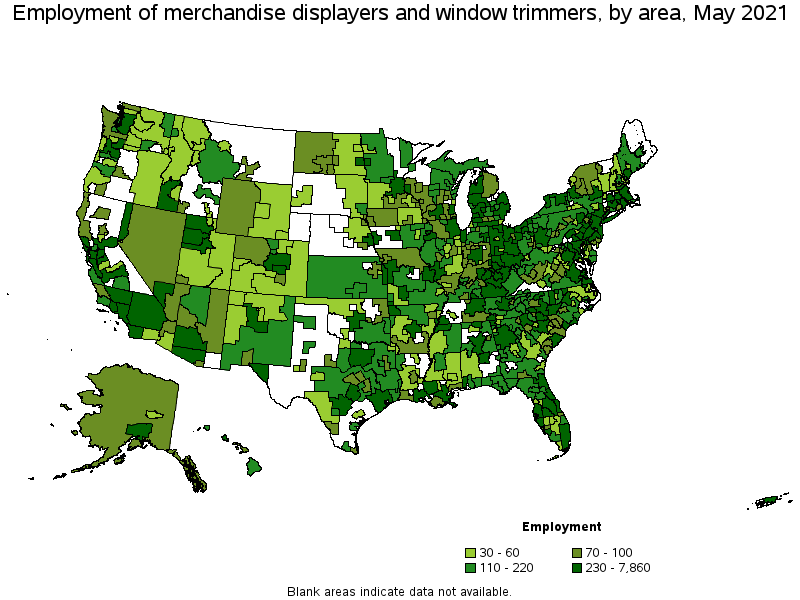
Metropolitan areas with the highest employment level in Merchandise Displayers and Window Trimmers:
| Metropolitan area | Employment (1) | Employment per thousand jobs | Location quotient (9) | Hourly mean wage | Annual mean wage (2) |
|---|---|---|---|---|---|
| Los Angeles-Long Beach-Anaheim, CA | 7,860 | 1.37 | 1.21 | $ 18.26 | $ 37,970 |
| New York-Newark-Jersey City, NY-NJ-PA | 7,750 | 0.89 | 0.79 | $ 20.49 | $ 42,620 |
| Chicago-Naperville-Elgin, IL-IN-WI | 5,040 | 1.19 | 1.05 | $ 18.32 | $ 38,110 |
| Atlanta-Sandy Springs-Roswell, GA | 4,440 | 1.71 | 1.51 | $ 18.45 | $ 38,380 |
| Phoenix-Mesa-Scottsdale, AZ | 3,230 | 1.53 | 1.35 | $ 16.03 | $ 33,340 |
| Dallas-Fort Worth-Arlington, TX | 2,860 | 0.80 | 0.70 | $ 16.83 | $ 35,000 |
| Philadelphia-Camden-Wilmington, PA-NJ-DE-MD | 2,840 | 1.07 | 0.94 | $ 17.55 | $ 36,510 |
| Riverside-San Bernardino-Ontario, CA | 2,610 | 1.71 | 1.50 | $ 17.66 | $ 36,720 |
| San Francisco-Oakland-Hayward, CA | 2,470 | 1.10 | 0.97 | $ 22.09 | $ 45,950 |
| Miami-Fort Lauderdale-West Palm Beach, FL | 2,470 | 1.01 | 0.89 | $ 16.12 | $ 33,530 |
Metropolitan areas with the highest concentration of jobs and location quotients in Merchandise Displayers and Window Trimmers:
| Metropolitan area | Employment (1) | Employment per thousand jobs | Location quotient (9) | Hourly mean wage | Annual mean wage (2) |
|---|---|---|---|---|---|
| Flagstaff, AZ | 180 | 3.09 | 2.73 | $ 14.67 | $ 30,510 |
| Fayetteville-Springdale-Rogers, AR-MO | 700 | 2.86 | 2.52 | $ 16.57 | $ 34,460 |
| Columbia, MO | 250 | 2.69 | 2.37 | $ 14.02 | $ 29,150 |
| Anchorage, AK | 370 | 2.31 | 2.04 | $ 17.17 | $ 35,720 |
| Florence-Muscle Shoals, AL | 120 | 2.25 | 1.99 | $ 16.13 | $ 33,540 |
| Dothan, AL | 120 | 2.07 | 1.83 | $ 17.29 | $ 35,960 |
| Beckley, WV | 80 | 2.04 | 1.80 | $ 15.55 | $ 32,350 |
| Kalamazoo-Portage, MI | 260 | 1.96 | 1.73 | $ 15.01 | $ 31,220 |
| Wausau, WI | 130 | 1.96 | 1.72 | $ 16.70 | $ 34,740 |
| Staunton-Waynesboro, VA | 90 | 1.95 | 1.72 | $ 17.30 | $ 35,980 |
Top paying metropolitan areas for Merchandise Displayers and Window Trimmers:
| Metropolitan area | Employment (1) | Employment per thousand jobs | Location quotient (9) | Hourly mean wage | Annual mean wage (2) |
|---|---|---|---|---|---|
| San Francisco-Oakland-Hayward, CA | 2,470 | 1.10 | 0.97 | $ 22.09 | $ 45,950 |
| Seattle-Tacoma-Bellevue, WA | 2,150 | 1.12 | 0.99 | $ 21.90 | $ 45,550 |
| Portland-South Portland, ME | 280 | 1.40 | 1.24 | $ 21.56 | $ 44,840 |
| Athens-Clarke County, GA | 140 | 1.68 | 1.48 | $ 21.36 | $ 44,430 |
| San Jose-Sunnyvale-Santa Clara, CA | 610 | 0.57 | 0.50 | $ 21.22 | $ 44,140 |
| New York-Newark-Jersey City, NY-NJ-PA | 7,750 | 0.89 | 0.79 | $ 20.49 | $ 42,620 |
| Bangor, ME | 110 | 1.70 | 1.50 | $ 20.31 | $ 42,250 |
| Gainesville, GA | 150 | 1.71 | 1.51 | $ 20.18 | $ 41,970 |
| Portsmouth, NH-ME | 80 | 0.89 | 0.78 | $ 20.17 | $ 41,960 |
| Boulder, CO | 140 | 0.75 | 0.66 | $ 20.16 | $ 41,940 |
Nonmetropolitan areas with the highest employment in Merchandise Displayers and Window Trimmers:
| Nonmetropolitan area | Employment (1) | Employment per thousand jobs | Location quotient (9) | Hourly mean wage | Annual mean wage (2) |
|---|---|---|---|---|---|
| Balance of Lower Peninsula of Michigan nonmetropolitan area | 340 | 1.33 | 1.17 | $ 15.31 | $ 31,840 |
| West Northwestern Ohio nonmetropolitan area | 290 | 1.21 | 1.06 | $ 15.25 | $ 31,710 |
| North Northeastern Ohio nonmetropolitan area (noncontiguous) | 280 | 0.89 | 0.79 | $ 14.67 | $ 30,510 |
| Southern Ohio nonmetropolitan area | 260 | 1.71 | 1.51 | $ 15.52 | $ 32,280 |
| Piedmont North Carolina nonmetropolitan area | 260 | 1.07 | 0.94 | $ 16.20 | $ 33,690 |
Nonmetropolitan areas with the highest concentration of jobs and location quotients in Merchandise Displayers and Window Trimmers:
| Nonmetropolitan area | Employment (1) | Employment per thousand jobs | Location quotient (9) | Hourly mean wage | Annual mean wage (2) |
|---|---|---|---|---|---|
| Central New Hampshire nonmetropolitan area | 180 | 2.00 | 1.77 | $ 17.56 | $ 36,520 |
| Northwest Lower Peninsula of Michigan nonmetropolitan area | 230 | 2.00 | 1.76 | $ 15.23 | $ 31,670 |
| Hawaii / Kauai nonmetropolitan area | 150 | 1.71 | 1.51 | $ 17.37 | $ 36,120 |
| Southern Ohio nonmetropolitan area | 260 | 1.71 | 1.51 | $ 15.52 | $ 32,280 |
| Southwest Montana nonmetropolitan area | 210 | 1.52 | 1.34 | $ 14.58 | $ 30,330 |
Top paying nonmetropolitan areas for Merchandise Displayers and Window Trimmers:
| Nonmetropolitan area | Employment (1) | Employment per thousand jobs | Location quotient (9) | Hourly mean wage | Annual mean wage (2) |
|---|---|---|---|---|---|
| Southwest Maine nonmetropolitan area | 130 | 0.72 | 0.64 | $ 19.11 | $ 39,750 |
| Southwest Alabama nonmetropolitan area | 40 | 0.57 | 0.50 | $ 18.66 | $ 38,810 |
| Northwest Colorado nonmetropolitan area | 90 | 0.75 | 0.66 | $ 18.07 | $ 37,580 |
| Central New Hampshire nonmetropolitan area | 180 | 2.00 | 1.77 | $ 17.56 | $ 36,520 |
| North Coast Region of California nonmetropolitan area | 70 | 0.72 | 0.63 | $ 17.50 | $ 36,400 |
These estimates are calculated with data collected from employers in all industry sectors, all metropolitan and nonmetropolitan areas, and all states and the District of Columbia. The top employment and wage figures are provided above. The complete list is available in the downloadable XLS files.
The percentile wage estimate is the value of a wage below which a certain percent of workers fall. The median wage is the 50th percentile wage estimate—50 percent of workers earn less than the median and 50 percent of workers earn more than the median. More about percentile wages.
(1) Estimates for detailed occupations do not sum to the totals because the totals include occupations not shown separately. Estimates do not include self-employed workers.
(2) Annual wages have been calculated by multiplying the hourly mean wage by a "year-round, full-time" hours figure of 2,080 hours; for those occupations where there is not an hourly wage published, the annual wage has been directly calculated from the reported survey data.
(3) The relative standard error (RSE) is a measure of the reliability of a survey statistic. The smaller the relative standard error, the more precise the estimate.
(9) The location quotient is the ratio of the area concentration of occupational employment to the national average concentration. A location quotient greater than one indicates the occupation has a higher share of employment than average, and a location quotient less than one indicates the occupation is less prevalent in the area than average.
Other OEWS estimates and related information:
May 2021 National Occupational Employment and Wage Estimates
May 2021 State Occupational Employment and Wage Estimates
May 2021 Metropolitan and Nonmetropolitan Area Occupational Employment and Wage Estimates
May 2021 National Industry-Specific Occupational Employment and Wage Estimates
Last Modified Date: March 31, 2022