
An official website of the United States government
An official website of the United States government
The .gov means it's official.
Federal government websites often end in .gov or .mil. Before sharing sensitive information,
make sure you're on a federal government site.
The site is secure.
The
https:// ensures that you are connecting to the official website and that any
information you provide is encrypted and transmitted securely.
Instruct or coach groups or individuals in the fundamentals of sports for the primary purpose of competition. Demonstrate techniques and methods of participation. May evaluate athletes� strengths and weaknesses as possible recruits or to improve the athletes� technique to prepare them for competition. Those required to hold teaching certifications should be reported in the appropriate teaching category. Excludes �Athletic Trainers� (29-9091).
Employment estimate and mean wage estimates for Coaches and Scouts:
| Employment (1) | Employment RSE (3) |
Mean hourly wage |
Mean annual wage (2) |
Mean wage RSE (3) |
|---|---|---|---|---|
| 193,740 | 1.5 % | (4) | $ 50,550 | 1.1 % |
Percentile wage estimates for Coaches and Scouts:
| Percentile | 10% | 25% | 50% (Median) |
75% | 90% |
|---|---|---|---|---|---|
| Annual Wage (2) | $ 22,200 | $ 29,240 | $ 38,970 | $ 60,400 | $ 80,720 |
Industries with the highest published employment and wages for Coaches and Scouts are provided. For a list of all industries with employment in Coaches and Scouts, see the Create Customized Tables function.
Industries with the highest levels of employment in Coaches and Scouts:
| Industry | Employment (1) | Percent of industry employment | Hourly mean wage | Annual mean wage (2) |
|---|---|---|---|---|
| Colleges, Universities, and Professional Schools | 47,020 | 1.58 | (4) | $ 64,040 |
| Other Schools and Instruction | 44,920 | 11.29 | (4) | $ 38,470 |
| Elementary and Secondary Schools | 38,920 | 0.48 | (4) | $ 46,000 |
| Other Amusement and Recreation Industries | 33,400 | 3.01 | (4) | $ 48,450 |
| Spectator Sports | 11,700 | 10.25 | (4) | $ 73,070 |
Industries with the highest concentration of employment in Coaches and Scouts:
| Industry | Employment (1) | Percent of industry employment | Hourly mean wage | Annual mean wage (2) |
|---|---|---|---|---|
| Other Schools and Instruction | 44,920 | 11.29 | (4) | $ 38,470 |
| Spectator Sports | 11,700 | 10.25 | (4) | $ 73,070 |
| Other Amusement and Recreation Industries | 33,400 | 3.01 | (4) | $ 48,450 |
| Colleges, Universities, and Professional Schools | 47,020 | 1.58 | (4) | $ 64,040 |
| Civic and Social Organizations | 3,340 | 1.28 | (4) | $ 36,960 |
Top paying industries for Coaches and Scouts:
| Industry | Employment (1) | Percent of industry employment | Hourly mean wage | Annual mean wage (2) |
|---|---|---|---|---|
| Spectator Sports | 11,700 | 10.25 | (4) | $ 73,070 |
| Federal Executive Branch (OEWS Designation) | 360 | 0.02 | (4) | $ 69,050 |
| Agents and Managers for Artists, Athletes, Entertainers, and Other Public Figures | 40 | 0.18 | (4) | $ 68,530 |
| Business, Professional, Labor, Political, and Similar Organizations | 1,180 | 0.29 | (4) | $ 68,530 |
| Colleges, Universities, and Professional Schools | 47,020 | 1.58 | (4) | $ 64,040 |
States and areas with the highest published employment, location quotients, and wages for Coaches and Scouts are provided. For a list of all areas with employment in Coaches and Scouts, see the Create Customized Tables function.
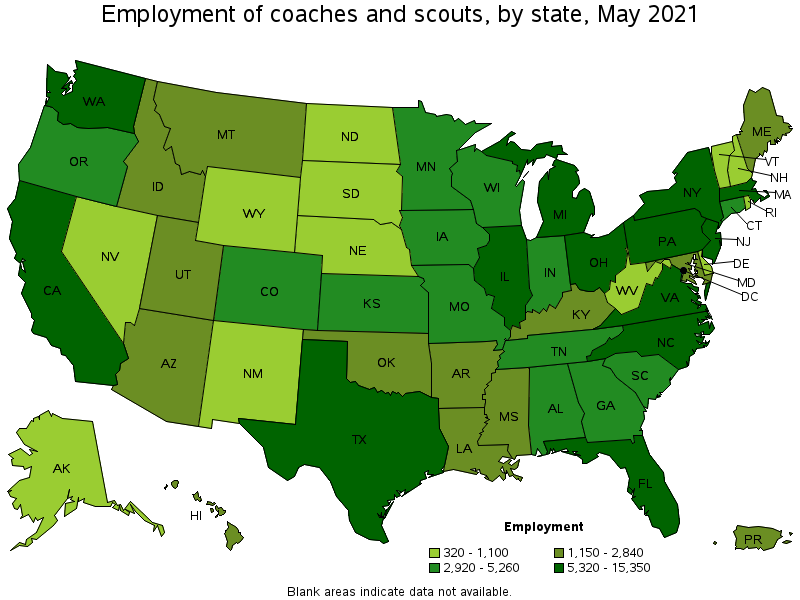
States with the highest employment level in Coaches and Scouts:
| State | Employment (1) | Employment per thousand jobs | Location quotient (9) | Hourly mean wage | Annual mean wage (2) |
|---|---|---|---|---|---|
| California | 15,350 | 0.93 | 0.68 | (4) | $ 57,210 |
| New York | 12,310 | 1.42 | 1.03 | (4) | $ 58,470 |
| Texas | 11,260 | 0.92 | 0.67 | (4) | $ 52,260 |
| Florida | 9,950 | 1.16 | 0.84 | (4) | $ 48,090 |
| Ohio | 8,820 | 1.70 | 1.23 | (4) | $ 50,510 |
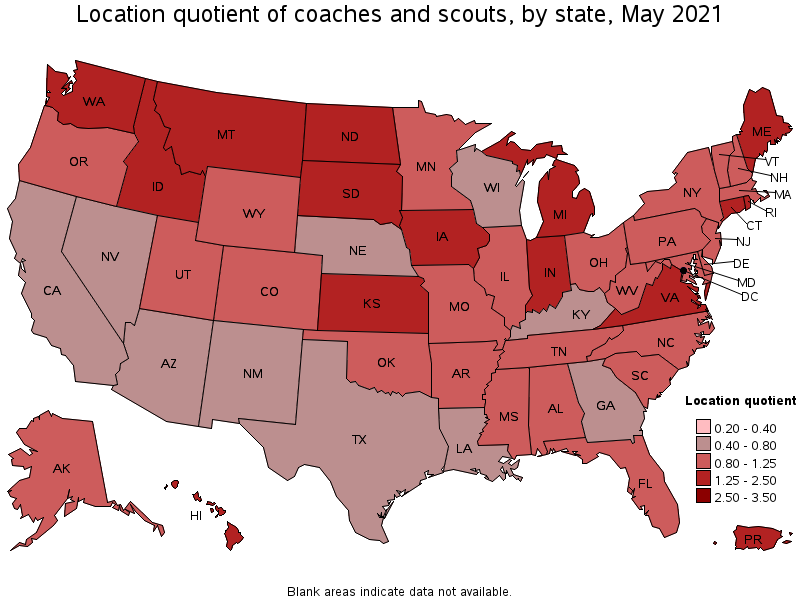
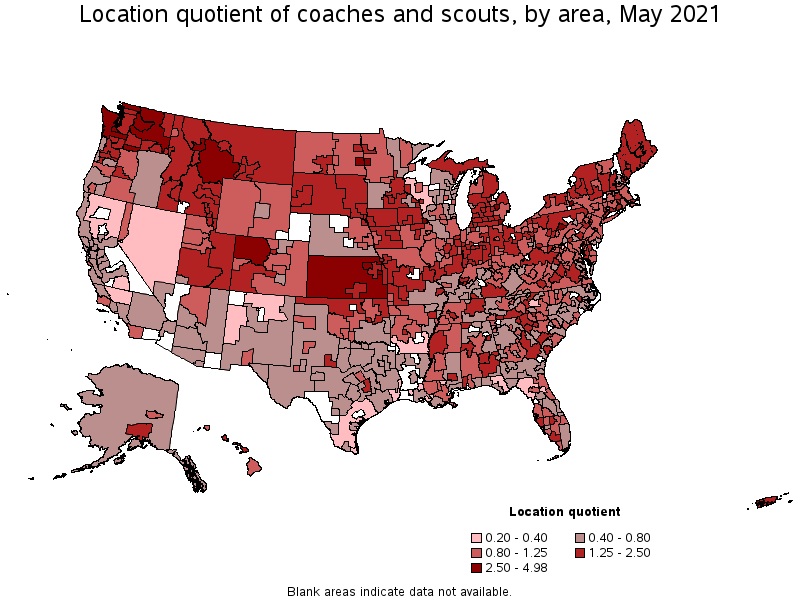
States with the highest concentration of jobs and location quotients in Coaches and Scouts:
| State | Employment (1) | Employment per thousand jobs | Location quotient (9) | Hourly mean wage | Annual mean wage (2) |
|---|---|---|---|---|---|
| Montana | 1,500 | 3.19 | 2.32 | (4) | $ 36,020 |
| Washington | 8,660 | 2.70 | 1.96 | (4) | $ 51,770 |
| South Dakota | 1,100 | 2.60 | 1.89 | (4) | $ 41,310 |
| Kansas | 3,440 | 2.57 | 1.87 | (4) | $ 38,840 |
| North Dakota | 1,010 | 2.55 | 1.85 | (4) | $ 41,350 |
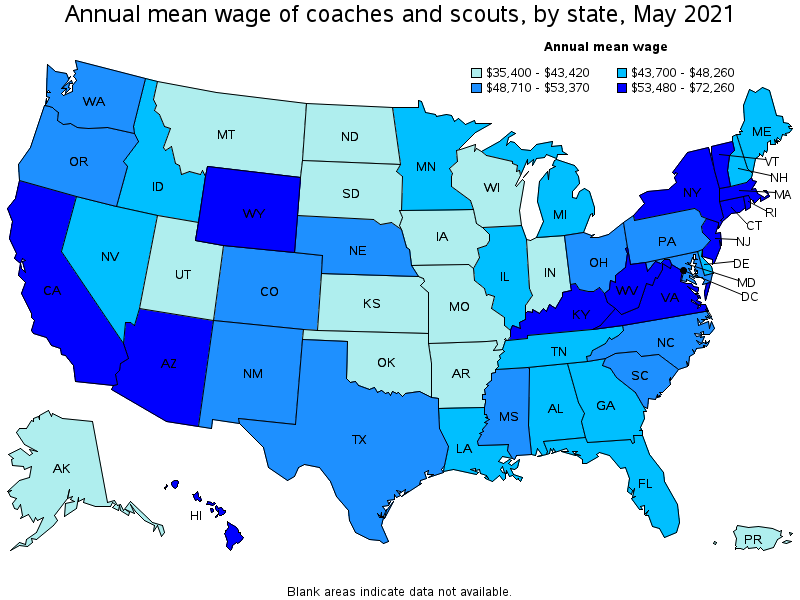
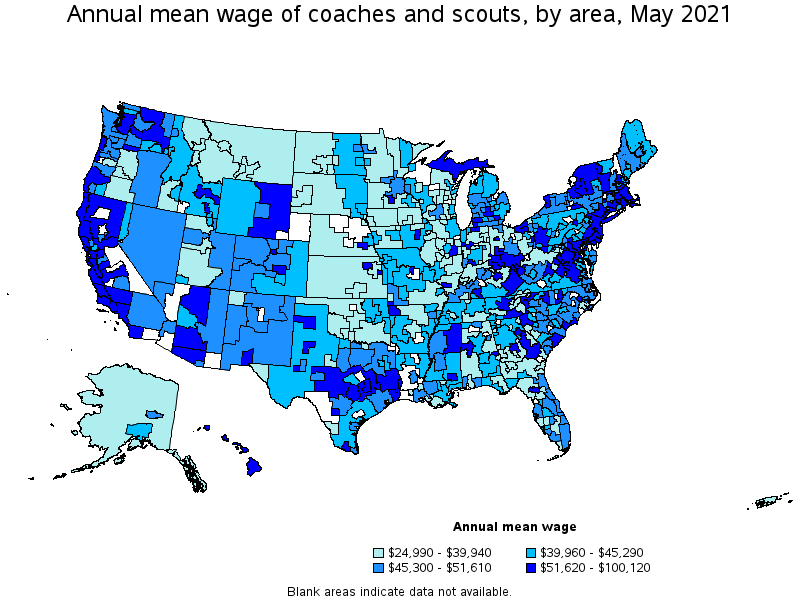
Top paying states for Coaches and Scouts:
| State | Employment (1) | Employment per thousand jobs | Location quotient (9) | Hourly mean wage | Annual mean wage (2) |
|---|---|---|---|---|---|
| District of Columbia | 490 | 0.74 | 0.53 | (4) | $ 72,260 |
| New Jersey | 5,330 | 1.38 | 1.01 | (4) | $ 66,200 |
| Massachusetts | 5,320 | 1.57 | 1.14 | (4) | $ 63,160 |
| Hawaii | 1,150 | 2.11 | 1.53 | (4) | $ 60,370 |
| Vermont | 470 | 1.66 | 1.20 | (4) | $ 60,280 |
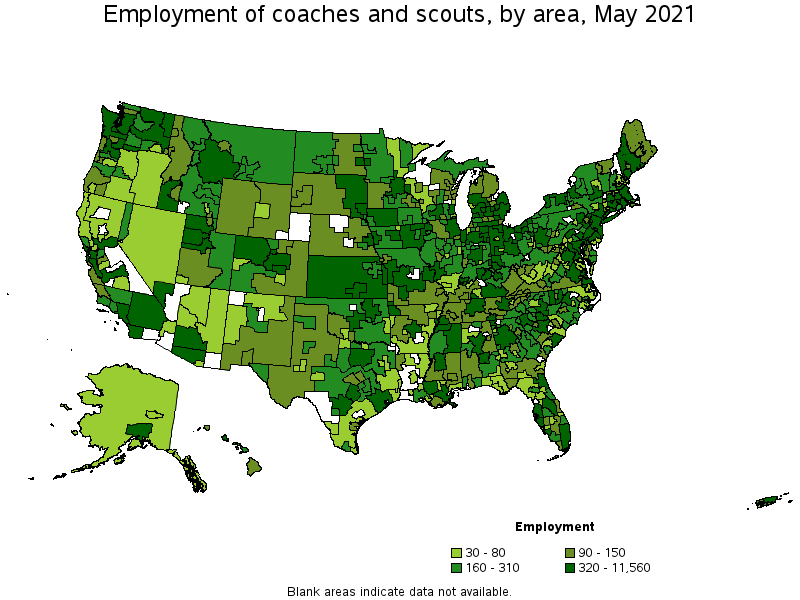
Metropolitan areas with the highest employment level in Coaches and Scouts:
| Metropolitan area | Employment (1) | Employment per thousand jobs | Location quotient (9) | Hourly mean wage | Annual mean wage (2) |
|---|---|---|---|---|---|
| New York-Newark-Jersey City, NY-NJ-PA | 11,560 | 1.33 | 0.97 | (4) | $ 64,340 |
| Chicago-Naperville-Elgin, IL-IN-WI | 6,280 | 1.48 | 1.08 | (4) | $ 45,030 |
| Los Angeles-Long Beach-Anaheim, CA | 5,760 | 1.01 | 0.73 | (4) | $ 57,290 |
| Seattle-Tacoma-Bellevue, WA | 4,530 | 2.36 | 1.72 | (4) | $ 55,280 |
| Philadelphia-Camden-Wilmington, PA-NJ-DE-MD | 4,230 | 1.60 | 1.16 | (4) | $ 57,460 |
| Washington-Arlington-Alexandria, DC-VA-MD-WV | 4,080 | 1.39 | 1.01 | (4) | $ 56,500 |
| Boston-Cambridge-Nashua, MA-NH | 3,960 | 1.53 | 1.11 | (4) | $ 66,370 |
| Dallas-Fort Worth-Arlington, TX | 3,640 | 1.01 | 0.74 | (4) | $ 48,570 |
| Minneapolis-St. Paul-Bloomington, MN-WI | 3,330 | 1.83 | 1.33 | (4) | $ 50,710 |
| Detroit-Warren-Dearborn, MI | 2,990 | 1.66 | 1.21 | (4) | $ 42,260 |
Metropolitan areas with the highest concentration of jobs and location quotients in Coaches and Scouts:
| Metropolitan area | Employment (1) | Employment per thousand jobs | Location quotient (9) | Hourly mean wage | Annual mean wage (2) |
|---|---|---|---|---|---|
| Wenatchee, WA | 240 | 5.22 | 3.80 | (4) | $ 45,490 |
| Manhattan, KS | 170 | 4.59 | 3.34 | (4) | $ 73,760 |
| Lawrence, KS | 210 | 4.59 | 3.34 | (4) | $ 57,570 |
| Missoula, MT | 250 | 4.09 | 2.97 | (4) | $ 31,970 |
| Monroe, MI | 140 | 3.88 | 2.82 | (4) | $ 45,700 |
| Fargo, ND-MN | 510 | 3.78 | 2.75 | (4) | $ 45,140 |
| Ithaca, NY | 170 | 3.70 | 2.69 | (8) | (8) |
| Bellingham, WA | 300 | 3.68 | 2.67 | (4) | $ 48,740 |
| State College, PA | 230 | 3.62 | 2.63 | (4) | $ 44,820 |
| Olympia-Tumwater, WA | 400 | 3.60 | 2.62 | (4) | $ 48,380 |
Top paying metropolitan areas for Coaches and Scouts:
| Metropolitan area | Employment (1) | Employment per thousand jobs | Location quotient (9) | Hourly mean wage | Annual mean wage (2) |
|---|---|---|---|---|---|
| Morgantown, WV | 90 | 1.37 | 0.99 | (4) | $ 100,120 |
| Lubbock, TX | 230 | 1.62 | 1.18 | (4) | $ 90,140 |
| Auburn-Opelika, AL | 200 | 3.43 | 2.49 | (4) | $ 88,490 |
| Athens-Clarke County, GA | 140 | 1.67 | 1.21 | (4) | $ 85,420 |
| Burlington-South Burlington, VT | 130 | 1.12 | 0.82 | (4) | $ 84,300 |
| Durham-Chapel Hill, NC | 370 | 1.18 | 0.86 | (4) | $ 80,900 |
| Tuscaloosa, AL | 200 | 2.07 | 1.51 | (4) | $ 78,730 |
| Bloomington, IN | 200 | 2.90 | 2.11 | (4) | $ 77,390 |
| Champaign-Urbana, IL | 230 | 2.38 | 1.73 | (4) | $ 75,160 |
| Greenville, NC | 130 | 1.76 | 1.28 | (4) | $ 74,420 |
Nonmetropolitan areas with the highest employment in Coaches and Scouts:
| Nonmetropolitan area | Employment (1) | Employment per thousand jobs | Location quotient (9) | Hourly mean wage | Annual mean wage (2) |
|---|---|---|---|---|---|
| Kansas nonmetropolitan area | 1,370 | 3.63 | 2.64 | (4) | $ 31,500 |
| North Northeastern Ohio nonmetropolitan area (noncontiguous) | 850 | 2.71 | 1.97 | (4) | $ 29,760 |
| Balance of Lower Peninsula of Michigan nonmetropolitan area | 750 | 2.97 | 2.16 | (4) | $ 45,710 |
| West Northwestern Ohio nonmetropolitan area | 530 | 2.21 | 1.61 | (4) | $ 31,990 |
| Southwest Montana nonmetropolitan area | 500 | 3.63 | 2.64 | (4) | $ 38,620 |
Nonmetropolitan areas with the highest concentration of jobs and location quotients in Coaches and Scouts:
| Nonmetropolitan area | Employment (1) | Employment per thousand jobs | Location quotient (9) | Hourly mean wage | Annual mean wage (2) |
|---|---|---|---|---|---|
| Eastern Washington nonmetropolitan area | 500 | 5.33 | 3.87 | (4) | $ 59,220 |
| Kansas nonmetropolitan area | 1,370 | 3.63 | 2.64 | (4) | $ 31,500 |
| Southwest Montana nonmetropolitan area | 500 | 3.63 | 2.64 | (4) | $ 38,620 |
| Western Washington nonmetropolitan area | 430 | 3.62 | 2.63 | (4) | $ 47,530 |
| Northwest Colorado nonmetropolitan area | 400 | 3.44 | 2.50 | (4) | $ 45,880 |
Top paying nonmetropolitan areas for Coaches and Scouts:
| Nonmetropolitan area | Employment (1) | Employment per thousand jobs | Location quotient (9) | Hourly mean wage | Annual mean wage (2) |
|---|---|---|---|---|---|
| Eastern Wyoming nonmetropolitan area | 130 | 1.65 | 1.20 | (4) | $ 72,710 |
| Northeast Mississippi nonmetropolitan area | 360 | 1.64 | 1.19 | (4) | $ 68,200 |
| Hawaii / Kauai nonmetropolitan area | 130 | 1.51 | 1.10 | (4) | $ 61,320 |
| Big Thicket Region of Texas nonmetropolitan area | 80 | 0.78 | 0.57 | (4) | $ 61,010 |
| North Coast Region of California nonmetropolitan area | 60 | 0.58 | 0.42 | (4) | $ 60,760 |
These estimates are calculated with data collected from employers in all industry sectors, all metropolitan and nonmetropolitan areas, and all states and the District of Columbia. The top employment and wage figures are provided above. The complete list is available in the downloadable XLS files.
The percentile wage estimate is the value of a wage below which a certain percent of workers fall. The median wage is the 50th percentile wage estimate—50 percent of workers earn less than the median and 50 percent of workers earn more than the median. More about percentile wages.
(1) Estimates for detailed occupations do not sum to the totals because the totals include occupations not shown separately. Estimates do not include self-employed workers.
(2) Annual wages have been calculated by multiplying the hourly mean wage by a "year-round, full-time" hours figure of 2,080 hours; for those occupations where there is not an hourly wage published, the annual wage has been directly calculated from the reported survey data.
(3) The relative standard error (RSE) is a measure of the reliability of a survey statistic. The smaller the relative standard error, the more precise the estimate.
(4) Wages for some occupations that do not generally work year-round, full time, are reported either as hourly wages or annual salaries depending on how they are typically paid.
(8) Estimate not released.
(9) The location quotient is the ratio of the area concentration of occupational employment to the national average concentration. A location quotient greater than one indicates the occupation has a higher share of employment than average, and a location quotient less than one indicates the occupation is less prevalent in the area than average.
Other OEWS estimates and related information:
May 2021 National Occupational Employment and Wage Estimates
May 2021 State Occupational Employment and Wage Estimates
May 2021 Metropolitan and Nonmetropolitan Area Occupational Employment and Wage Estimates
May 2021 National Industry-Specific Occupational Employment and Wage Estimates
Last Modified Date: March 31, 2022