
An official website of the United States government
An official website of the United States government
The .gov means it's official.
Federal government websites often end in .gov or .mil. Before sharing sensitive information,
make sure you're on a federal government site.
The site is secure.
The
https:// ensures that you are connecting to the official website and that any
information you provide is encrypted and transmitted securely.
Play prerecorded music for live audiences at venues or events such as clubs, parties, or wedding receptions. May use techniques such as mixing, cutting, or sampling to manipulate recordings. May also perform as emcee (master of ceremonies). Radio disc jockeys are included in �Broadcast Announcers and Radio Disc Jockeys� (27-3011). Excludes �Musicians and Singers� (27-2042), �Audio and Video Technicians� (27-4011), and �Sound Engineering Technicians� (27-4014).
Employment estimate and mean wage estimates for Disc Jockeys, Except Radio:
| Employment (1) | Employment RSE (3) |
Mean hourly wage |
Mean annual wage (2) |
Wage RSE (3) |
|---|---|---|---|---|
| 4,770 | 12.3 % | $ 21.82 | (4) | 6.8 % |
Percentile wage estimates for Disc Jockeys, Except Radio:
| Percentile | 10% | 25% | 50% (Median) |
75% | 90% |
|---|---|---|---|---|---|
| Hourly Wage | $ 9.68 | $ 13.63 | $ 15.70 | $ 23.54 | $ 37.98 |
Industries with the highest published employment and wages for Disc Jockeys, Except Radio are provided. For a list of all industries with employment in Disc Jockeys, Except Radio, see the Create Customized Tables function.
Industries with the highest levels of employment in Disc Jockeys, Except Radio:
| Industry | Employment (1) | Percent of industry employment | Hourly mean wage | Annual mean wage (2) |
|---|---|---|---|---|
| Drinking Places (Alcoholic Beverages) | 1,280 | 0.42 | $ 19.02 | (4) |
| Independent Artists, Writers, and Performers | 1,210 | 2.67 | $ 23.69 | (4) |
| Other Amusement and Recreation Industries | 560 | 0.05 | $ 15.94 | (4) |
| Restaurants and Other Eating Places | 500 | 0.01 | (8) | (8) |
| Performing Arts Companies | 110 | 0.15 | $ 35.69 | (4) |
Industries with the highest concentration of employment in Disc Jockeys, Except Radio:
| Industry | Employment (1) | Percent of industry employment | Hourly mean wage | Annual mean wage (2) |
|---|---|---|---|---|
| Independent Artists, Writers, and Performers | 1,210 | 2.67 | $ 23.69 | (4) |
| Drinking Places (Alcoholic Beverages) | 1,280 | 0.42 | $ 19.02 | (4) |
| Performing Arts Companies | 110 | 0.15 | $ 35.69 | (4) |
| Other Amusement and Recreation Industries | 560 | 0.05 | $ 15.94 | (4) |
| Spectator Sports | 50 | 0.04 | $ 42.59 | (4) |
Top paying industries for Disc Jockeys, Except Radio:
| Industry | Employment (1) | Percent of industry employment | Hourly mean wage | Annual mean wage (2) |
|---|---|---|---|---|
| Radio and Television Broadcasting | (8) | (8) | $ 16.04 | (4) |
| Spectator Sports | 50 | 0.04 | $ 42.59 | (4) |
| Performing Arts Companies | 110 | 0.15 | $ 35.69 | (4) |
| Independent Artists, Writers, and Performers | 1,210 | 2.67 | $ 23.69 | (4) |
| Other Amusement and Recreation Industries | 560 | 0.05 | $ 15.94 | (4) |
States and areas with the highest published employment, location quotients, and wages for Disc Jockeys, Except Radio are provided. For a list of all areas with employment in Disc Jockeys, Except Radio, see the Create Customized Tables function.
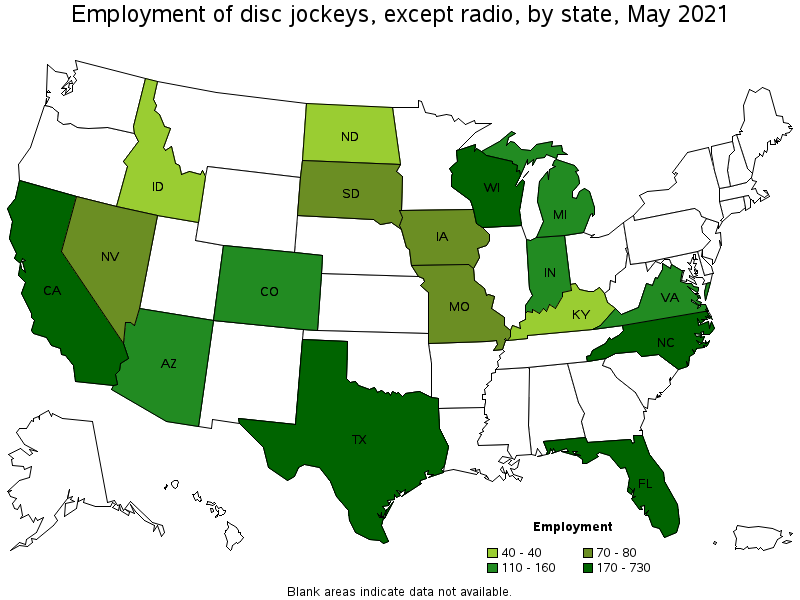
States with the highest employment level in Disc Jockeys, Except Radio:
| State | Employment (1) | Employment per thousand jobs | Location quotient (9) | Hourly mean wage | Annual mean wage (2) |
|---|---|---|---|---|---|
| California | 730 | 0.04 | 1.30 | $ 26.69 | (4) |
| Florida | 690 | 0.08 | 2.37 | $ 24.27 | (4) |
| Texas | 380 | 0.03 | 0.91 | $ 19.71 | (4) |
| North Carolina | 300 | 0.07 | 1.98 | $ 13.96 | (4) |
| Wisconsin | 170 | 0.06 | 1.78 | $ 20.60 | (4) |
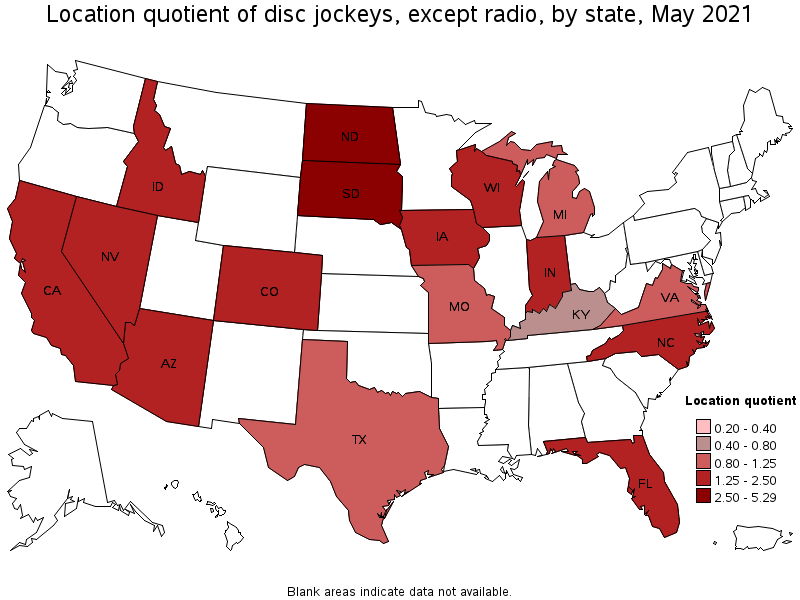
States with the highest concentration of jobs and location quotients in Disc Jockeys, Except Radio:
| State | Employment (1) | Employment per thousand jobs | Location quotient (9) | Hourly mean wage | Annual mean wage (2) |
|---|---|---|---|---|---|
| South Dakota | 80 | 0.18 | 5.29 | $ 18.77 | (4) |
| North Dakota | 40 | 0.11 | 3.34 | $ 25.52 | (4) |
| Florida | 690 | 0.08 | 2.37 | $ 24.27 | (4) |
| North Carolina | 300 | 0.07 | 1.98 | $ 13.96 | (4) |
| Wisconsin | 170 | 0.06 | 1.78 | $ 20.60 | (4) |
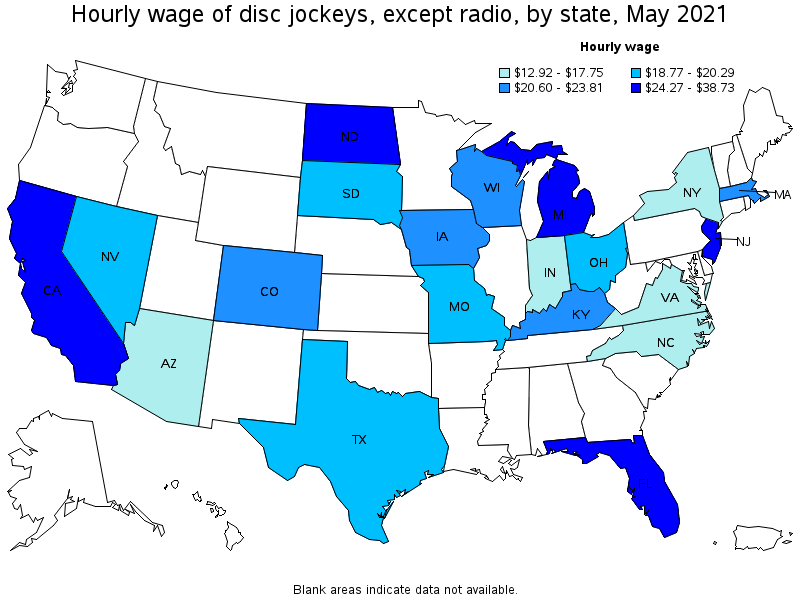
Top paying states for Disc Jockeys, Except Radio:
| State | Employment (1) | Employment per thousand jobs | Location quotient (9) | Hourly mean wage | Annual mean wage (2) |
|---|---|---|---|---|---|
| Arizona | 140 | 0.05 | 1.47 | $ 13.86 | (4) |
| California | 730 | 0.04 | 1.30 | $ 26.69 | (4) |
| Colorado | 110 | 0.04 | 1.29 | $ 22.55 | (4) |
| Florida | 690 | 0.08 | 2.37 | $ 24.27 | (4) |
| Indiana | 160 | 0.05 | 1.60 | $ 12.92 | (4) |
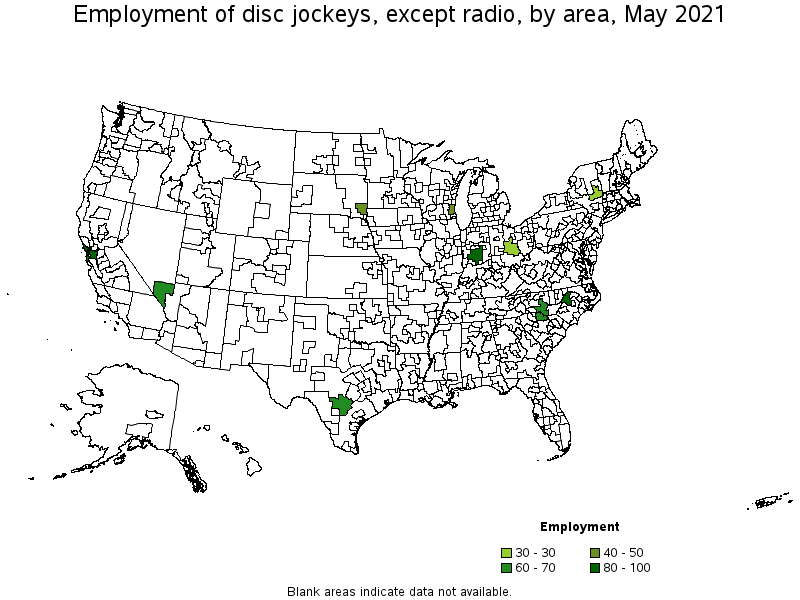
Metropolitan areas with the highest employment level in Disc Jockeys, Except Radio:
| Metropolitan area | Employment (1) | Employment per thousand jobs | Location quotient (9) | Hourly mean wage | Annual mean wage (2) |
|---|---|---|---|---|---|
| San Francisco-Oakland-Hayward, CA | 100 | 0.04 | 1.28 | $ 23.55 | (4) |
| Indianapolis-Carmel-Anderson, IN | 80 | 0.08 | 2.43 | $ 13.46 | (4) |
| Raleigh, NC | 80 | 0.12 | 3.59 | $ 15.19 | (4) |
| Charlotte-Concord-Gastonia, NC-SC | 70 | 0.06 | 1.78 | $ 14.56 | (4) |
| Las Vegas-Henderson-Paradise, NV | 60 | 0.07 | 2.04 | $ 19.23 | (4) |
| San Antonio-New Braunfels, TX | 60 | 0.06 | 1.73 | $ 18.79 | (4) |
| Milwaukee-Waukesha-West Allis, WI | 50 | 0.06 | 1.88 | $ 23.64 | (4) |
| Sioux Falls, SD | 40 | 0.27 | 8.09 | $ 18.63 | (4) |
| Albany-Schenectady-Troy, NY | 30 | 0.08 | 2.24 | $ 18.07 | (4) |
| Columbus, OH | 30 | 0.03 | 0.90 | (8) | (8) |
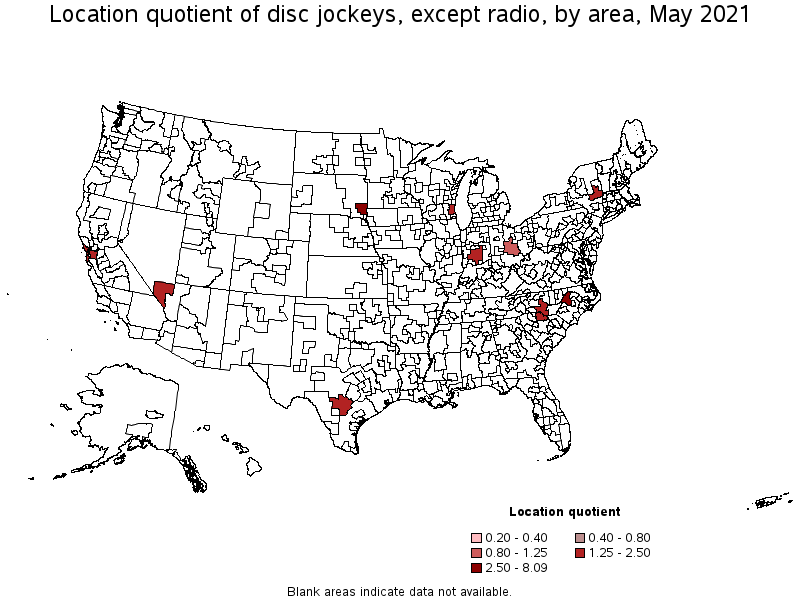
Metropolitan areas with the highest concentration of jobs and location quotients in Disc Jockeys, Except Radio:
| Metropolitan area | Employment (1) | Employment per thousand jobs | Location quotient (9) | Hourly mean wage | Annual mean wage (2) |
|---|---|---|---|---|---|
| Sioux Falls, SD | 40 | 0.27 | 8.09 | $ 18.63 | (4) |
| Raleigh, NC | 80 | 0.12 | 3.59 | $ 15.19 | (4) |
| Indianapolis-Carmel-Anderson, IN | 80 | 0.08 | 2.43 | $ 13.46 | (4) |
| Albany-Schenectady-Troy, NY | 30 | 0.08 | 2.24 | $ 18.07 | (4) |
| Las Vegas-Henderson-Paradise, NV | 60 | 0.07 | 2.04 | $ 19.23 | (4) |
| Milwaukee-Waukesha-West Allis, WI | 50 | 0.06 | 1.88 | $ 23.64 | (4) |
| Charlotte-Concord-Gastonia, NC-SC | 70 | 0.06 | 1.78 | $ 14.56 | (4) |
| San Antonio-New Braunfels, TX | 60 | 0.06 | 1.73 | $ 18.79 | (4) |
| San Francisco-Oakland-Hayward, CA | 100 | 0.04 | 1.28 | $ 23.55 | (4) |
| Columbus, OH | 30 | 0.03 | 0.90 | (8) | (8) |
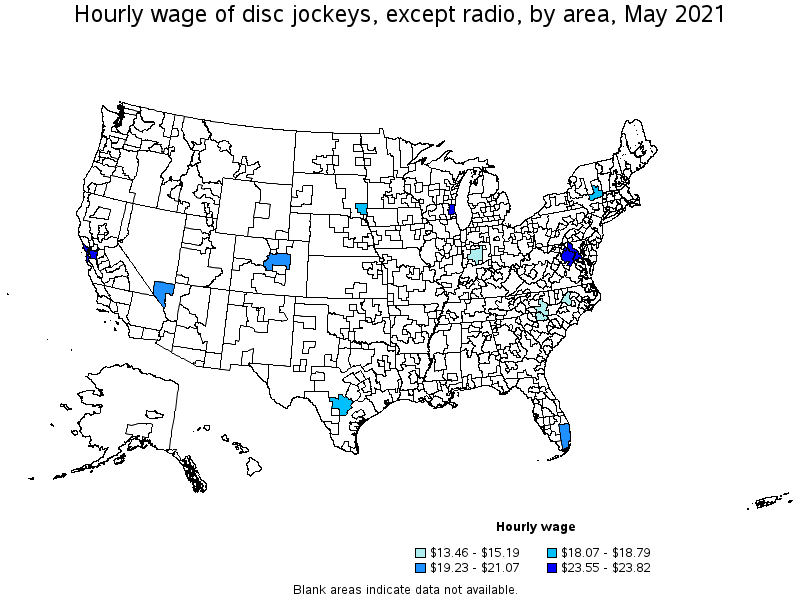
Top paying metropolitan areas for Disc Jockeys, Except Radio:
| Metropolitan area | Employment (1) | Employment per thousand jobs | Location quotient (9) | Hourly mean wage | Annual mean wage (2) |
|---|---|---|---|---|---|
| Albany-Schenectady-Troy, NY | 30 | 0.08 | 2.24 | $ 18.07 | (4) |
| Charlotte-Concord-Gastonia, NC-SC | 70 | 0.06 | 1.78 | $ 14.56 | (4) |
| Denver-Aurora-Lakewood, CO | (8) | (8) | (8) | $ 21.07 | (4) |
| Indianapolis-Carmel-Anderson, IN | 80 | 0.08 | 2.43 | $ 13.46 | (4) |
| Las Vegas-Henderson-Paradise, NV | 60 | 0.07 | 2.04 | $ 19.23 | (4) |
| Miami-Fort Lauderdale-West Palm Beach, FL | (8) | (8) | (8) | $ 20.70 | (4) |
| Milwaukee-Waukesha-West Allis, WI | 50 | 0.06 | 1.88 | $ 23.64 | (4) |
| Raleigh, NC | 80 | 0.12 | 3.59 | $ 15.19 | (4) |
| San Antonio-New Braunfels, TX | 60 | 0.06 | 1.73 | $ 18.79 | (4) |
| San Francisco-Oakland-Hayward, CA | 100 | 0.04 | 1.28 | $ 23.55 | (4) |
These estimates are calculated with data collected from employers in all industry sectors, all metropolitan and nonmetropolitan areas, and all states and the District of Columbia. The top employment and wage figures are provided above. The complete list is available in the downloadable XLS files.
The percentile wage estimate is the value of a wage below which a certain percent of workers fall. The median wage is the 50th percentile wage estimate—50 percent of workers earn less than the median and 50 percent of workers earn more than the median. More about percentile wages.
(1) Estimates for detailed occupations do not sum to the totals because the totals include occupations not shown separately. Estimates do not include self-employed workers.
(2) Annual wages have been calculated by multiplying the hourly mean wage by a "year-round, full-time" hours figure of 2,080 hours; for those occupations where there is not an hourly wage published, the annual wage has been directly calculated from the reported survey data.
(3) The relative standard error (RSE) is a measure of the reliability of a survey statistic. The smaller the relative standard error, the more precise the estimate.
(4) Wages for some occupations that do not generally work year-round, full time, are reported either as hourly wages or annual salaries depending on how they are typically paid.
(8) Estimate not released.
(9) The location quotient is the ratio of the area concentration of occupational employment to the national average concentration. A location quotient greater than one indicates the occupation has a higher share of employment than average, and a location quotient less than one indicates the occupation is less prevalent in the area than average.
Other OEWS estimates and related information:
May 2021 National Occupational Employment and Wage Estimates
May 2021 State Occupational Employment and Wage Estimates
May 2021 Metropolitan and Nonmetropolitan Area Occupational Employment and Wage Estimates
May 2021 National Industry-Specific Occupational Employment and Wage Estimates
Last Modified Date: March 31, 2022