
An official website of the United States government
An official website of the United States government
The .gov means it's official.
Federal government websites often end in .gov or .mil. Before sharing sensitive information,
make sure you're on a federal government site.
The site is secure.
The
https:// ensures that you are connecting to the official website and that any
information you provide is encrypted and transmitted securely.
Set up, operate, and maintain the electronic equipment used to acquire, edit, and transmit audio and video for radio or television programs. Control and adjust incoming and outgoing broadcast signals to regulate sound volume, signal strength, and signal clarity. Operate satellite, microwave, or other transmitter equipment to broadcast radio or television programs.
Employment estimate and mean wage estimates for Broadcast Technicians:
| Employment (1) | Employment RSE (3) |
Mean hourly wage |
Mean annual wage (2) |
Wage RSE (3) |
|---|---|---|---|---|
| 25,270 | 6.4 % | $ 24.66 | $ 51,280 | 3.3 % |
Percentile wage estimates for Broadcast Technicians:
| Percentile | 10% | 25% | 50% (Median) |
75% | 90% |
|---|---|---|---|---|---|
| Hourly Wage | $ 11.82 | $ 14.45 | $ 21.51 | $ 30.09 | $ 43.68 |
| Annual Wage (2) | $ 24,580 | $ 30,060 | $ 44,740 | $ 62,590 | $ 90,850 |
Industries with the highest published employment and wages for Broadcast Technicians are provided. For a list of all industries with employment in Broadcast Technicians, see the Create Customized Tables function.
Industries with the highest levels of employment in Broadcast Technicians:
| Industry | Employment (1) | Percent of industry employment | Hourly mean wage | Annual mean wage (2) |
|---|---|---|---|---|
| Radio and Television Broadcasting | 18,230 | 9.57 | $ 22.16 | $ 46,100 |
| Cable and Other Subscription Programming | 1,780 | 3.73 | $ 29.82 | $ 62,030 |
| Motion Picture and Video Industries | 1,220 | 0.39 | $ 35.30 | $ 73,430 |
| Colleges, Universities, and Professional Schools | 820 | 0.03 | $ 28.88 | $ 60,060 |
| Telecommunications | 630 | 0.10 | $ 27.87 | $ 57,970 |
Industries with the highest concentration of employment in Broadcast Technicians:
| Industry | Employment (1) | Percent of industry employment | Hourly mean wage | Annual mean wage (2) |
|---|---|---|---|---|
| Radio and Television Broadcasting | 18,230 | 9.57 | $ 22.16 | $ 46,100 |
| Cable and Other Subscription Programming | 1,780 | 3.73 | $ 29.82 | $ 62,030 |
| Motion Picture and Video Industries | 1,220 | 0.39 | $ 35.30 | $ 73,430 |
| Promoters of Performing Arts, Sports, and Similar Events | 290 | 0.37 | $ 46.19 | $ 96,070 |
| Spectator Sports | 280 | 0.25 | $ 44.14 | $ 91,820 |
Top paying industries for Broadcast Technicians:
| Industry | Employment (1) | Percent of industry employment | Hourly mean wage | Annual mean wage (2) |
|---|---|---|---|---|
| Federal Executive Branch (OEWS Designation) | 40 | (7) | $ 49.98 | $ 103,960 |
| Advertising, Public Relations, and Related Services | 120 | 0.03 | $ 47.46 | $ 98,710 |
| Promoters of Performing Arts, Sports, and Similar Events | 290 | 0.37 | $ 46.19 | $ 96,070 |
| Accounting, Tax Preparation, Bookkeeping, and Payroll Services | (8) | (8) | $ 46.12 | $ 95,930 |
| Spectator Sports | 280 | 0.25 | $ 44.14 | $ 91,820 |
States and areas with the highest published employment, location quotients, and wages for Broadcast Technicians are provided. For a list of all areas with employment in Broadcast Technicians, see the Create Customized Tables function.
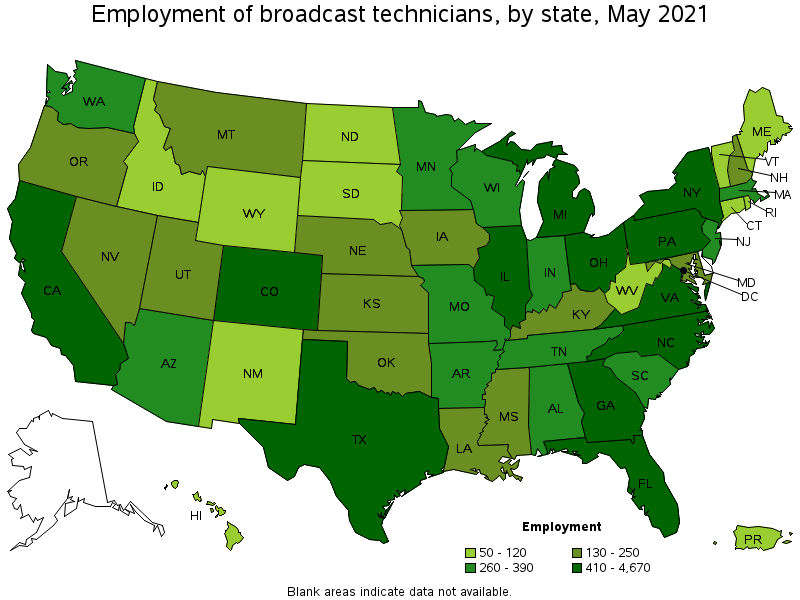
States with the highest employment level in Broadcast Technicians:
| State | Employment (1) | Employment per thousand jobs | Location quotient (9) | Hourly mean wage | Annual mean wage (2) |
|---|---|---|---|---|---|
| California | 4,670 | 0.28 | 1.57 | $ 22.35 | $ 46,490 |
| New York | 3,260 | 0.38 | 2.10 | $ 35.18 | $ 73,160 |
| Texas | 1,900 | 0.16 | 0.87 | $ 20.66 | $ 42,960 |
| Florida | 1,370 | 0.16 | 0.88 | $ 24.13 | $ 50,190 |
| Georgia | 1,080 | 0.25 | 1.38 | $ 21.75 | $ 45,250 |
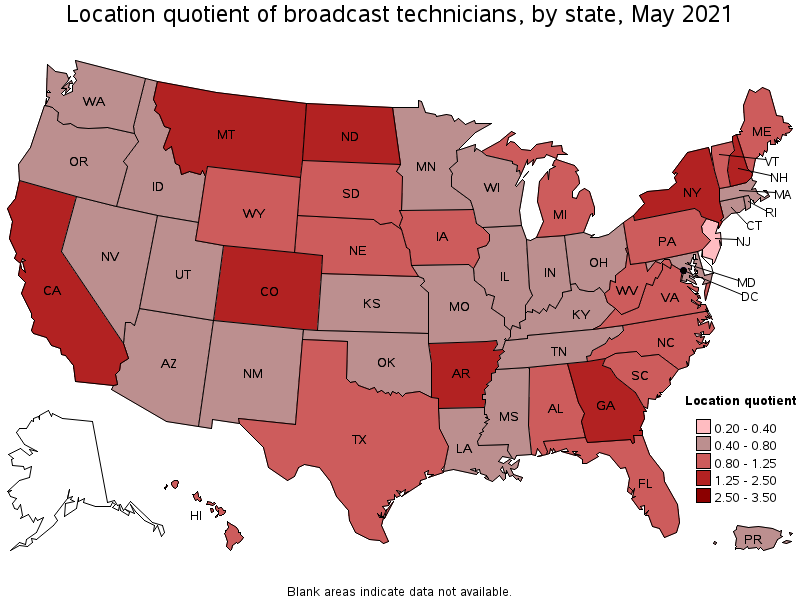
States with the highest concentration of jobs and location quotients in Broadcast Technicians:
| State | Employment (1) | Employment per thousand jobs | Location quotient (9) | Hourly mean wage | Annual mean wage (2) |
|---|---|---|---|---|---|
| District of Columbia | 410 | 0.63 | 3.49 | $ 35.33 | $ 73,480 |
| New York | 3,260 | 0.38 | 2.10 | $ 35.18 | $ 73,160 |
| Colorado | 790 | 0.30 | 1.68 | $ 31.89 | $ 66,320 |
| California | 4,670 | 0.28 | 1.57 | $ 22.35 | $ 46,490 |
| Arkansas | 320 | 0.27 | 1.52 | $ 18.66 | $ 38,820 |
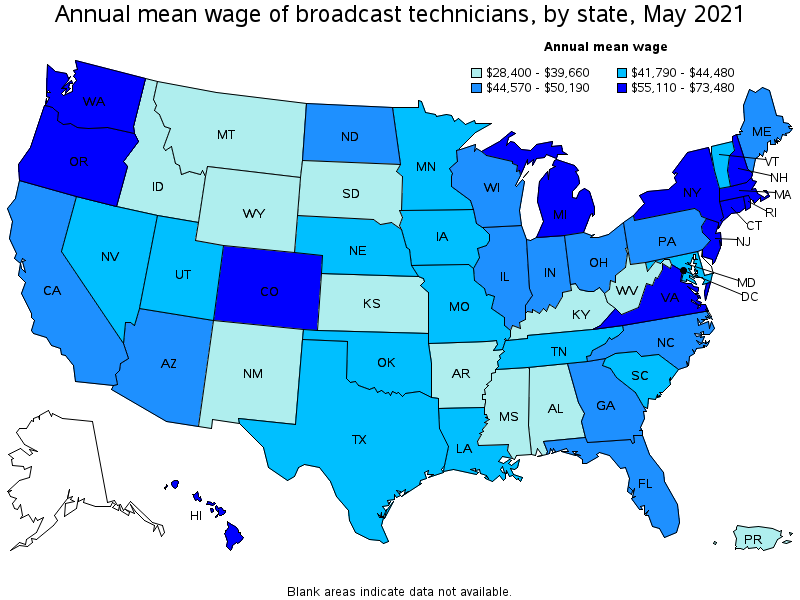
Top paying states for Broadcast Technicians:
| State | Employment (1) | Employment per thousand jobs | Location quotient (9) | Hourly mean wage | Annual mean wage (2) |
|---|---|---|---|---|---|
| District of Columbia | 410 | 0.63 | 3.49 | $ 35.33 | $ 73,480 |
| New York | 3,260 | 0.38 | 2.10 | $ 35.18 | $ 73,160 |
| Colorado | 790 | 0.30 | 1.68 | $ 31.89 | $ 66,320 |
| New Hampshire | 150 | 0.24 | 1.31 | $ 31.59 | $ 65,710 |
| New Jersey | 260 | 0.07 | 0.38 | $ 31.54 | $ 65,590 |
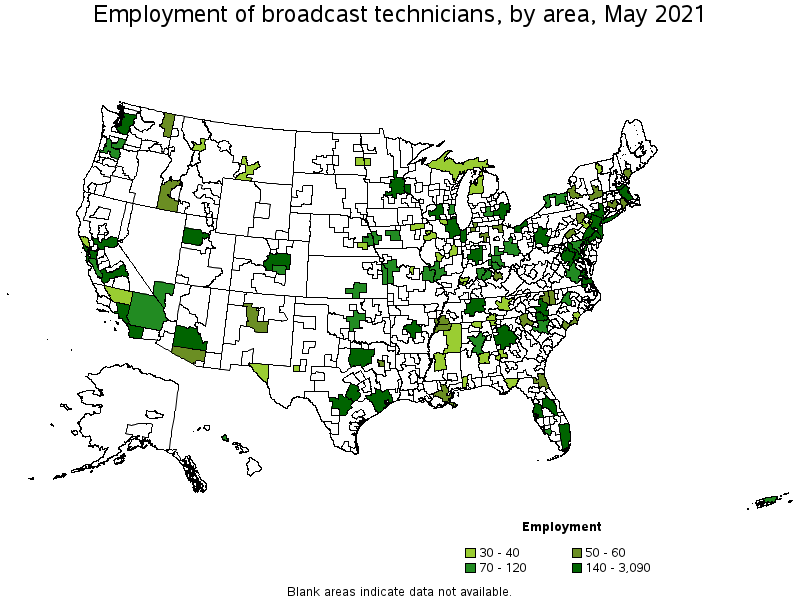
Metropolitan areas with the highest employment level in Broadcast Technicians:
| Metropolitan area | Employment (1) | Employment per thousand jobs | Location quotient (9) | Hourly mean wage | Annual mean wage (2) |
|---|---|---|---|---|---|
| Los Angeles-Long Beach-Anaheim, CA | 3,090 | 0.54 | 3.01 | $ 21.82 | $ 45,390 |
| New York-Newark-Jersey City, NY-NJ-PA | 3,060 | 0.35 | 1.97 | $ 36.27 | $ 75,430 |
| Atlanta-Sandy Springs-Roswell, GA | 850 | 0.33 | 1.83 | $ 23.25 | $ 48,370 |
| Washington-Arlington-Alexandria, DC-VA-MD-WV | 720 | 0.25 | 1.37 | $ 33.63 | $ 69,950 |
| Miami-Fort Lauderdale-West Palm Beach, FL | 650 | 0.26 | 1.47 | $ 27.80 | $ 57,830 |
| Denver-Aurora-Lakewood, CO | 640 | 0.44 | 2.45 | $ 33.52 | $ 69,710 |
| Dallas-Fort Worth-Arlington, TX | 540 | 0.15 | 0.84 | $ 22.14 | $ 46,040 |
| Chicago-Naperville-Elgin, IL-IN-WI | 530 | 0.13 | 0.70 | $ 24.43 | $ 50,810 |
| Philadelphia-Camden-Wilmington, PA-NJ-DE-MD | 460 | 0.17 | 0.97 | $ 24.37 | $ 50,690 |
| San Francisco-Oakland-Hayward, CA | 410 | 0.18 | 1.03 | $ 25.18 | $ 52,370 |
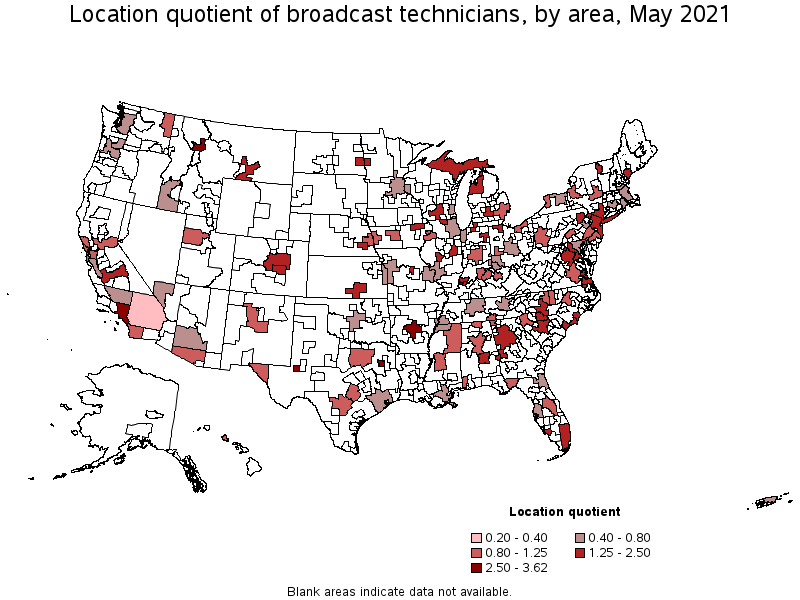
Metropolitan areas with the highest concentration of jobs and location quotients in Broadcast Technicians:
| Metropolitan area | Employment (1) | Employment per thousand jobs | Location quotient (9) | Hourly mean wage | Annual mean wage (2) |
|---|---|---|---|---|---|
| Odessa, TX | 40 | 0.65 | 3.62 | $ 19.02 | $ 39,560 |
| Missoula, MT | 30 | 0.57 | 3.19 | $ 14.64 | $ 30,440 |
| Los Angeles-Long Beach-Anaheim, CA | 3,090 | 0.54 | 3.01 | $ 21.82 | $ 45,390 |
| Little Rock-North Little Rock-Conway, AR | 170 | 0.52 | 2.93 | $ 19.44 | $ 40,430 |
| Tyler, TX | 50 | 0.49 | 2.74 | $ 19.00 | $ 39,520 |
| Denver-Aurora-Lakewood, CO | 640 | 0.44 | 2.45 | $ 33.52 | $ 69,710 |
| South Bend-Mishawaka, IN-MI | 50 | 0.43 | 2.42 | $ 18.93 | $ 39,370 |
| Lansing-East Lansing, MI | 80 | 0.43 | 2.39 | $ 28.41 | $ 59,090 |
| Fresno, CA | 160 | 0.42 | 2.35 | $ 20.46 | $ 42,550 |
| Billings, MT | 30 | 0.39 | 2.18 | $ 18.12 | $ 37,690 |
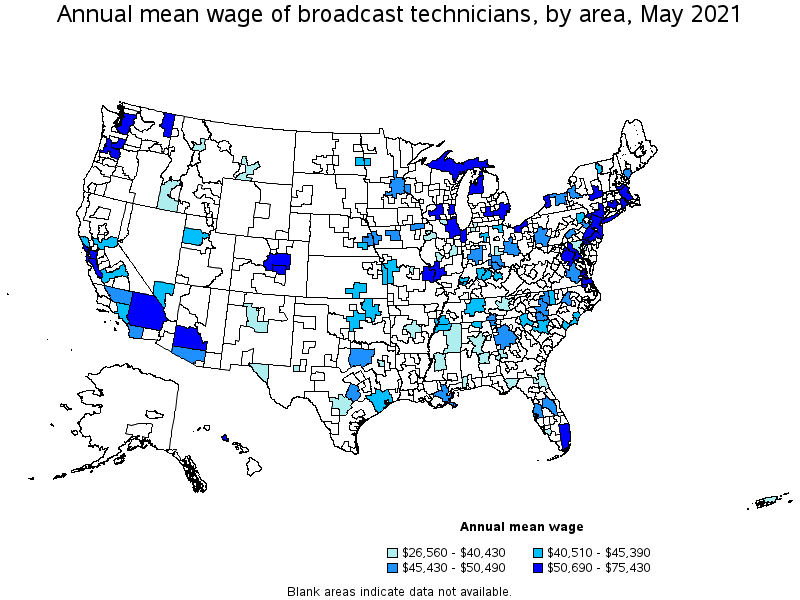
Top paying metropolitan areas for Broadcast Technicians:
| Metropolitan area | Employment (1) | Employment per thousand jobs | Location quotient (9) | Hourly mean wage | Annual mean wage (2) |
|---|---|---|---|---|---|
| New York-Newark-Jersey City, NY-NJ-PA | 3,060 | 0.35 | 1.97 | $ 36.27 | $ 75,430 |
| Buffalo-Cheektowaga-Niagara Falls, NY | 110 | 0.21 | 1.17 | $ 34.13 | $ 70,990 |
| Washington-Arlington-Alexandria, DC-VA-MD-WV | 720 | 0.25 | 1.37 | $ 33.63 | $ 69,950 |
| Denver-Aurora-Lakewood, CO | 640 | 0.44 | 2.45 | $ 33.52 | $ 69,710 |
| Boston-Cambridge-Nashua, MA-NH | 320 | 0.13 | 0.70 | $ 32.53 | $ 67,660 |
| Portland-Vancouver-Hillsboro, OR-WA | 110 | 0.09 | 0.52 | $ 31.54 | $ 65,610 |
| Seattle-Tacoma-Bellevue, WA | 230 | 0.12 | 0.67 | $ 30.76 | $ 63,970 |
| Detroit-Warren-Dearborn, MI | 360 | 0.20 | 1.12 | $ 29.74 | $ 61,860 |
| Lansing-East Lansing, MI | 80 | 0.43 | 2.39 | $ 28.41 | $ 59,090 |
| Miami-Fort Lauderdale-West Palm Beach, FL | 650 | 0.26 | 1.47 | $ 27.80 | $ 57,830 |
Nonmetropolitan areas with the highest employment in Broadcast Technicians:
| Nonmetropolitan area | Employment (1) | Employment per thousand jobs | Location quotient (9) | Hourly mean wage | Annual mean wage (2) |
|---|---|---|---|---|---|
| Northwest Lower Peninsula of Michigan nonmetropolitan area | 40 | 0.31 | 1.71 | $ 25.71 | $ 53,490 |
| Upper Peninsula of Michigan nonmetropolitan area | 30 | 0.33 | 1.84 | $ 24.37 | $ 50,690 |
| Northeast Mississippi nonmetropolitan area | 30 | 0.15 | 0.82 | $ 12.94 | $ 26,910 |
Nonmetropolitan areas with the highest concentration of jobs and location quotients in Broadcast Technicians:
| Nonmetropolitan area | Employment (1) | Employment per thousand jobs | Location quotient (9) | Hourly mean wage | Annual mean wage (2) |
|---|---|---|---|---|---|
| Upper Peninsula of Michigan nonmetropolitan area | 30 | 0.33 | 1.84 | $ 24.37 | $ 50,690 |
| Northwest Lower Peninsula of Michigan nonmetropolitan area | 40 | 0.31 | 1.71 | $ 25.71 | $ 53,490 |
| Northeast Mississippi nonmetropolitan area | 30 | 0.15 | 0.82 | $ 12.94 | $ 26,910 |
Top paying nonmetropolitan areas for Broadcast Technicians:
| Nonmetropolitan area | Employment (1) | Employment per thousand jobs | Location quotient (9) | Hourly mean wage | Annual mean wage (2) |
|---|---|---|---|---|---|
| Northwest Lower Peninsula of Michigan nonmetropolitan area | 40 | 0.31 | 1.71 | $ 25.71 | $ 53,490 |
| Upper Peninsula of Michigan nonmetropolitan area | 30 | 0.33 | 1.84 | $ 24.37 | $ 50,690 |
| Northeast Mississippi nonmetropolitan area | 30 | 0.15 | 0.82 | $ 12.94 | $ 26,910 |
These estimates are calculated with data collected from employers in all industry sectors, all metropolitan and nonmetropolitan areas, and all states and the District of Columbia. The top employment and wage figures are provided above. The complete list is available in the downloadable XLS files.
The percentile wage estimate is the value of a wage below which a certain percent of workers fall. The median wage is the 50th percentile wage estimate—50 percent of workers earn less than the median and 50 percent of workers earn more than the median. More about percentile wages.
(1) Estimates for detailed occupations do not sum to the totals because the totals include occupations not shown separately. Estimates do not include self-employed workers.
(2) Annual wages have been calculated by multiplying the hourly mean wage by a "year-round, full-time" hours figure of 2,080 hours; for those occupations where there is not an hourly wage published, the annual wage has been directly calculated from the reported survey data.
(3) The relative standard error (RSE) is a measure of the reliability of a survey statistic. The smaller the relative standard error, the more precise the estimate.
(7) The value is less than .005 percent of industry employment.
(8) Estimate not released.
(9) The location quotient is the ratio of the area concentration of occupational employment to the national average concentration. A location quotient greater than one indicates the occupation has a higher share of employment than average, and a location quotient less than one indicates the occupation is less prevalent in the area than average.
Other OEWS estimates and related information:
May 2021 National Occupational Employment and Wage Estimates
May 2021 State Occupational Employment and Wage Estimates
May 2021 Metropolitan and Nonmetropolitan Area Occupational Employment and Wage Estimates
May 2021 National Industry-Specific Occupational Employment and Wage Estimates
Last Modified Date: March 31, 2022