
An official website of the United States government
An official website of the United States government
The .gov means it's official.
Federal government websites often end in .gov or .mil. Before sharing sensitive information,
make sure you're on a federal government site.
The site is secure.
The
https:// ensures that you are connecting to the official website and that any
information you provide is encrypted and transmitted securely.
Photograph people, landscapes, merchandise, or other subjects. May use lighting equipment to enhance a subject�s appearance. May use editing software to produce finished images and prints. Includes commercial and industrial photographers, scientific photographers, and photojournalists. Excludes �Camera Operators, Television, Video, and Film� (27-4031).
Employment estimate and mean wage estimates for Photographers:
| Employment (1) | Employment RSE (3) |
Mean hourly wage |
Mean annual wage (2) |
Wage RSE (3) |
|---|---|---|---|---|
| 38,420 | 4.6 % | $ 23.18 | $ 48,210 | 1.6 % |
Percentile wage estimates for Photographers:
| Percentile | 10% | 25% | 50% (Median) |
75% | 90% |
|---|---|---|---|---|---|
| Hourly Wage | $ 11.80 | $ 14.47 | $ 18.73 | $ 28.84 | $ 37.38 |
| Annual Wage (2) | $ 24,540 | $ 30,090 | $ 38,950 | $ 60,000 | $ 77,760 |
Industries with the highest published employment and wages for Photographers are provided. For a list of all industries with employment in Photographers, see the Create Customized Tables function.
Industries with the highest levels of employment in Photographers:
| Industry | Employment (1) | Percent of industry employment | Hourly mean wage | Annual mean wage (2) |
|---|---|---|---|---|
| Other Professional, Scientific, and Technical Services | 19,430 | 2.55 | $ 20.97 | $ 43,630 |
| Radio and Television Broadcasting | 3,270 | 1.72 | $ 25.81 | $ 53,690 |
| Electronic Shopping and Mail-Order Houses | 1,380 | 0.30 | $ 24.92 | $ 51,840 |
| Newspaper, Periodical, Book, and Directory Publishers | 1,260 | 0.51 | $ 24.25 | $ 50,450 |
| Automobile Dealers | 850 | 0.07 | $ 16.25 | $ 33,810 |
Industries with the highest concentration of employment in Photographers:
| Industry | Employment (1) | Percent of industry employment | Hourly mean wage | Annual mean wage (2) |
|---|---|---|---|---|
| Other Professional, Scientific, and Technical Services | 19,430 | 2.55 | $ 20.97 | $ 43,630 |
| Radio and Television Broadcasting | 3,270 | 1.72 | $ 25.81 | $ 53,690 |
| Cable and Other Subscription Programming | 250 | 0.53 | $ 25.50 | $ 53,050 |
| Newspaper, Periodical, Book, and Directory Publishers | 1,260 | 0.51 | $ 24.25 | $ 50,450 |
| Nonscheduled Air Transportation | 160 | 0.32 | $ 32.53 | $ 67,670 |
Top paying industries for Photographers:
| Industry | Employment (1) | Percent of industry employment | Hourly mean wage | Annual mean wage (2) |
|---|---|---|---|---|
| Grantmaking and Giving Services | (8) | (8) | $ 47.84 | $ 99,510 |
| Aerospace Product and Parts Manufacturing | 40 | 0.01 | $ 43.57 | $ 90,620 |
| Other Information Services | 520 | 0.14 | $ 41.03 | $ 85,330 |
| Scientific Research and Development Services | 50 | 0.01 | $ 37.88 | $ 78,790 |
| General Medical and Surgical Hospitals | 130 | (7) | $ 34.03 | $ 70,790 |
States and areas with the highest published employment, location quotients, and wages for Photographers are provided. For a list of all areas with employment in Photographers, see the Create Customized Tables function.
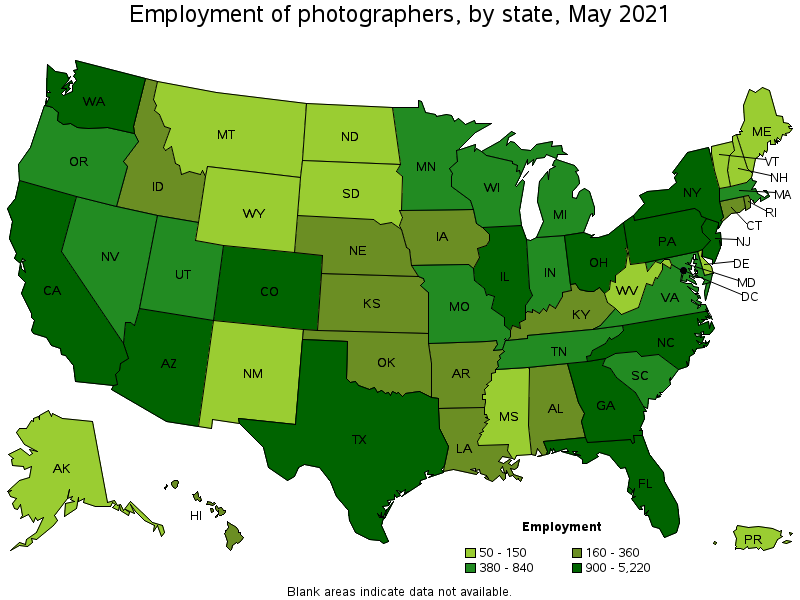
States with the highest employment level in Photographers:
| State | Employment (1) | Employment per thousand jobs | Location quotient (9) | Hourly mean wage | Annual mean wage (2) |
|---|---|---|---|---|---|
| California | 5,220 | 0.32 | 1.16 | $ 25.92 | $ 53,920 |
| New York | 3,390 | 0.39 | 1.43 | $ 29.26 | $ 60,860 |
| Florida | 3,070 | 0.36 | 1.31 | $ 20.59 | $ 42,840 |
| Texas | 3,060 | 0.25 | 0.92 | $ 19.30 | $ 40,140 |
| Illinois | 1,730 | 0.31 | 1.13 | $ 24.48 | $ 50,920 |
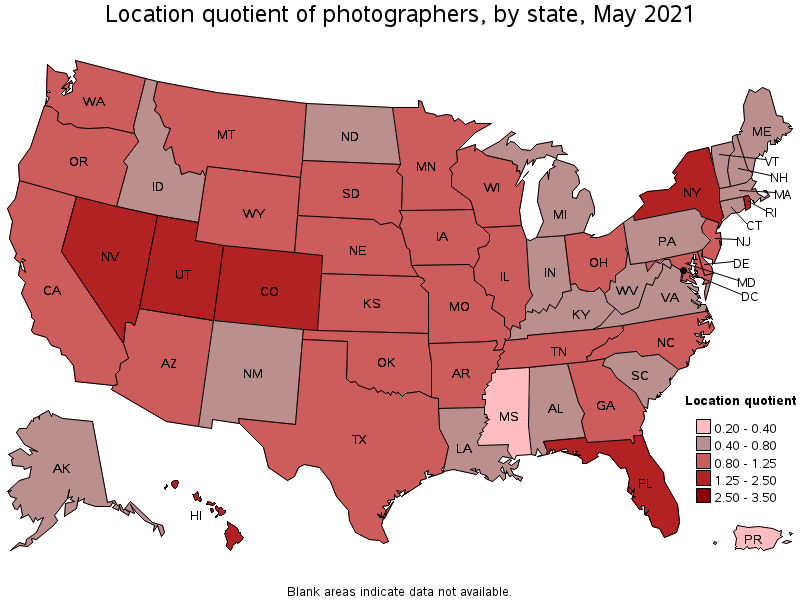
States with the highest concentration of jobs and location quotients in Photographers:
| State | Employment (1) | Employment per thousand jobs | Location quotient (9) | Hourly mean wage | Annual mean wage (2) |
|---|---|---|---|---|---|
| Hawaii | 230 | 0.42 | 1.54 | $ 21.49 | $ 44,700 |
| District of Columbia | 270 | 0.40 | 1.47 | $ 40.67 | $ 84,590 |
| New York | 3,390 | 0.39 | 1.43 | $ 29.26 | $ 60,860 |
| Colorado | 990 | 0.38 | 1.39 | $ 24.10 | $ 50,120 |
| Rhode Island | 170 | 0.37 | 1.34 | $ 22.90 | $ 47,630 |
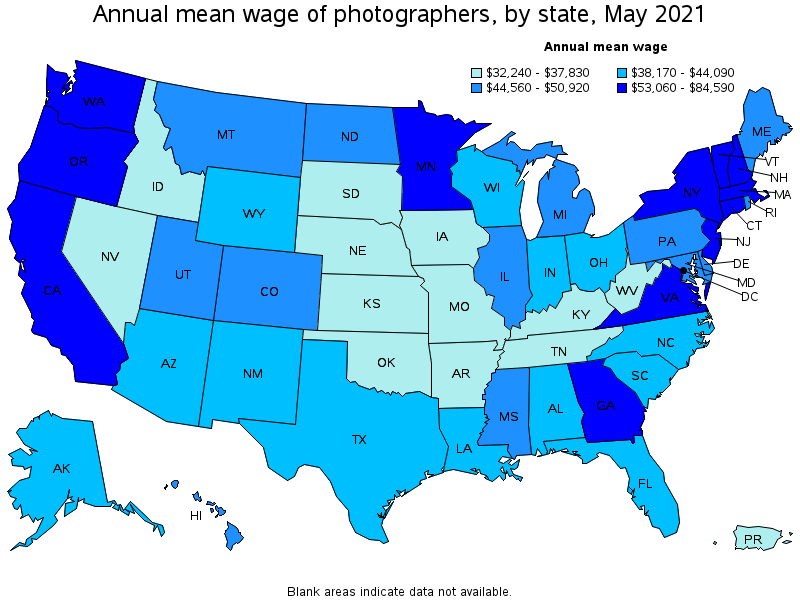
Top paying states for Photographers:
| State | Employment (1) | Employment per thousand jobs | Location quotient (9) | Hourly mean wage | Annual mean wage (2) |
|---|---|---|---|---|---|
| District of Columbia | 270 | 0.40 | 1.47 | $ 40.67 | $ 84,590 |
| Connecticut | 300 | 0.19 | 0.69 | $ 32.01 | $ 66,580 |
| New York | 3,390 | 0.39 | 1.43 | $ 29.26 | $ 60,860 |
| Georgia | 1,390 | 0.32 | 1.16 | $ 28.57 | $ 59,420 |
| Washington | 900 | 0.28 | 1.03 | $ 28.45 | $ 59,180 |
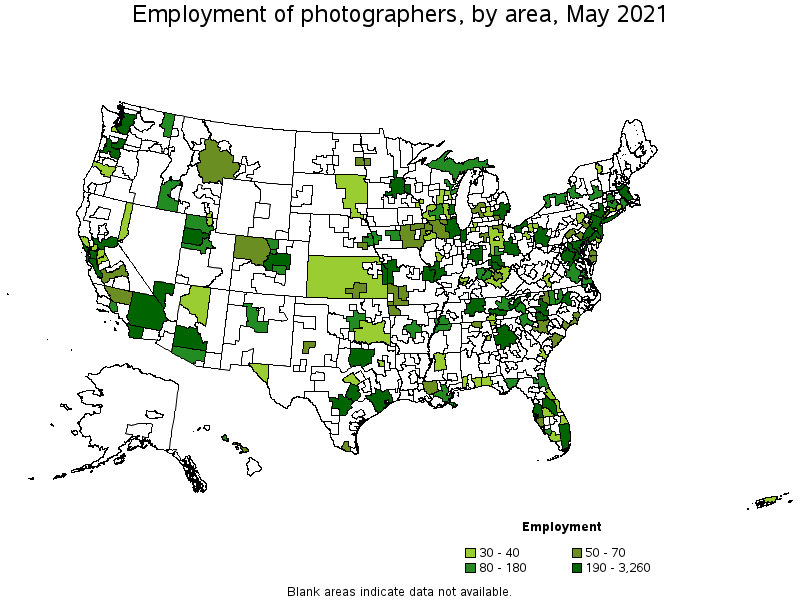
Metropolitan areas with the highest employment level in Photographers:
| Metropolitan area | Employment (1) | Employment per thousand jobs | Location quotient (9) | Hourly mean wage | Annual mean wage (2) |
|---|---|---|---|---|---|
| New York-Newark-Jersey City, NY-NJ-PA | 3,260 | 0.38 | 1.38 | $ 30.16 | $ 62,730 |
| Chicago-Naperville-Elgin, IL-IN-WI | 1,390 | 0.33 | 1.20 | $ 25.64 | $ 53,340 |
| Atlanta-Sandy Springs-Roswell, GA | 1,100 | 0.43 | 1.56 | $ 30.57 | $ 63,580 |
| Miami-Fort Lauderdale-West Palm Beach, FL | 1,000 | 0.41 | 1.49 | $ 25.52 | $ 53,090 |
| Dallas-Fort Worth-Arlington, TX | 970 | 0.27 | 0.99 | $ 21.37 | $ 44,440 |
| Houston-The Woodlands-Sugar Land, TX | 780 | 0.27 | 0.98 | $ 19.18 | $ 39,890 |
| San Francisco-Oakland-Hayward, CA | 770 | 0.34 | 1.26 | $ 31.80 | $ 66,140 |
| Phoenix-Mesa-Scottsdale, AZ | 690 | 0.32 | 1.19 | $ 21.44 | $ 44,590 |
| Washington-Arlington-Alexandria, DC-VA-MD-WV | 650 | 0.22 | 0.81 | $ 33.86 | $ 70,440 |
| Orlando-Kissimmee-Sanford, FL | 640 | 0.55 | 2.00 | $ 17.80 | $ 37,020 |
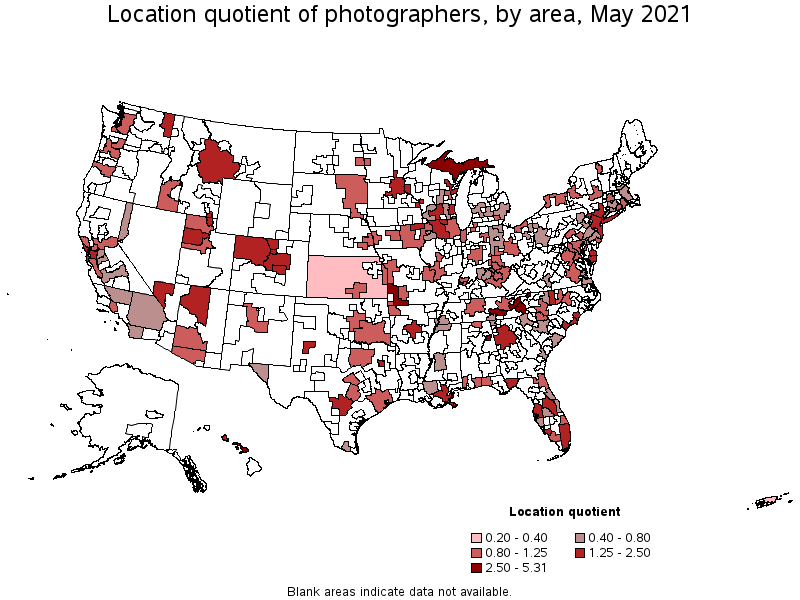
Metropolitan areas with the highest concentration of jobs and location quotients in Photographers:
| Metropolitan area | Employment (1) | Employment per thousand jobs | Location quotient (9) | Hourly mean wage | Annual mean wage (2) |
|---|---|---|---|---|---|
| Kahului-Wailuku-Lahaina, HI | 50 | 0.83 | 3.05 | $ 22.07 | $ 45,900 |
| Asheville, NC | 130 | 0.71 | 2.61 | $ 15.31 | $ 31,840 |
| Anniston-Oxford-Jacksonville, AL | 30 | 0.70 | 2.55 | $ 16.79 | $ 34,920 |
| Flagstaff, AZ | 40 | 0.61 | 2.23 | $ 16.24 | $ 33,780 |
| Orlando-Kissimmee-Sanford, FL | 640 | 0.55 | 2.00 | $ 17.80 | $ 37,020 |
| Fort Collins, CO | 90 | 0.53 | 1.96 | $ 27.76 | $ 57,740 |
| Tallahassee, FL | 90 | 0.52 | 1.90 | $ 14.84 | $ 30,870 |
| Wilmington, NC | 70 | 0.51 | 1.88 | $ 18.91 | $ 39,340 |
| Logan, UT-ID | 30 | 0.49 | 1.80 | $ 24.18 | $ 50,290 |
| La Crosse-Onalaska, WI-MN | 40 | 0.49 | 1.79 | $ 18.32 | $ 38,110 |
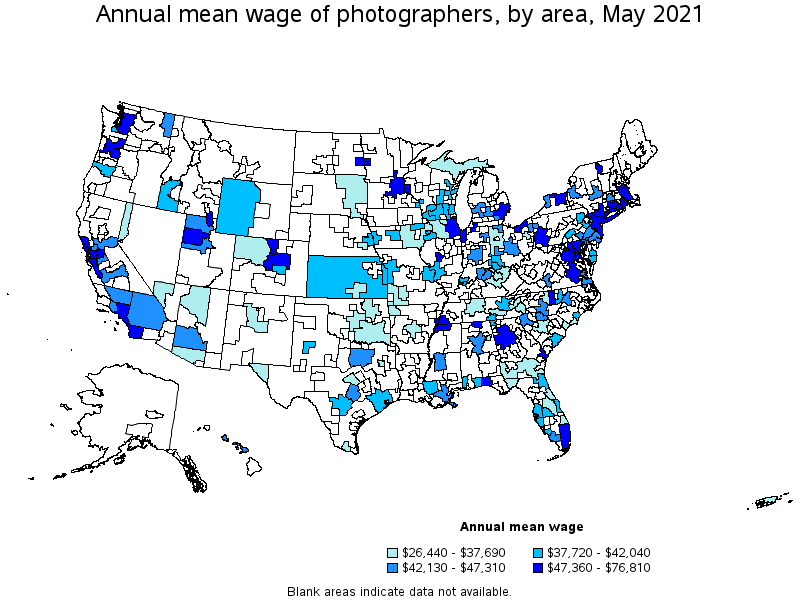
Top paying metropolitan areas for Photographers:
| Metropolitan area | Employment (1) | Employment per thousand jobs | Location quotient (9) | Hourly mean wage | Annual mean wage (2) |
|---|---|---|---|---|---|
| San Jose-Sunnyvale-Santa Clara, CA | 290 | 0.27 | 0.99 | $ 36.93 | $ 76,810 |
| Bridgeport-Stamford-Norwalk, CT | 70 | 0.18 | 0.67 | $ 34.21 | $ 71,160 |
| Washington-Arlington-Alexandria, DC-VA-MD-WV | 650 | 0.22 | 0.81 | $ 33.86 | $ 70,440 |
| San Francisco-Oakland-Hayward, CA | 770 | 0.34 | 1.26 | $ 31.80 | $ 66,140 |
| Hartford-West Hartford-East Hartford, CT | 80 | 0.15 | 0.53 | $ 31.77 | $ 66,090 |
| Seattle-Tacoma-Bellevue, WA | 630 | 0.33 | 1.20 | $ 31.64 | $ 65,810 |
| Norwich-New London-Westerly, CT-RI | 30 | 0.26 | 0.97 | $ 30.97 | $ 64,420 |
| Atlanta-Sandy Springs-Roswell, GA | 1,100 | 0.43 | 1.56 | $ 30.57 | $ 63,580 |
| New York-Newark-Jersey City, NY-NJ-PA | 3,260 | 0.38 | 1.38 | $ 30.16 | $ 62,730 |
| Santa Rosa, CA | 40 | 0.22 | 0.80 | $ 29.98 | $ 62,350 |
Nonmetropolitan areas with the highest employment in Photographers:
| Nonmetropolitan area | Employment (1) | Employment per thousand jobs | Location quotient (9) | Hourly mean wage | Annual mean wage (2) |
|---|---|---|---|---|---|
| East Tennessee nonmetropolitan area | 190 | 1.45 | 5.31 | $ 14.84 | $ 30,870 |
| Upper Peninsula of Michigan nonmetropolitan area | 100 | 0.99 | 3.62 | $ 17.53 | $ 36,460 |
| Northwest Colorado nonmetropolitan area | 70 | 0.63 | 2.33 | $ 16.94 | $ 35,220 |
| Northwest Illinois nonmetropolitan area | 60 | 0.45 | 1.66 | $ 17.35 | $ 36,080 |
| Southeast Iowa nonmetropolitan area | 60 | 0.27 | 0.99 | $ 16.35 | $ 34,000 |
Nonmetropolitan areas with the highest concentration of jobs and location quotients in Photographers:
| Nonmetropolitan area | Employment (1) | Employment per thousand jobs | Location quotient (9) | Hourly mean wage | Annual mean wage (2) |
|---|---|---|---|---|---|
| East Tennessee nonmetropolitan area | 190 | 1.45 | 5.31 | $ 14.84 | $ 30,870 |
| Upper Peninsula of Michigan nonmetropolitan area | 100 | 0.99 | 3.62 | $ 17.53 | $ 36,460 |
| Southwest Missouri nonmetropolitan area | 50 | 0.72 | 2.65 | $ 12.71 | $ 26,440 |
| Northwest Colorado nonmetropolitan area | 70 | 0.63 | 2.33 | $ 16.94 | $ 35,220 |
| Northwest Illinois nonmetropolitan area | 60 | 0.45 | 1.66 | $ 17.35 | $ 36,080 |
Top paying nonmetropolitan areas for Photographers:
| Nonmetropolitan area | Employment (1) | Employment per thousand jobs | Location quotient (9) | Hourly mean wage | Annual mean wage (2) |
|---|---|---|---|---|---|
| Western Wyoming nonmetropolitan area | (8) | (8) | (8) | $ 20.21 | $ 42,040 |
| South Central Wisconsin nonmetropolitan area | 30 | 0.16 | 0.60 | $ 18.75 | $ 38,990 |
| Kansas nonmetropolitan area | 30 | 0.09 | 0.33 | $ 18.20 | $ 37,850 |
| Central Kentucky nonmetropolitan area | 40 | 0.25 | 0.91 | $ 17.90 | $ 37,240 |
| Upper Peninsula of Michigan nonmetropolitan area | 100 | 0.99 | 3.62 | $ 17.53 | $ 36,460 |
These estimates are calculated with data collected from employers in all industry sectors, all metropolitan and nonmetropolitan areas, and all states and the District of Columbia. The top employment and wage figures are provided above. The complete list is available in the downloadable XLS files.
The percentile wage estimate is the value of a wage below which a certain percent of workers fall. The median wage is the 50th percentile wage estimate—50 percent of workers earn less than the median and 50 percent of workers earn more than the median. More about percentile wages.
(1) Estimates for detailed occupations do not sum to the totals because the totals include occupations not shown separately. Estimates do not include self-employed workers.
(2) Annual wages have been calculated by multiplying the hourly mean wage by a "year-round, full-time" hours figure of 2,080 hours; for those occupations where there is not an hourly wage published, the annual wage has been directly calculated from the reported survey data.
(3) The relative standard error (RSE) is a measure of the reliability of a survey statistic. The smaller the relative standard error, the more precise the estimate.
(7) The value is less than .005 percent of industry employment.
(8) Estimate not released.
(9) The location quotient is the ratio of the area concentration of occupational employment to the national average concentration. A location quotient greater than one indicates the occupation has a higher share of employment than average, and a location quotient less than one indicates the occupation is less prevalent in the area than average.
Other OEWS estimates and related information:
May 2021 National Occupational Employment and Wage Estimates
May 2021 State Occupational Employment and Wage Estimates
May 2021 Metropolitan and Nonmetropolitan Area Occupational Employment and Wage Estimates
May 2021 National Industry-Specific Occupational Employment and Wage Estimates
Last Modified Date: March 31, 2022