
An official website of the United States government
An official website of the United States government
The .gov means it's official.
Federal government websites often end in .gov or .mil. Before sharing sensitive information,
make sure you're on a federal government site.
The site is secure.
The
https:// ensures that you are connecting to the official website and that any
information you provide is encrypted and transmitted securely.
Examine, diagnose, and treat diseases, injuries, and malformations of teeth and gums. May treat diseases of nerve, pulp, and other dental tissues affecting oral hygiene and retention of teeth. May fit dental appliances or provide preventive care. Excludes �Oral and Maxillofacial Surgeons� (29-1022), �Orthodontists� (29-1023), �Prosthodontists� (29-1024), and �Dentists, All Other Specialists� (29-1029).
Employment estimate and mean wage estimates for Dentists, General:
| Employment (1) | Employment RSE (3) |
Mean hourly wage |
Mean annual wage (2) |
Wage RSE (3) |
|---|---|---|---|---|
| 108,680 | 3.3 % | $ 80.37 | $ 167,160 | 1.8 % |
Percentile wage estimates for Dentists, General:
| Percentile | 10% | 25% | 50% (Median) |
75% | 90% |
|---|---|---|---|---|---|
| Hourly Wage | $ 30.20 | $ 48.83 | $ 77.10 | (5) | (5) |
| Annual Wage (2) | $ 62,810 | $ 101,570 | $ 160,370 | (5) | (5) |
Industries with the highest published employment and wages for Dentists, General are provided. For a list of all industries with employment in Dentists, General, see the Create Customized Tables function.
Industries with the highest levels of employment in Dentists, General:
| Industry | Employment (1) | Percent of industry employment | Hourly mean wage | Annual mean wage (2) |
|---|---|---|---|---|
| Offices of Dentists | 96,750 | 9.96 | $ 81.21 | $ 168,910 |
| Outpatient Care Centers | 3,250 | 0.33 | $ 77.66 | $ 161,530 |
| Offices of Physicians | 2,890 | 0.11 | $ 76.37 | $ 158,850 |
| General Medical and Surgical Hospitals | 1,860 | 0.03 | $ 59.79 | $ 124,350 |
| State Government, excluding schools and hospitals (OEWS Designation) | 890 | 0.04 | $ 88.35 | $ 183,770 |
Industries with the highest concentration of employment in Dentists, General:
| Industry | Employment (1) | Percent of industry employment | Hourly mean wage | Annual mean wage (2) |
|---|---|---|---|---|
| Offices of Dentists | 96,750 | 9.96 | $ 81.21 | $ 168,910 |
| Outpatient Care Centers | 3,250 | 0.33 | $ 77.66 | $ 161,530 |
| Offices of Physicians | 2,890 | 0.11 | $ 76.37 | $ 158,850 |
| Offices of Other Health Practitioners | 350 | 0.04 | $ 85.91 | $ 178,700 |
| Psychiatric and Substance Abuse Hospitals | 90 | 0.04 | $ 67.38 | $ 140,150 |
Top paying industries for Dentists, General:
| Industry | Employment (1) | Percent of industry employment | Hourly mean wage | Annual mean wage (2) |
|---|---|---|---|---|
| Other Ambulatory Health Care Services | 80 | 0.03 | $ 90.85 | $ 188,960 |
| State Government, excluding schools and hospitals (OEWS Designation) | 890 | 0.04 | $ 88.35 | $ 183,770 |
| Offices of Other Health Practitioners | 350 | 0.04 | $ 85.91 | $ 178,700 |
| Home Health Care Services | (8) | (8) | $ 82.37 | $ 171,330 |
| Offices of Dentists | 96,750 | 9.96 | $ 81.21 | $ 168,910 |
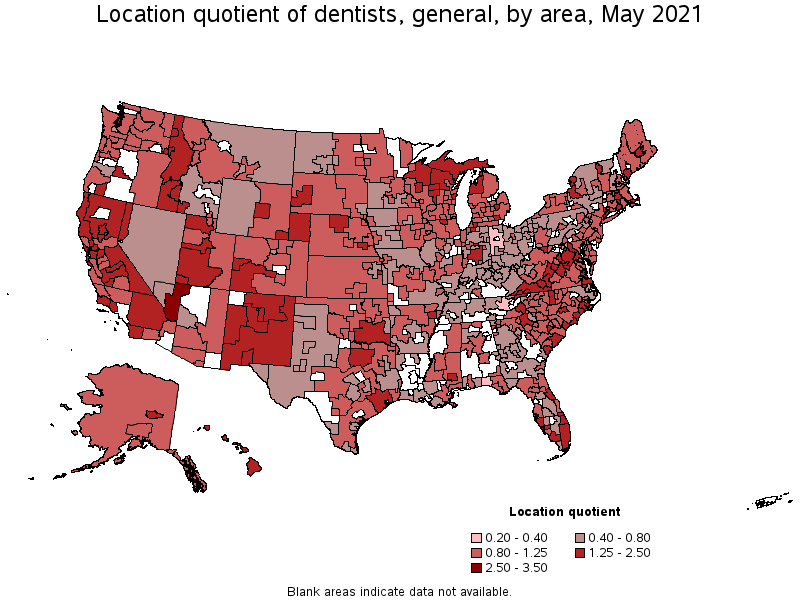
States and areas with the highest published employment, location quotients, and wages for Dentists, General are provided. For a list of all areas with employment in Dentists, General, see the Create Customized Tables function.
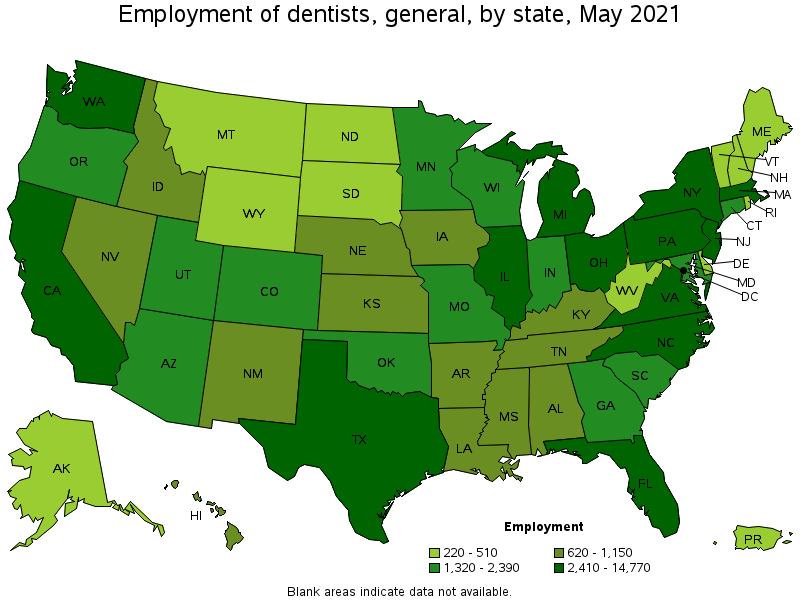
States with the highest employment level in Dentists, General:
| State | Employment (1) | Employment per thousand jobs | Location quotient (9) | Hourly mean wage | Annual mean wage (2) |
|---|---|---|---|---|---|
| California | 14,770 | 0.89 | 1.16 | $ 79.78 | $ 165,950 |
| Texas | 9,540 | 0.78 | 1.01 | $ 72.15 | $ 150,060 |
| Florida | 8,080 | 0.94 | 1.22 | $ 79.02 | $ 164,370 |
| New York | 6,370 | 0.73 | 0.95 | $ 82.11 | $ 170,800 |
| Virginia | 4,880 | 1.30 | 1.68 | $ 78.25 | $ 162,750 |
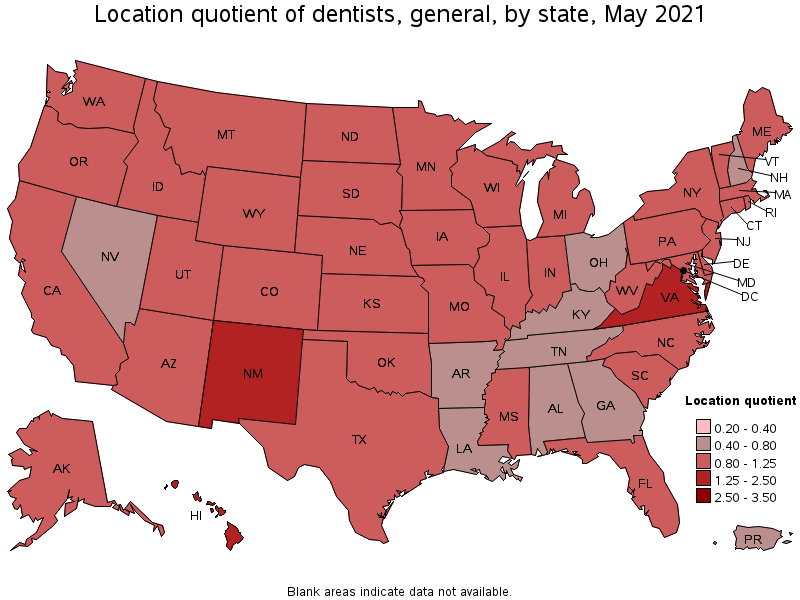
States with the highest concentration of jobs and location quotients in Dentists, General:
| State | Employment (1) | Employment per thousand jobs | Location quotient (9) | Hourly mean wage | Annual mean wage (2) |
|---|---|---|---|---|---|
| Virginia | 4,880 | 1.30 | 1.68 | $ 78.25 | $ 162,750 |
| Hawaii | 620 | 1.13 | 1.46 | $ 85.49 | $ 177,820 |
| New Mexico | 860 | 1.11 | 1.44 | $ 91.07 | $ 189,430 |
| Idaho | 720 | 0.95 | 1.23 | $ 59.98 | $ 124,750 |
| Florida | 8,080 | 0.94 | 1.22 | $ 79.02 | $ 164,370 |
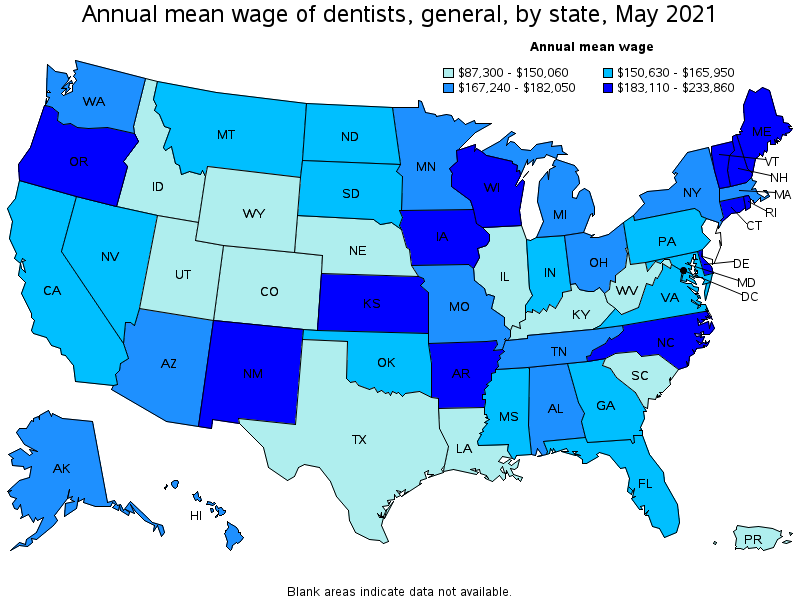
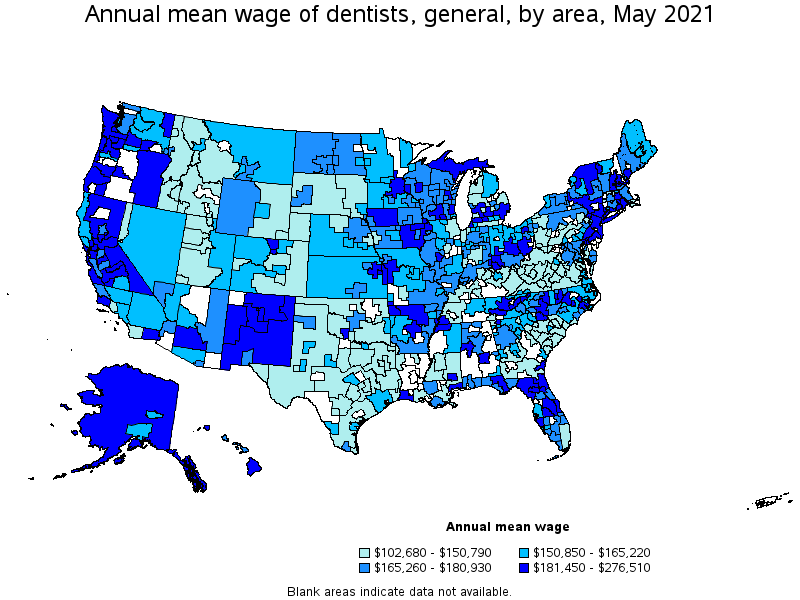
Top paying states for Dentists, General:
| State | Employment (1) | Employment per thousand jobs | Location quotient (9) | Hourly mean wage | Annual mean wage (2) |
|---|---|---|---|---|---|
| Delaware | 270 | 0.62 | 0.80 | $ 112.43 | $ 233,860 |
| New Hampshire | 350 | 0.55 | 0.71 | $ 108.24 | $ 225,140 |
| Oregon | 1,430 | 0.79 | 1.02 | $ 99.70 | $ 207,370 |
| Rhode Island | 350 | 0.76 | 0.98 | $ 99.33 | $ 206,600 |
| Connecticut | 1,370 | 0.87 | 1.13 | $ 95.15 | $ 197,910 |
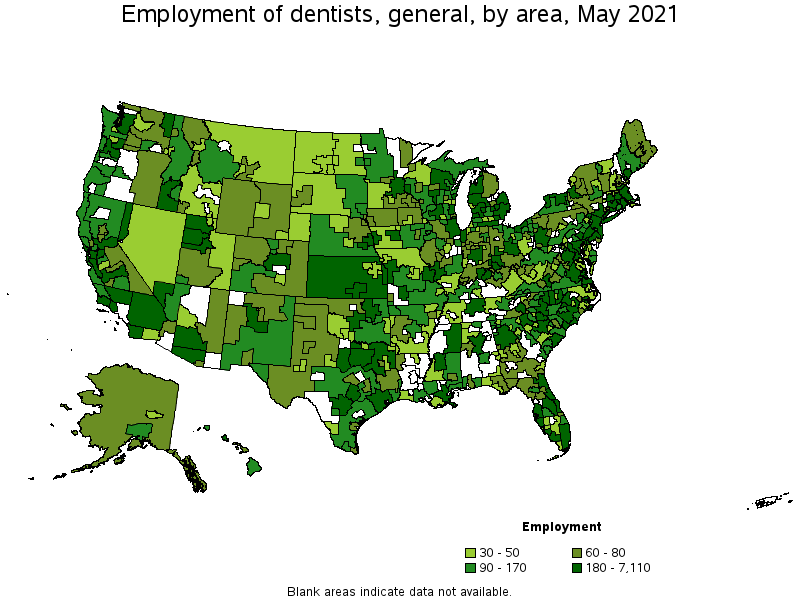
Metropolitan areas with the highest employment level in Dentists, General:
| Metropolitan area | Employment (1) | Employment per thousand jobs | Location quotient (9) | Hourly mean wage | Annual mean wage (2) |
|---|---|---|---|---|---|
| New York-Newark-Jersey City, NY-NJ-PA | 7,110 | 0.82 | 1.06 | $ 87.59 | $ 182,190 |
| Dallas-Fort Worth-Arlington, TX | 3,520 | 0.98 | 1.27 | $ 70.53 | $ 146,710 |
| Washington-Arlington-Alexandria, DC-VA-MD-WV | 3,260 | 1.11 | 1.44 | $ 83.65 | $ 174,000 |
| Chicago-Naperville-Elgin, IL-IN-WI | 3,140 | 0.74 | 0.96 | $ 64.79 | $ 134,770 |
| Miami-Fort Lauderdale-West Palm Beach, FL | 3,120 | 1.27 | 1.65 | $ 70.89 | $ 147,440 |
| Houston-The Woodlands-Sugar Land, TX | 3,040 | 1.05 | 1.36 | $ 76.91 | $ 159,970 |
| San Francisco-Oakland-Hayward, CA | 2,250 | 1.00 | 1.30 | $ 87.36 | $ 181,700 |
| Philadelphia-Camden-Wilmington, PA-NJ-DE-MD | 2,240 | 0.84 | 1.10 | $ 90.97 | $ 189,220 |
| Boston-Cambridge-Nashua, MA-NH | 2,220 | 0.86 | 1.11 | $ 85.75 | $ 178,360 |
| San Diego-Carlsbad, CA | 1,660 | 1.19 | 1.54 | $ 66.83 | $ 139,000 |
Metropolitan areas with the highest concentration of jobs and location quotients in Dentists, General:
| Metropolitan area | Employment (1) | Employment per thousand jobs | Location quotient (9) | Hourly mean wage | Annual mean wage (2) |
|---|---|---|---|---|---|
| Lake Havasu City-Kingman, AZ | 110 | 2.17 | 2.81 | $ 73.16 | $ 152,170 |
| Flint, MI | 240 | 1.89 | 2.45 | $ 83.85 | $ 174,410 |
| Oxnard-Thousand Oaks-Ventura, CA | 540 | 1.81 | 2.35 | $ 60.28 | $ 125,380 |
| St. George, UT | 120 | 1.56 | 2.03 | $ 64.26 | $ 133,650 |
| Virginia Beach-Norfolk-Newport News, VA-NC | 1,110 | 1.56 | 2.02 | $ 78.01 | $ 162,260 |
| Hanford-Corcoran, CA | 60 | 1.49 | 1.93 | $ 93.80 | $ 195,110 |
| Naples-Immokalee-Marco Island, FL | 200 | 1.38 | 1.79 | $ 80.64 | $ 167,720 |
| Morgantown, WV | 90 | 1.37 | 1.77 | $ 58.15 | $ 120,950 |
| Santa Fe, NM | 80 | 1.34 | 1.73 | $ 93.75 | $ 194,990 |
| Wilmington, NC | 170 | 1.33 | 1.72 | $ 86.55 | $ 180,030 |
Top paying metropolitan areas for Dentists, General:
| Metropolitan area | Employment (1) | Employment per thousand jobs | Location quotient (9) | Hourly mean wage | Annual mean wage (2) |
|---|---|---|---|---|---|
| Manchester, NH | 60 | 0.58 | 0.75 | $ 132.94 | $ 276,510 |
| Salinas, CA | 120 | 0.71 | 0.92 | $ 112.70 | $ 234,410 |
| Vallejo-Fairfield, CA | 130 | 1.04 | 1.35 | $ 110.48 | $ 229,800 |
| Eugene, OR | 90 | 0.61 | 0.79 | $ 109.98 | $ 228,750 |
| New Haven, CT | 220 | 0.80 | 1.04 | $ 109.32 | $ 227,390 |
| Akron, OH | 150 | 0.48 | 0.63 | $ 108.34 | $ 225,350 |
| Gainesville, FL | 100 | 0.74 | 0.96 | $ 107.06 | $ 222,690 |
| Santa Cruz-Watsonville, CA | 100 | 1.09 | 1.42 | $ 106.35 | $ 221,210 |
| Medford, OR | 90 | 1.03 | 1.33 | $ 105.98 | $ 220,430 |
| Portsmouth, NH-ME | 70 | 0.76 | 0.99 | $ 105.80 | $ 220,070 |
Nonmetropolitan areas with the highest employment in Dentists, General:
| Nonmetropolitan area | Employment (1) | Employment per thousand jobs | Location quotient (9) | Hourly mean wage | Annual mean wage (2) |
|---|---|---|---|---|---|
| Kansas nonmetropolitan area | 230 | 0.62 | 0.80 | $ 77.03 | $ 160,210 |
| Northeastern Wisconsin nonmetropolitan area | 220 | 1.18 | 1.52 | $ 85.79 | $ 178,450 |
| North Texas Region of Texas nonmetropolitan area | 210 | 0.77 | 1.00 | $ 60.23 | $ 125,280 |
| Balance of Lower Peninsula of Michigan nonmetropolitan area | 200 | 0.79 | 1.02 | $ 72.18 | $ 150,140 |
| Northeast Mississippi nonmetropolitan area | 190 | 0.84 | 1.09 | $ 78.81 | $ 163,920 |
Nonmetropolitan areas with the highest concentration of jobs and location quotients in Dentists, General:
| Nonmetropolitan area | Employment (1) | Employment per thousand jobs | Location quotient (9) | Hourly mean wage | Annual mean wage (2) |
|---|---|---|---|---|---|
| Hawaii / Kauai nonmetropolitan area | 150 | 1.67 | 2.17 | $ 97.04 | $ 201,830 |
| Northwest Lower Peninsula of Michigan nonmetropolitan area | 180 | 1.61 | 2.09 | $ 67.31 | $ 140,010 |
| Northwestern Idaho nonmetropolitan area | 90 | 1.34 | 1.74 | $ 50.29 | $ 104,590 |
| Upper Peninsula of Michigan nonmetropolitan area | 140 | 1.33 | 1.72 | $ 87.35 | $ 181,690 |
| Northwest Nebraska nonmetropolitan area | 50 | 1.26 | 1.64 | $ 64.60 | $ 134,370 |
Top paying nonmetropolitan areas for Dentists, General:
| Nonmetropolitan area | Employment (1) | Employment per thousand jobs | Location quotient (9) | Hourly mean wage | Annual mean wage (2) |
|---|---|---|---|---|---|
| Coast Oregon nonmetropolitan area | 90 | 0.78 | 1.01 | $ 116.18 | $ 241,650 |
| Northwest Iowa nonmetropolitan area | 60 | 0.48 | 0.62 | $ 109.50 | $ 227,760 |
| West Central-Southwest New Hampshire nonmetropolitan area | 30 | 0.34 | 0.44 | $ 106.45 | $ 221,420 |
| Southeast Iowa nonmetropolitan area | 160 | 0.78 | 1.01 | $ 104.92 | $ 218,230 |
| Eastern Ohio nonmetropolitan area | 50 | 0.37 | 0.48 | $ 98.99 | $ 205,910 |
These estimates are calculated with data collected from employers in all industry sectors, all metropolitan and nonmetropolitan areas, and all states and the District of Columbia. The top employment and wage figures are provided above. The complete list is available in the downloadable XLS files.
The percentile wage estimate is the value of a wage below which a certain percent of workers fall. The median wage is the 50th percentile wage estimate—50 percent of workers earn less than the median and 50 percent of workers earn more than the median. More about percentile wages.
(1) Estimates for detailed occupations do not sum to the totals because the totals include occupations not shown separately. Estimates do not include self-employed workers.
(2) Annual wages have been calculated by multiplying the hourly mean wage by a "year-round, full-time" hours figure of 2,080 hours; for those occupations where there is not an hourly wage published, the annual wage has been directly calculated from the reported survey data.
(3) The relative standard error (RSE) is a measure of the reliability of a survey statistic. The smaller the relative standard error, the more precise the estimate.
(5) This wage is equal to or greater than $100.00 per hour or $208,000 per year.
(8) Estimate not released.
(9) The location quotient is the ratio of the area concentration of occupational employment to the national average concentration. A location quotient greater than one indicates the occupation has a higher share of employment than average, and a location quotient less than one indicates the occupation is less prevalent in the area than average.
Other OEWS estimates and related information:
May 2021 National Occupational Employment and Wage Estimates
May 2021 State Occupational Employment and Wage Estimates
May 2021 Metropolitan and Nonmetropolitan Area Occupational Employment and Wage Estimates
May 2021 National Industry-Specific Occupational Employment and Wage Estimates
Last Modified Date: March 31, 2022