
An official website of the United States government
An official website of the United States government
The .gov means it's official.
Federal government websites often end in .gov or .mil. Before sharing sensitive information,
make sure you're on a federal government site.
The site is secure.
The
https:// ensures that you are connecting to the official website and that any
information you provide is encrypted and transmitted securely.
Assess, plan, organize, and participate in rehabilitative programs that improve mobility, relieve pain, increase strength, and improve or correct disabling conditions resulting from disease or injury.
Employment estimate and mean wage estimates for Physical Therapists:
| Employment (1) | Employment RSE (3) |
Mean hourly wage |
Mean annual wage (2) |
Wage RSE (3) |
|---|---|---|---|---|
| 225,350 | 1.0 % | $ 44.67 | $ 92,920 | 0.4 % |
Percentile wage estimates for Physical Therapists:
| Percentile | 10% | 25% | 50% (Median) |
75% | 90% |
|---|---|---|---|---|---|
| Hourly Wage | $ 29.77 | $ 37.38 | $ 45.97 | $ 49.00 | $ 61.11 |
| Annual Wage (2) | $ 61,930 | $ 77,750 | $ 95,620 | $ 101,920 | $ 127,110 |
Industries with the highest published employment and wages for Physical Therapists are provided. For a list of all industries with employment in Physical Therapists, see the Create Customized Tables function.
Industries with the highest levels of employment in Physical Therapists:
| Industry | Employment (1) | Percent of industry employment | Hourly mean wage | Annual mean wage (2) |
|---|---|---|---|---|
| Offices of Other Health Practitioners | 82,260 | 8.46 | $ 41.57 | $ 86,460 |
| General Medical and Surgical Hospitals | 55,620 | 0.99 | $ 46.23 | $ 96,160 |
| Home Health Care Services | 26,900 | 1.78 | $ 50.72 | $ 105,510 |
| Offices of Physicians | 13,780 | 0.51 | $ 40.93 | $ 85,120 |
| Specialty (except Psychiatric and Substance Abuse) Hospitals | 10,940 | 4.05 | $ 46.69 | $ 97,120 |
Industries with the highest concentration of employment in Physical Therapists:
| Industry | Employment (1) | Percent of industry employment | Hourly mean wage | Annual mean wage (2) |
|---|---|---|---|---|
| Offices of Other Health Practitioners | 82,260 | 8.46 | $ 41.57 | $ 86,460 |
| Specialty (except Psychiatric and Substance Abuse) Hospitals | 10,940 | 4.05 | $ 46.69 | $ 97,120 |
| Home Health Care Services | 26,900 | 1.78 | $ 50.72 | $ 105,510 |
| General Medical and Surgical Hospitals | 55,620 | 0.99 | $ 46.23 | $ 96,160 |
| Nursing Care Facilities (Skilled Nursing Facilities) | 10,120 | 0.72 | $ 48.44 | $ 100,760 |
Top paying industries for Physical Therapists:
| Industry | Employment (1) | Percent of industry employment | Hourly mean wage | Annual mean wage (2) |
|---|---|---|---|---|
| Outpatient Care Centers | 5,260 | 0.53 | $ 53.56 | $ 111,410 |
| Home Health Care Services | 26,900 | 1.78 | $ 50.72 | $ 105,510 |
| Child Day Care Services | 230 | 0.03 | $ 49.06 | $ 102,050 |
| Local Government, excluding schools and hospitals (OEWS Designation) | 1,100 | 0.02 | $ 48.70 | $ 101,290 |
| Nursing Care Facilities (Skilled Nursing Facilities) | 10,120 | 0.72 | $ 48.44 | $ 100,760 |
States and areas with the highest published employment, location quotients, and wages for Physical Therapists are provided. For a list of all areas with employment in Physical Therapists, see the Create Customized Tables function.
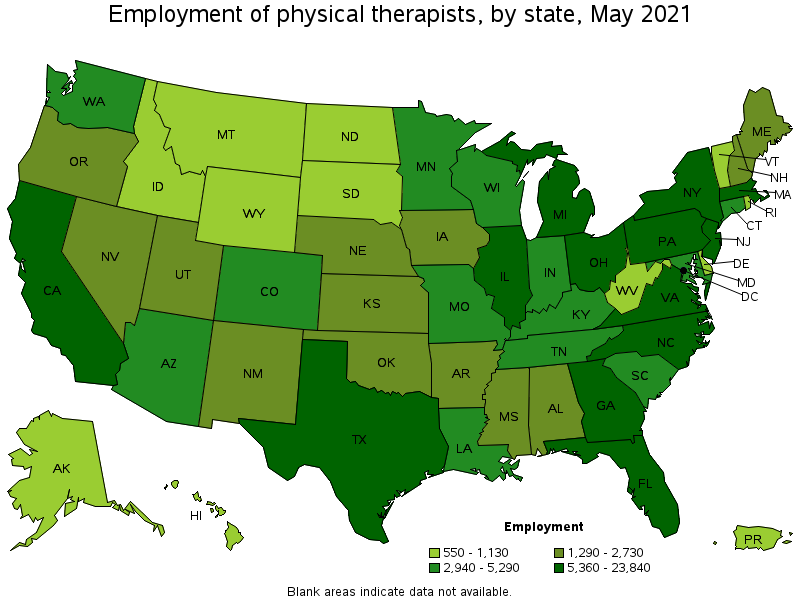
States with the highest employment level in Physical Therapists:
| State | Employment (1) | Employment per thousand jobs | Location quotient (9) | Hourly mean wage | Annual mean wage (2) |
|---|---|---|---|---|---|
| California | 23,840 | 1.44 | 0.90 | $ 49.77 | $ 103,510 |
| New York | 16,130 | 1.86 | 1.16 | $ 44.18 | $ 91,890 |
| Texas | 14,040 | 1.15 | 0.72 | $ 47.28 | $ 98,340 |
| Florida | 13,220 | 1.54 | 0.96 | $ 43.57 | $ 90,630 |
| Pennsylvania | 10,700 | 1.92 | 1.20 | $ 45.39 | $ 94,400 |
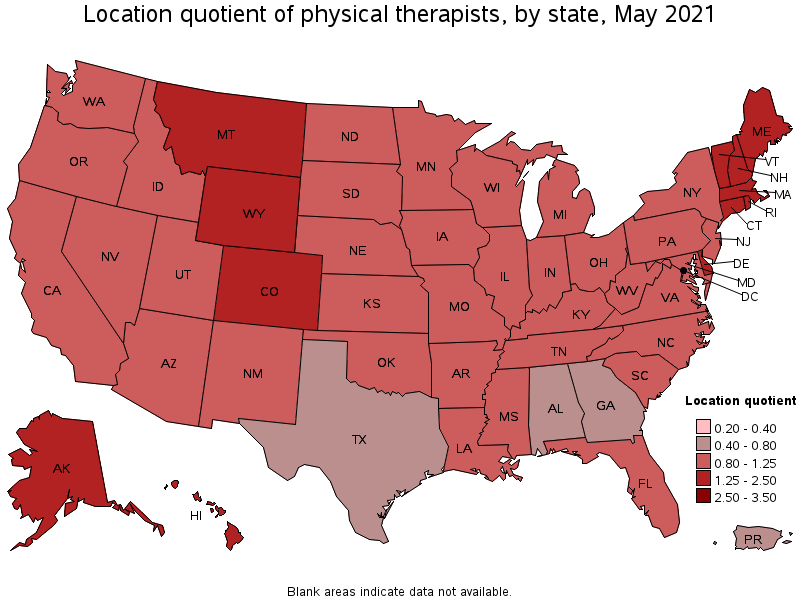
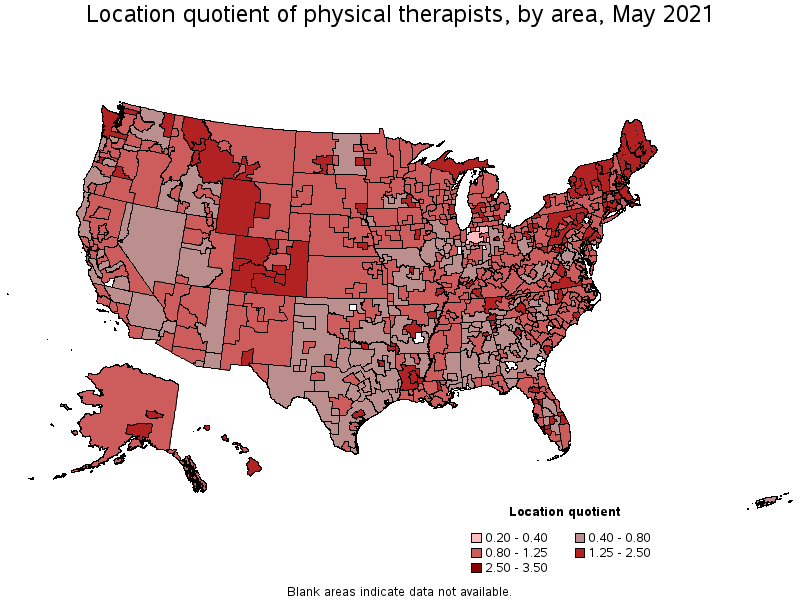
States with the highest concentration of jobs and location quotients in Physical Therapists:
| State | Employment (1) | Employment per thousand jobs | Location quotient (9) | Hourly mean wage | Annual mean wage (2) |
|---|---|---|---|---|---|
| Maine | 1,420 | 2.40 | 1.50 | $ 41.17 | $ 85,620 |
| Montana | 1,120 | 2.39 | 1.49 | $ 39.74 | $ 82,660 |
| Alaska | 680 | 2.30 | 1.44 | $ 46.63 | $ 96,980 |
| Vermont | 630 | 2.21 | 1.38 | $ 41.08 | $ 85,440 |
| Wyoming | 570 | 2.20 | 1.38 | $ 42.88 | $ 89,190 |
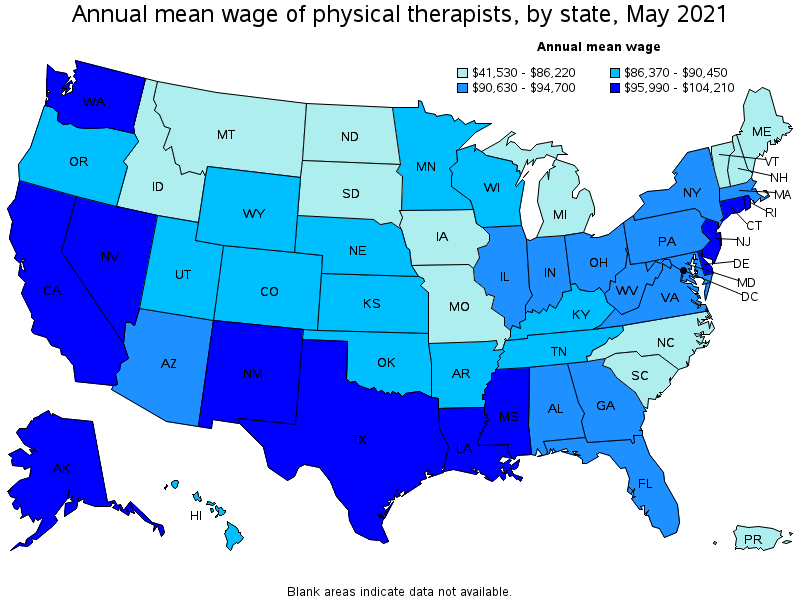
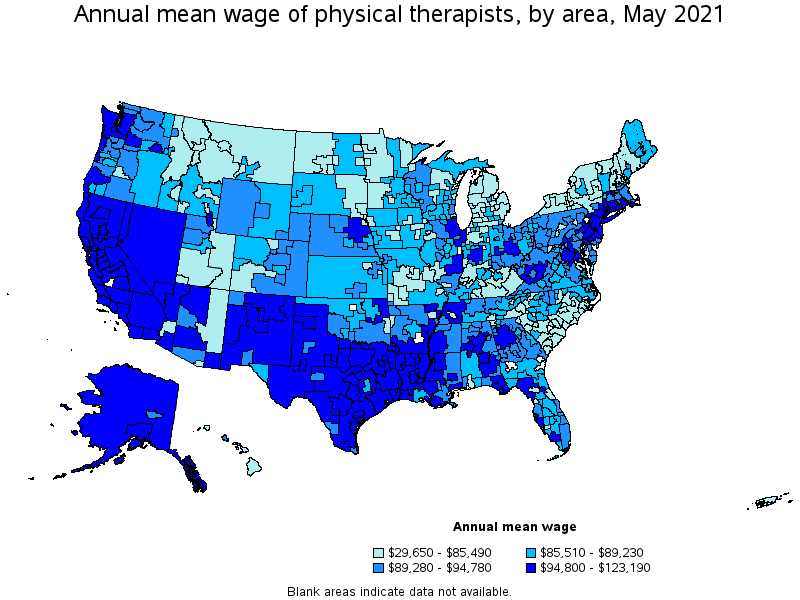
Top paying states for Physical Therapists:
| State | Employment (1) | Employment per thousand jobs | Location quotient (9) | Hourly mean wage | Annual mean wage (2) |
|---|---|---|---|---|---|
| Nevada | 1,860 | 1.44 | 0.90 | $ 50.10 | $ 104,210 |
| California | 23,840 | 1.44 | 0.90 | $ 49.77 | $ 103,510 |
| Connecticut | 3,410 | 2.17 | 1.36 | $ 48.64 | $ 101,180 |
| Delaware | 870 | 1.99 | 1.25 | $ 48.31 | $ 100,490 |
| New Jersey | 7,400 | 1.92 | 1.20 | $ 47.85 | $ 99,530 |
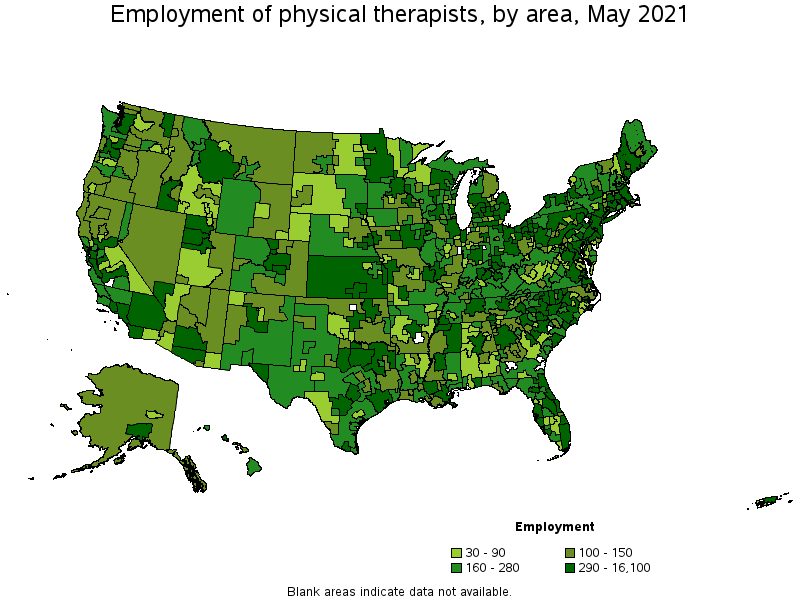
Metropolitan areas with the highest employment level in Physical Therapists:
| Metropolitan area | Employment (1) | Employment per thousand jobs | Location quotient (9) | Hourly mean wage | Annual mean wage (2) |
|---|---|---|---|---|---|
| New York-Newark-Jersey City, NY-NJ-PA | 16,100 | 1.86 | 1.16 | $ 47.54 | $ 98,870 |
| Los Angeles-Long Beach-Anaheim, CA | 9,530 | 1.67 | 1.04 | $ 45.64 | $ 94,940 |
| Chicago-Naperville-Elgin, IL-IN-WI | 7,140 | 1.69 | 1.05 | $ 45.58 | $ 94,810 |
| Philadelphia-Camden-Wilmington, PA-NJ-DE-MD | 5,880 | 2.22 | 1.39 | $ 47.50 | $ 98,800 |
| Boston-Cambridge-Nashua, MA-NH | 5,700 | 2.21 | 1.38 | $ 44.21 | $ 91,970 |
| Dallas-Fort Worth-Arlington, TX | 3,920 | 1.09 | 0.68 | $ 46.63 | $ 96,980 |
| Miami-Fort Lauderdale-West Palm Beach, FL | 3,730 | 1.52 | 0.95 | $ 43.97 | $ 91,450 |
| Washington-Arlington-Alexandria, DC-VA-MD-WV | 3,730 | 1.27 | 0.79 | $ 47.01 | $ 97,770 |
| Detroit-Warren-Dearborn, MI | 3,490 | 1.94 | 1.21 | $ 40.05 | $ 83,310 |
| Minneapolis-St. Paul-Bloomington, MN-WI | 3,140 | 1.72 | 1.08 | $ 41.82 | $ 86,990 |
Metropolitan areas with the highest concentration of jobs and location quotients in Physical Therapists:
| Metropolitan area | Employment (1) | Employment per thousand jobs | Location quotient (9) | Hourly mean wage | Annual mean wage (2) |
|---|---|---|---|---|---|
| Bay City, MI | 140 | 4.32 | 2.70 | $ 36.29 | $ 75,470 |
| Bloomsburg-Berwick, PA | 140 | 3.56 | 2.23 | $ 40.95 | $ 85,180 |
| Punta Gorda, FL | 160 | 3.19 | 1.99 | $ 39.75 | $ 82,680 |
| Waterbury, CT | 200 | 3.07 | 1.92 | $ 47.11 | $ 98,000 |
| Johnstown, PA | 140 | 3.02 | 1.89 | $ 41.21 | $ 85,710 |
| Las Cruces, NM | 200 | 2.99 | 1.87 | $ 45.42 | $ 94,470 |
| Athens-Clarke County, GA | 250 | 2.95 | 1.84 | $ 41.85 | $ 87,040 |
| Rochester, MN | 340 | 2.94 | 1.84 | $ 42.17 | $ 87,720 |
| New Bedford, MA | 180 | 2.91 | 1.82 | $ 43.75 | $ 91,000 |
| Cape Coral-Fort Myers, FL | 760 | 2.83 | 1.77 | $ 42.36 | $ 88,100 |
Top paying metropolitan areas for Physical Therapists:
| Metropolitan area | Employment (1) | Employment per thousand jobs | Location quotient (9) | Hourly mean wage | Annual mean wage (2) |
|---|---|---|---|---|---|
| San Jose-Sunnyvale-Santa Clara, CA | 1,210 | 1.13 | 0.71 | $ 59.22 | $ 123,190 |
| San Francisco-Oakland-Hayward, CA | 3,050 | 1.36 | 0.85 | $ 56.91 | $ 118,370 |
| Midland, TX | 70 | 0.75 | 0.47 | $ 56.19 | $ 116,880 |
| Napa, CA | 90 | 1.30 | 0.81 | $ 55.07 | $ 114,540 |
| Carson City, NV | 70 | 2.29 | 1.43 | $ 55.04 | $ 114,470 |
| Santa Rosa, CA | 280 | 1.44 | 0.90 | $ 54.88 | $ 114,150 |
| Santa Maria-Santa Barbara, CA | 260 | 1.33 | 0.83 | $ 53.32 | $ 110,910 |
| Salinas, CA | 170 | 1.01 | 0.63 | $ 53.30 | $ 110,860 |
| Sacramento--Roseville--Arden-Arcade, CA | 1,470 | 1.50 | 0.94 | $ 52.79 | $ 109,810 |
| Yuba City, CA | 70 | 1.55 | 0.97 | $ 52.72 | $ 109,650 |
Nonmetropolitan areas with the highest employment in Physical Therapists:
| Nonmetropolitan area | Employment (1) | Employment per thousand jobs | Location quotient (9) | Hourly mean wage | Annual mean wage (2) |
|---|---|---|---|---|---|
| Kansas nonmetropolitan area | 520 | 1.39 | 0.87 | $ 42.31 | $ 88,010 |
| Southwest Maine nonmetropolitan area | 430 | 2.37 | 1.48 | $ 40.27 | $ 83,760 |
| Piedmont North Carolina nonmetropolitan area | 430 | 1.77 | 1.11 | $ 41.23 | $ 85,750 |
| North Northeastern Ohio nonmetropolitan area (noncontiguous) | 400 | 1.27 | 0.80 | $ 43.40 | $ 90,270 |
| Northeast Mississippi nonmetropolitan area | 390 | 1.74 | 1.09 | $ 45.13 | $ 93,870 |
Nonmetropolitan areas with the highest concentration of jobs and location quotients in Physical Therapists:
| Nonmetropolitan area | Employment (1) | Employment per thousand jobs | Location quotient (9) | Hourly mean wage | Annual mean wage (2) |
|---|---|---|---|---|---|
| Connecticut nonmetropolitan area | 110 | 3.62 | 2.26 | $ 49.82 | $ 103,620 |
| West Montana nonmetropolitan area | 220 | 2.86 | 1.79 | $ 38.69 | $ 80,470 |
| Southwest Colorado nonmetropolitan area | 270 | 2.73 | 1.71 | $ 39.01 | $ 81,140 |
| Central New Hampshire nonmetropolitan area | 230 | 2.61 | 1.63 | $ 40.11 | $ 83,420 |
| Southwest Montana nonmetropolitan area | 360 | 2.57 | 1.61 | $ 39.84 | $ 82,870 |
Top paying nonmetropolitan areas for Physical Therapists:
| Nonmetropolitan area | Employment (1) | Employment per thousand jobs | Location quotient (9) | Hourly mean wage | Annual mean wage (2) |
|---|---|---|---|---|---|
| Eastern New Mexico nonmetropolitan area | 210 | 1.46 | 0.91 | $ 50.98 | $ 106,050 |
| Central Louisiana nonmetropolitan area | 170 | 2.33 | 1.46 | $ 50.62 | $ 105,290 |
| Alaska nonmetropolitan area | 150 | 1.51 | 0.94 | $ 50.57 | $ 105,190 |
| Connecticut nonmetropolitan area | 110 | 3.62 | 2.26 | $ 49.82 | $ 103,620 |
| West Tennessee nonmetropolitan area | 190 | 1.53 | 0.96 | $ 49.69 | $ 103,360 |
These estimates are calculated with data collected from employers in all industry sectors, all metropolitan and nonmetropolitan areas, and all states and the District of Columbia. The top employment and wage figures are provided above. The complete list is available in the downloadable XLS files.
The percentile wage estimate is the value of a wage below which a certain percent of workers fall. The median wage is the 50th percentile wage estimate—50 percent of workers earn less than the median and 50 percent of workers earn more than the median. More about percentile wages.
(1) Estimates for detailed occupations do not sum to the totals because the totals include occupations not shown separately. Estimates do not include self-employed workers.
(2) Annual wages have been calculated by multiplying the hourly mean wage by a "year-round, full-time" hours figure of 2,080 hours; for those occupations where there is not an hourly wage published, the annual wage has been directly calculated from the reported survey data.
(3) The relative standard error (RSE) is a measure of the reliability of a survey statistic. The smaller the relative standard error, the more precise the estimate.
(9) The location quotient is the ratio of the area concentration of occupational employment to the national average concentration. A location quotient greater than one indicates the occupation has a higher share of employment than average, and a location quotient less than one indicates the occupation is less prevalent in the area than average.
Other OEWS estimates and related information:
May 2021 National Occupational Employment and Wage Estimates
May 2021 State Occupational Employment and Wage Estimates
May 2021 Metropolitan and Nonmetropolitan Area Occupational Employment and Wage Estimates
May 2021 National Industry-Specific Occupational Employment and Wage Estimates
Last Modified Date: March 31, 2022