
An official website of the United States government
An official website of the United States government
The .gov means it's official.
Federal government websites often end in .gov or .mil. Before sharing sensitive information,
make sure you're on a federal government site.
The site is secure.
The
https:// ensures that you are connecting to the official website and that any
information you provide is encrypted and transmitted securely.
Diagnose, treat, or research diseases and injuries of animals. Includes veterinarians who conduct research and development, inspect livestock, or care for pets and companion animals.
Employment estimate and mean wage estimates for Veterinarians:
| Employment (1) | Employment RSE (3) |
Mean hourly wage |
Mean annual wage (2) |
Wage RSE (3) |
|---|---|---|---|---|
| 77,260 | 1.0 % | $ 52.84 | $ 109,920 | 0.7 % |
Percentile wage estimates for Veterinarians:
| Percentile | 10% | 25% | 50% (Median) |
75% | 90% |
|---|---|---|---|---|---|
| Hourly Wage | $ 29.21 | $ 37.94 | $ 48.26 | $ 61.74 | $ 79.62 |
| Annual Wage (2) | $ 60,760 | $ 78,920 | $ 100,370 | $ 128,410 | $ 165,600 |
Industries with the highest published employment and wages for Veterinarians are provided. For a list of all industries with employment in Veterinarians, see the Create Customized Tables function.
Industries with the highest levels of employment in Veterinarians:
| Industry | Employment (1) | Percent of industry employment | Hourly mean wage | Annual mean wage (2) |
|---|---|---|---|---|
| Other Professional, Scientific, and Technical Services | 71,300 | 9.35 | $ 53.16 | $ 110,580 |
| Federal Executive Branch (OEWS Designation) | 1,180 | 0.06 | $ 47.12 | $ 98,000 |
| Social Advocacy Organizations | 900 | 0.40 | $ 48.38 | $ 100,630 |
| State Government, excluding schools and hospitals (OEWS Designation) | 670 | 0.03 | $ 46.07 | $ 95,830 |
| Colleges, Universities, and Professional Schools | 660 | 0.02 | $ 43.39 | $ 90,250 |
Industries with the highest concentration of employment in Veterinarians:
| Industry | Employment (1) | Percent of industry employment | Hourly mean wage | Annual mean wage (2) |
|---|---|---|---|---|
| Other Professional, Scientific, and Technical Services | 71,300 | 9.35 | $ 53.16 | $ 110,580 |
| Social Advocacy Organizations | 900 | 0.40 | $ 48.38 | $ 100,630 |
| Support Activities for Animal Production | 80 | 0.27 | $ 55.82 | $ 116,100 |
| Other Personal Services | 660 | 0.22 | $ 47.34 | $ 98,460 |
| Museums, Historical Sites, and Similar Institutions | 180 | 0.14 | $ 42.45 | $ 88,290 |
Top paying industries for Veterinarians:
| Industry | Employment (1) | Percent of industry employment | Hourly mean wage | Annual mean wage (2) |
|---|---|---|---|---|
| General Medical and Surgical Hospitals | 50 | (7) | $ 67.53 | $ 140,470 |
| Scientific Research and Development Services | 390 | 0.05 | $ 65.23 | $ 135,670 |
| Spectator Sports | 30 | 0.03 | $ 59.02 | $ 122,770 |
| Professional and Commercial Equipment and Supplies Merchant Wholesalers | (8) | (8) | $ 57.14 | $ 118,840 |
| Support Activities for Animal Production | 80 | 0.27 | $ 55.82 | $ 116,100 |
States and areas with the highest published employment, location quotients, and wages for Veterinarians are provided. For a list of all areas with employment in Veterinarians, see the Create Customized Tables function.
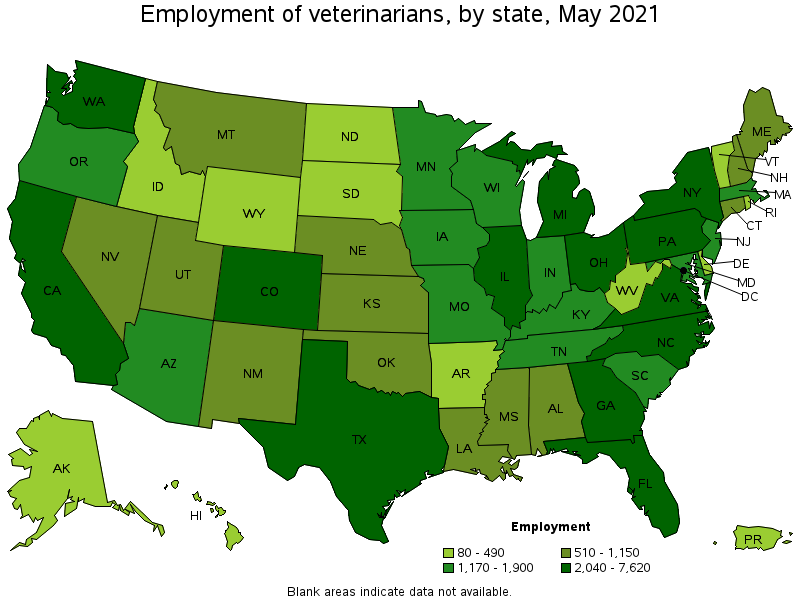
States with the highest employment level in Veterinarians:
| State | Employment (1) | Employment per thousand jobs | Location quotient (9) | Hourly mean wage | Annual mean wage (2) |
|---|---|---|---|---|---|
| California | 7,620 | 0.46 | 0.84 | $ 60.91 | $ 126,690 |
| Texas | 5,400 | 0.44 | 0.81 | $ 54.67 | $ 113,720 |
| Florida | 4,790 | 0.56 | 1.02 | $ 52.08 | $ 108,320 |
| New York | 3,640 | 0.42 | 0.77 | $ 62.12 | $ 129,210 |
| Ohio | 3,330 | 0.64 | 1.17 | $ 47.12 | $ 98,010 |
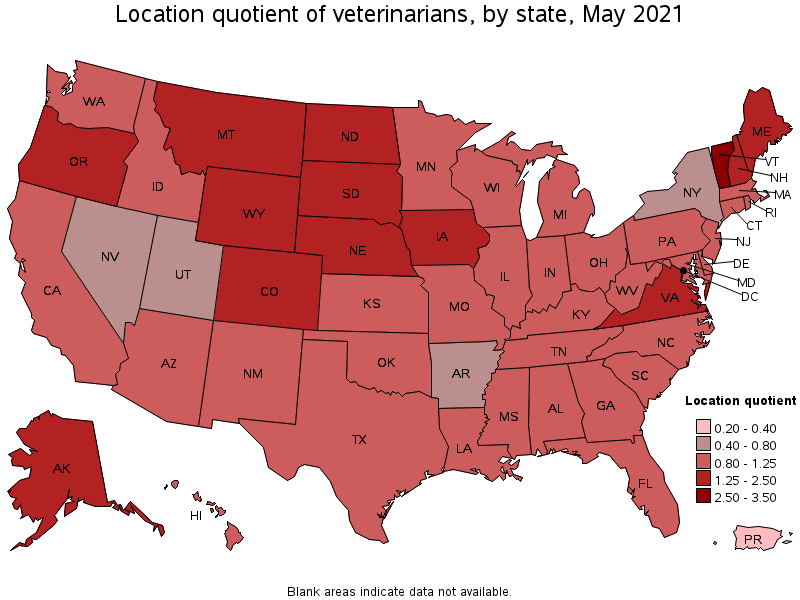
States with the highest concentration of jobs and location quotients in Veterinarians:
| State | Employment (1) | Employment per thousand jobs | Location quotient (9) | Hourly mean wage | Annual mean wage (2) |
|---|---|---|---|---|---|
| Vermont | 400 | 1.40 | 2.54 | $ 48.43 | $ 100,730 |
| Montana | 550 | 1.17 | 2.14 | $ 39.46 | $ 82,070 |
| New Hampshire | 570 | 0.89 | 1.63 | $ 54.76 | $ 113,910 |
| Colorado | 2,320 | 0.89 | 1.61 | $ 47.45 | $ 98,690 |
| Maine | 510 | 0.87 | 1.58 | $ 51.73 | $ 107,600 |
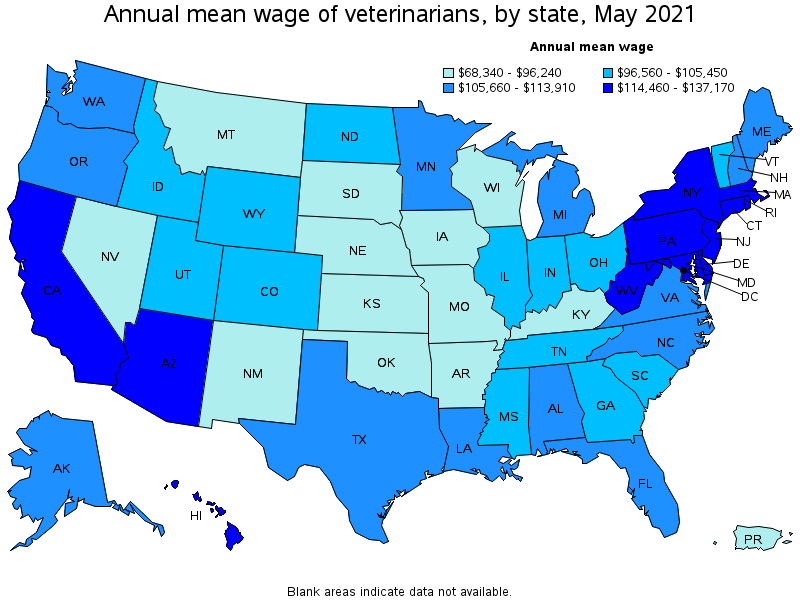
Top paying states for Veterinarians:
| State | Employment (1) | Employment per thousand jobs | Location quotient (9) | Hourly mean wage | Annual mean wage (2) |
|---|---|---|---|---|---|
| District of Columbia | 80 | 0.13 | 0.23 | $ 65.95 | $ 137,170 |
| Connecticut | 920 | 0.59 | 1.07 | $ 64.45 | $ 134,050 |
| Rhode Island | 250 | 0.55 | 1.01 | $ 62.44 | $ 129,880 |
| New York | 3,640 | 0.42 | 0.77 | $ 62.12 | $ 129,210 |
| New Jersey | 1,770 | 0.46 | 0.84 | $ 61.23 | $ 127,360 |
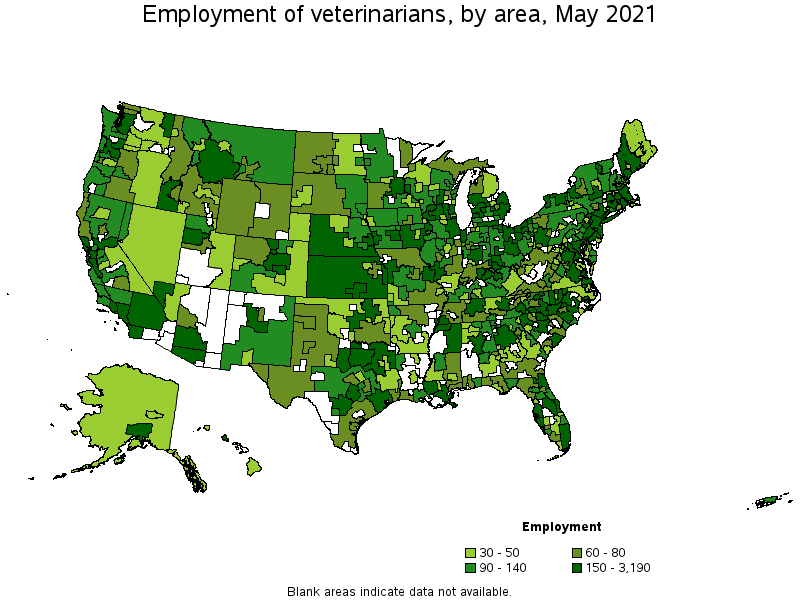
Metropolitan areas with the highest employment level in Veterinarians:
| Metropolitan area | Employment (1) | Employment per thousand jobs | Location quotient (9) | Hourly mean wage | Annual mean wage (2) |
|---|---|---|---|---|---|
| New York-Newark-Jersey City, NY-NJ-PA | 3,190 | 0.37 | 0.67 | $ 65.55 | $ 136,340 |
| Los Angeles-Long Beach-Anaheim, CA | 2,100 | 0.37 | 0.67 | $ 58.53 | $ 121,750 |
| Chicago-Naperville-Elgin, IL-IN-WI | 1,860 | 0.44 | 0.80 | $ 51.42 | $ 106,960 |
| Washington-Arlington-Alexandria, DC-VA-MD-WV | 1,690 | 0.58 | 1.05 | $ 63.19 | $ 131,430 |
| Dallas-Fort Worth-Arlington, TX | 1,530 | 0.43 | 0.78 | $ 55.67 | $ 115,790 |
| Atlanta-Sandy Springs-Roswell, GA | 1,410 | 0.54 | 0.99 | $ 52.63 | $ 109,460 |
| Boston-Cambridge-Nashua, MA-NH | 1,380 | 0.53 | 0.97 | $ 56.78 | $ 118,100 |
| Philadelphia-Camden-Wilmington, PA-NJ-DE-MD | 1,360 | 0.51 | 0.93 | $ 60.62 | $ 126,090 |
| Houston-The Woodlands-Sugar Land, TX | 1,220 | 0.42 | 0.77 | $ 56.72 | $ 117,980 |
| Miami-Fort Lauderdale-West Palm Beach, FL | 1,220 | 0.50 | 0.90 | $ 51.70 | $ 107,530 |
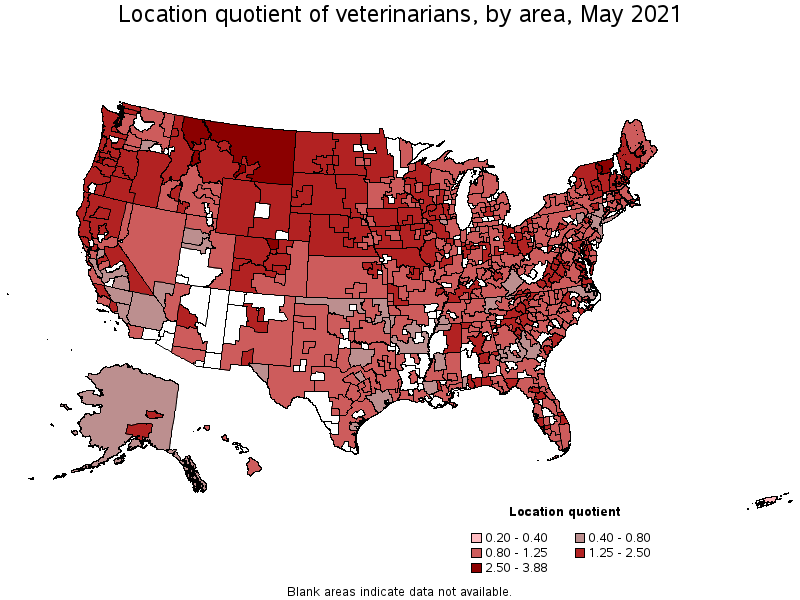
Metropolitan areas with the highest concentration of jobs and location quotients in Veterinarians:
| Metropolitan area | Employment (1) | Employment per thousand jobs | Location quotient (9) | Hourly mean wage | Annual mean wage (2) |
|---|---|---|---|---|---|
| Ames, IA | 90 | 2.13 | 3.88 | $ 32.31 | $ 67,210 |
| Corvallis, OR | 60 | 1.68 | 3.06 | $ 49.38 | $ 102,710 |
| Burlington-South Burlington, VT | 180 | 1.57 | 2.86 | $ 48.69 | $ 101,280 |
| Fort Collins, CO | 250 | 1.54 | 2.81 | $ 44.79 | $ 93,160 |
| Dover-Durham, NH-ME | 70 | 1.32 | 2.41 | $ 53.35 | $ 110,970 |
| Mount Vernon-Anacortes, WA | 60 | 1.26 | 2.30 | $ 52.67 | $ 109,540 |
| Santa Rosa, CA | 240 | 1.24 | 2.26 | $ 67.47 | $ 140,340 |
| Auburn-Opelika, AL | 70 | 1.22 | 2.22 | $ 48.07 | $ 99,990 |
| Lexington-Fayette, KY | 310 | 1.21 | 2.21 | $ 53.26 | $ 110,790 |
| Santa Cruz-Watsonville, CA | 110 | 1.21 | 2.21 | $ 62.56 | $ 130,130 |
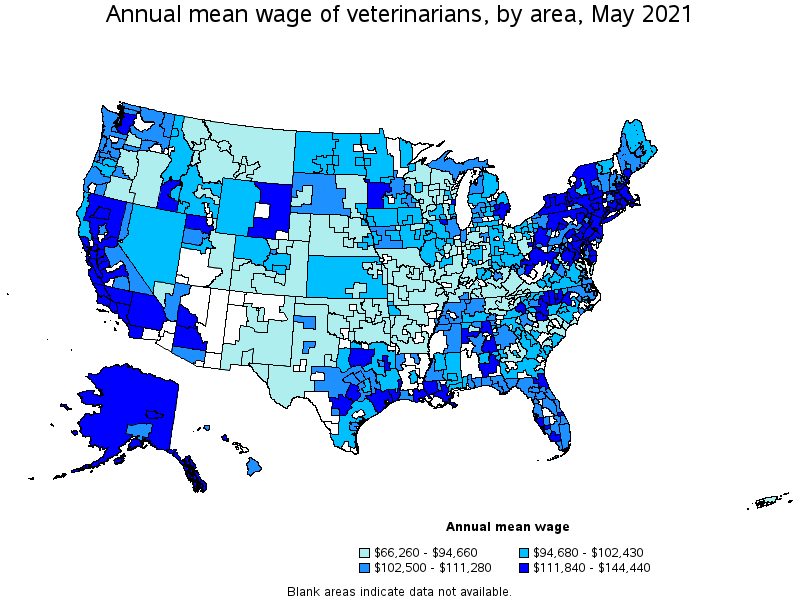
Top paying metropolitan areas for Veterinarians:
| Metropolitan area | Employment (1) | Employment per thousand jobs | Location quotient (9) | Hourly mean wage | Annual mean wage (2) |
|---|---|---|---|---|---|
| San Francisco-Oakland-Hayward, CA | 1,000 | 0.45 | 0.81 | $ 69.44 | $ 144,440 |
| San Jose-Sunnyvale-Santa Clara, CA | 360 | 0.33 | 0.61 | $ 68.11 | $ 141,670 |
| Bridgeport-Stamford-Norwalk, CT | 250 | 0.67 | 1.23 | $ 67.50 | $ 140,390 |
| Santa Rosa, CA | 240 | 1.24 | 2.26 | $ 67.47 | $ 140,340 |
| New York-Newark-Jersey City, NY-NJ-PA | 3,190 | 0.37 | 0.67 | $ 65.55 | $ 136,340 |
| Vallejo-Fairfield, CA | 100 | 0.77 | 1.40 | $ 65.12 | $ 135,450 |
| Hartford-West Hartford-East Hartford, CT | 320 | 0.60 | 1.09 | $ 64.73 | $ 134,640 |
| New Haven, CT | 140 | 0.51 | 0.93 | $ 63.87 | $ 132,850 |
| Waterbury, CT | 40 | 0.59 | 1.07 | $ 63.55 | $ 132,190 |
| Washington-Arlington-Alexandria, DC-VA-MD-WV | 1,690 | 0.58 | 1.05 | $ 63.19 | $ 131,430 |
Nonmetropolitan areas with the highest employment in Veterinarians:
| Nonmetropolitan area | Employment (1) | Employment per thousand jobs | Location quotient (9) | Hourly mean wage | Annual mean wage (2) |
|---|---|---|---|---|---|
| Kansas nonmetropolitan area | 250 | 0.68 | 1.23 | $ 46.93 | $ 97,610 |
| North Northeastern Ohio nonmetropolitan area (noncontiguous) | 240 | 0.77 | 1.41 | $ 41.79 | $ 86,930 |
| South Central Wisconsin nonmetropolitan area | 210 | 1.03 | 1.89 | $ 44.20 | $ 91,940 |
| Southeast Iowa nonmetropolitan area | 170 | 0.82 | 1.50 | $ 46.28 | $ 96,250 |
| North Texas Region of Texas nonmetropolitan area | 170 | 0.65 | 1.18 | $ 48.19 | $ 100,240 |
Nonmetropolitan areas with the highest concentration of jobs and location quotients in Veterinarians:
| Nonmetropolitan area | Employment (1) | Employment per thousand jobs | Location quotient (9) | Hourly mean wage | Annual mean wage (2) |
|---|---|---|---|---|---|
| West Montana nonmetropolitan area | 120 | 1.62 | 2.95 | $ 41.13 | $ 85,550 |
| Northern Vermont nonmetropolitan area | 100 | 1.60 | 2.91 | $ 46.30 | $ 96,300 |
| East-Central Montana nonmetropolitan area | 100 | 1.60 | 2.91 | $ 35.65 | $ 74,150 |
| Southwest Montana nonmetropolitan area | 170 | 1.22 | 2.23 | $ 39.80 | $ 82,780 |
| Southwest Iowa nonmetropolitan area | 100 | 1.20 | 2.18 | $ 49.42 | $ 102,790 |
Top paying nonmetropolitan areas for Veterinarians:
| Nonmetropolitan area | Employment (1) | Employment per thousand jobs | Location quotient (9) | Hourly mean wage | Annual mean wage (2) |
|---|---|---|---|---|---|
| Northern West Virginia nonmetropolitan area | 60 | 0.45 | 0.83 | $ 63.04 | $ 131,120 |
| Northwest Alabama nonmetropolitan area | 30 | 0.49 | 0.89 | $ 59.43 | $ 123,610 |
| Northern Pennsylvania nonmetropolitan area | 90 | 0.60 | 1.10 | $ 57.98 | $ 120,590 |
| Capital/Northern New York nonmetropolitan area | 140 | 1.07 | 1.95 | $ 57.41 | $ 119,410 |
| Eastern Wyoming nonmetropolitan area | 70 | 0.91 | 1.65 | $ 57.17 | $ 118,910 |
These estimates are calculated with data collected from employers in all industry sectors, all metropolitan and nonmetropolitan areas, and all states and the District of Columbia. The top employment and wage figures are provided above. The complete list is available in the downloadable XLS files.
The percentile wage estimate is the value of a wage below which a certain percent of workers fall. The median wage is the 50th percentile wage estimate—50 percent of workers earn less than the median and 50 percent of workers earn more than the median. More about percentile wages.
(1) Estimates for detailed occupations do not sum to the totals because the totals include occupations not shown separately. Estimates do not include self-employed workers.
(2) Annual wages have been calculated by multiplying the hourly mean wage by a "year-round, full-time" hours figure of 2,080 hours; for those occupations where there is not an hourly wage published, the annual wage has been directly calculated from the reported survey data.
(3) The relative standard error (RSE) is a measure of the reliability of a survey statistic. The smaller the relative standard error, the more precise the estimate.
(7) The value is less than .005 percent of industry employment.
(8) Estimate not released.
(9) The location quotient is the ratio of the area concentration of occupational employment to the national average concentration. A location quotient greater than one indicates the occupation has a higher share of employment than average, and a location quotient less than one indicates the occupation is less prevalent in the area than average.
Other OEWS estimates and related information:
May 2021 National Occupational Employment and Wage Estimates
May 2021 State Occupational Employment and Wage Estimates
May 2021 Metropolitan and Nonmetropolitan Area Occupational Employment and Wage Estimates
May 2021 National Industry-Specific Occupational Employment and Wage Estimates
Last Modified Date: March 31, 2022