
An official website of the United States government
An official website of the United States government
The .gov means it's official.
Federal government websites often end in .gov or .mil. Before sharing sensitive information,
make sure you're on a federal government site.
The site is secure.
The
https:// ensures that you are connecting to the official website and that any
information you provide is encrypted and transmitted securely.
Diagnose and treat acute, episodic, or chronic illness, independently or as part of a healthcare team. May focus on health promotion and disease prevention. May order, perform, or interpret diagnostic tests such as lab work and x rays. May prescribe medication. Must be registered nurses who have specialized graduate education.
Employment estimate and mean wage estimates for Nurse Practitioners:
| Employment (1) | Employment RSE (3) |
Mean hourly wage |
Mean annual wage (2) |
Wage RSE (3) |
|---|---|---|---|---|
| 234,690 | 1.3 % | $ 56.75 | $ 118,040 | 0.4 % |
Percentile wage estimates for Nurse Practitioners:
| Percentile | 10% | 25% | 50% (Median) |
75% | 90% |
|---|---|---|---|---|---|
| Hourly Wage | $ 38.21 | $ 47.86 | $ 58.02 | $ 62.35 | $ 78.54 |
| Annual Wage (2) | $ 79,470 | $ 99,540 | $ 120,680 | $ 129,680 | $ 163,350 |
Industries with the highest published employment and wages for Nurse Practitioners are provided. For a list of all industries with employment in Nurse Practitioners, see the Create Customized Tables function.
Industries with the highest levels of employment in Nurse Practitioners:
| Industry | Employment (1) | Percent of industry employment | Hourly mean wage | Annual mean wage (2) |
|---|---|---|---|---|
| Offices of Physicians | 110,490 | 4.10 | $ 55.23 | $ 114,870 |
| General Medical and Surgical Hospitals | 52,790 | 0.94 | $ 59.12 | $ 122,960 |
| Outpatient Care Centers | 22,630 | 2.29 | $ 62.11 | $ 129,190 |
| Offices of Other Health Practitioners | 9,360 | 0.96 | $ 52.35 | $ 108,890 |
| Home Health Care Services | 6,630 | 0.44 | $ 64.03 | $ 133,170 |
Industries with the highest concentration of employment in Nurse Practitioners:
| Industry | Employment (1) | Percent of industry employment | Hourly mean wage | Annual mean wage (2) |
|---|---|---|---|---|
| Offices of Physicians | 110,490 | 4.10 | $ 55.23 | $ 114,870 |
| Outpatient Care Centers | 22,630 | 2.29 | $ 62.11 | $ 129,190 |
| Offices of Other Health Practitioners | 9,360 | 0.96 | $ 52.35 | $ 108,890 |
| General Medical and Surgical Hospitals | 52,790 | 0.94 | $ 59.12 | $ 122,960 |
| Psychiatric and Substance Abuse Hospitals | 2,130 | 0.89 | $ 63.38 | $ 131,830 |
Top paying industries for Nurse Practitioners:
| Industry | Employment (1) | Percent of industry employment | Hourly mean wage | Annual mean wage (2) |
|---|---|---|---|---|
| Accounting, Tax Preparation, Bookkeeping, and Payroll Services | 50 | 0.01 | $ 71.62 | $ 148,980 |
| Business, Professional, Labor, Political, and Similar Organizations | 70 | 0.02 | $ 64.33 | $ 133,800 |
| Home Health Care Services | 6,630 | 0.44 | $ 64.03 | $ 133,170 |
| Psychiatric and Substance Abuse Hospitals | 2,130 | 0.89 | $ 63.38 | $ 131,830 |
| Outpatient Care Centers | 22,630 | 2.29 | $ 62.11 | $ 129,190 |
States and areas with the highest published employment, location quotients, and wages for Nurse Practitioners are provided. For a list of all areas with employment in Nurse Practitioners, see the Create Customized Tables function.
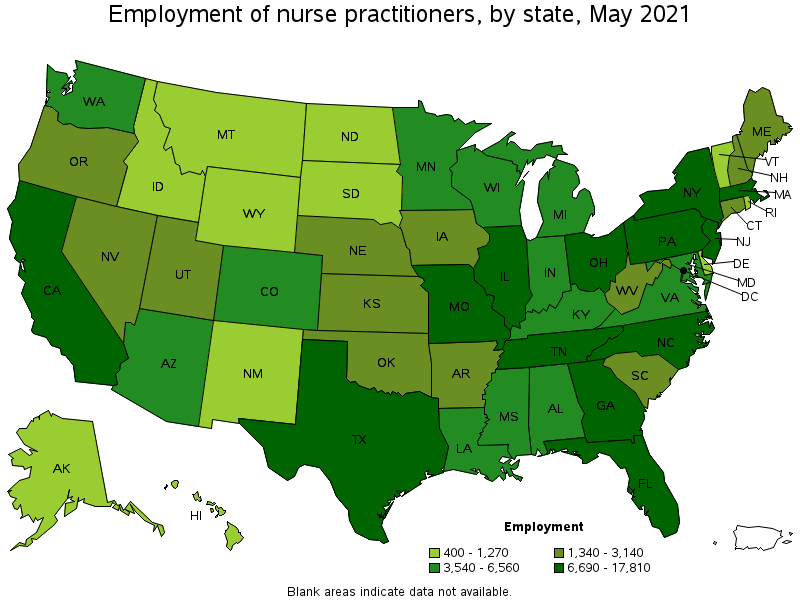
States with the highest employment level in Nurse Practitioners:
| State | Employment (1) | Employment per thousand jobs | Location quotient (9) | Hourly mean wage | Annual mean wage (2) |
|---|---|---|---|---|---|
| Texas | 17,810 | 1.46 | 0.87 | $ 56.68 | $ 117,890 |
| California | 17,400 | 1.05 | 0.63 | $ 72.99 | $ 151,830 |
| New York | 15,190 | 1.75 | 1.05 | $ 64.39 | $ 133,940 |
| Florida | 14,880 | 1.73 | 1.04 | $ 50.40 | $ 104,830 |
| Tennessee | 11,360 | 3.80 | 2.28 | $ 45.73 | $ 95,120 |
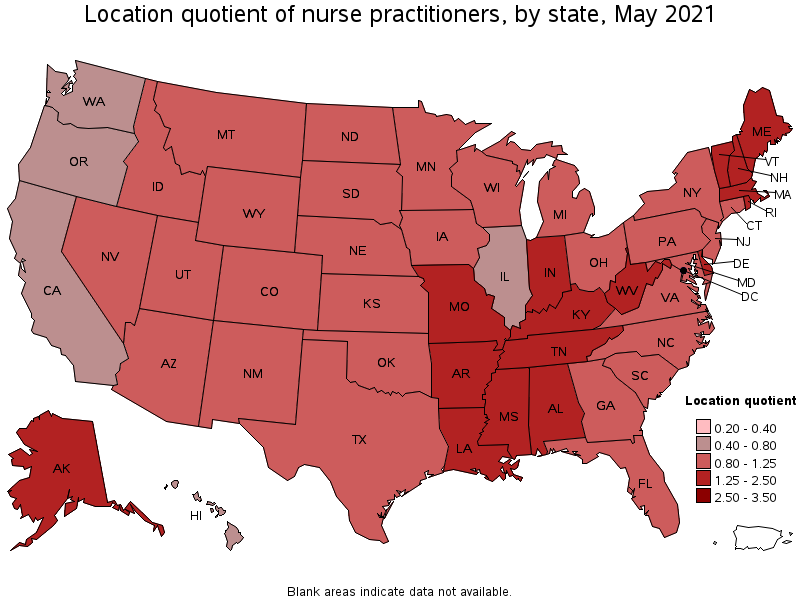
States with the highest concentration of jobs and location quotients in Nurse Practitioners:
| State | Employment (1) | Employment per thousand jobs | Location quotient (9) | Hourly mean wage | Annual mean wage (2) |
|---|---|---|---|---|---|
| Tennessee | 11,360 | 3.80 | 2.28 | $ 45.73 | $ 95,120 |
| Mississippi | 3,860 | 3.51 | 2.10 | $ 53.73 | $ 111,750 |
| West Virginia | 1,780 | 2.71 | 1.63 | $ 50.36 | $ 104,750 |
| Alaska | 770 | 2.60 | 1.56 | $ 54.72 | $ 113,820 |
| Missouri | 6,940 | 2.54 | 1.53 | $ 49.76 | $ 103,490 |
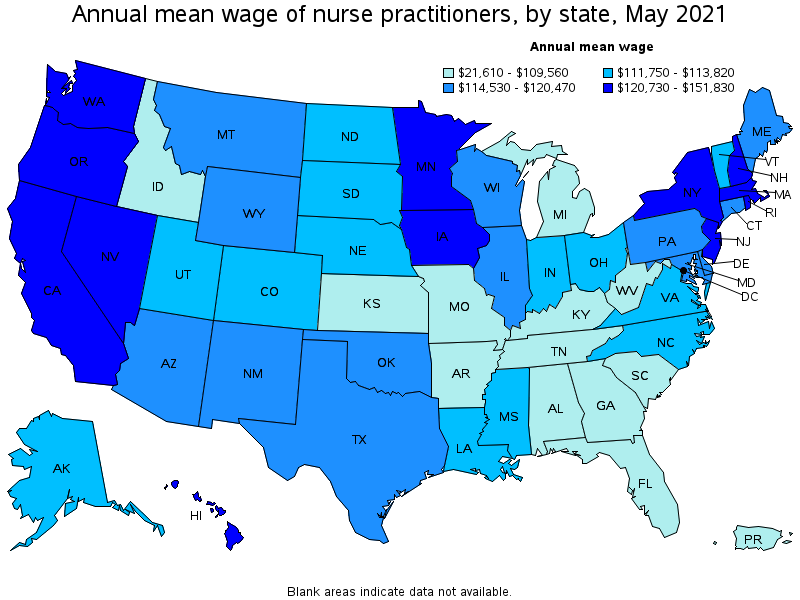
Top paying states for Nurse Practitioners:
| State | Employment (1) | Employment per thousand jobs | Location quotient (9) | Hourly mean wage | Annual mean wage (2) |
|---|---|---|---|---|---|
| California | 17,400 | 1.05 | 0.63 | $ 72.99 | $ 151,830 |
| New Jersey | 6,690 | 1.74 | 1.04 | $ 65.87 | $ 137,010 |
| New York | 15,190 | 1.75 | 1.05 | $ 64.39 | $ 133,940 |
| Washington | 3,730 | 1.16 | 0.70 | $ 62.90 | $ 130,840 |
| Massachusetts | 7,330 | 2.16 | 1.30 | $ 62.28 | $ 129,540 |
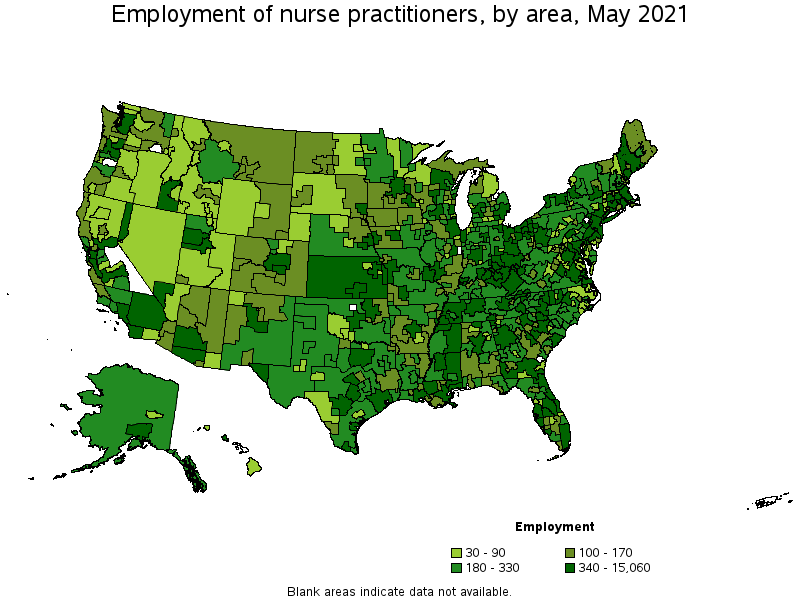
Metropolitan areas with the highest employment level in Nurse Practitioners:
| Metropolitan area | Employment (1) | Employment per thousand jobs | Location quotient (9) | Hourly mean wage | Annual mean wage (2) |
|---|---|---|---|---|---|
| New York-Newark-Jersey City, NY-NJ-PA | 15,060 | 1.74 | 1.04 | $ 67.79 | $ 141,010 |
| Boston-Cambridge-Nashua, MA-NH | 5,610 | 2.17 | 1.30 | $ 63.50 | $ 132,070 |
| Los Angeles-Long Beach-Anaheim, CA | 5,490 | 0.96 | 0.58 | $ 69.68 | $ 144,930 |
| Chicago-Naperville-Elgin, IL-IN-WI | 4,960 | 1.17 | 0.70 | $ 59.11 | $ 122,950 |
| Dallas-Fort Worth-Arlington, TX | 4,960 | 1.38 | 0.83 | $ 55.53 | $ 115,510 |
| Nashville-Davidson--Murfreesboro--Franklin, TN | 4,400 | 4.50 | 2.70 | $ 47.40 | $ 98,600 |
| Houston-The Woodlands-Sugar Land, TX | 3,810 | 1.31 | 0.79 | $ 59.53 | $ 123,810 |
| Philadelphia-Camden-Wilmington, PA-NJ-DE-MD | 3,800 | 1.43 | 0.86 | $ 58.35 | $ 121,370 |
| Miami-Fort Lauderdale-West Palm Beach, FL | 3,710 | 1.51 | 0.91 | $ 50.60 | $ 105,250 |
| Atlanta-Sandy Springs-Roswell, GA | 3,680 | 1.42 | 0.85 | $ 54.53 | $ 113,410 |
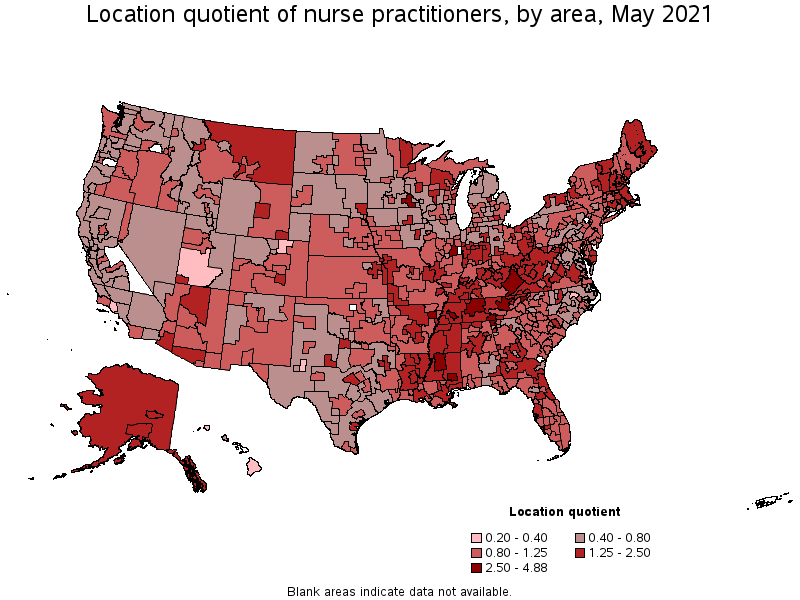
Metropolitan areas with the highest concentration of jobs and location quotients in Nurse Practitioners:
| Metropolitan area | Employment (1) | Employment per thousand jobs | Location quotient (9) | Hourly mean wage | Annual mean wage (2) |
|---|---|---|---|---|---|
| Rochester, MN | 940 | 8.13 | 4.88 | $ 61.29 | $ 127,490 |
| Jonesboro, AR | 320 | 5.70 | 3.42 | $ 50.04 | $ 104,070 |
| Johnson City, TN | 400 | 5.11 | 3.07 | $ 44.68 | $ 92,930 |
| Hattiesburg, MS | 310 | 5.04 | 3.02 | $ 51.97 | $ 108,100 |
| Nashville-Davidson--Murfreesboro--Franklin, TN | 4,400 | 4.50 | 2.70 | $ 47.40 | $ 98,600 |
| Jackson, MS | 1,090 | 4.46 | 2.68 | $ 54.39 | $ 113,120 |
| Chattanooga, TN-GA | 1,090 | 4.45 | 2.67 | $ 46.43 | $ 96,570 |
| Jackson, TN | 280 | 4.27 | 2.56 | $ 44.86 | $ 93,310 |
| Champaign-Urbana, IL | 410 | 4.22 | 2.53 | $ 57.11 | $ 118,780 |
| Knoxville, TN | 1,600 | 4.18 | 2.51 | $ 42.45 | $ 88,300 |
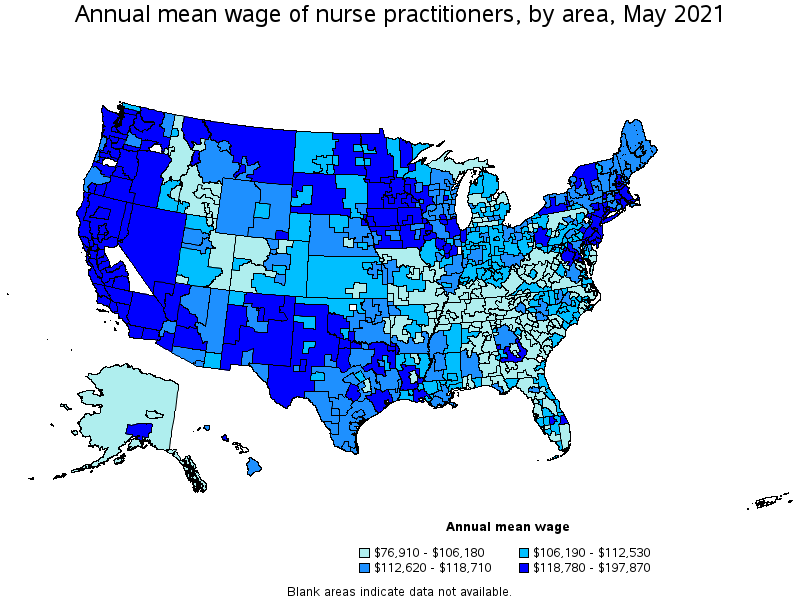
Top paying metropolitan areas for Nurse Practitioners:
| Metropolitan area | Employment (1) | Employment per thousand jobs | Location quotient (9) | Hourly mean wage | Annual mean wage (2) |
|---|---|---|---|---|---|
| San Jose-Sunnyvale-Santa Clara, CA | 1,220 | 1.14 | 0.69 | $ 95.13 | $ 197,870 |
| Napa, CA | 90 | 1.28 | 0.77 | $ 88.80 | $ 184,700 |
| Vallejo-Fairfield, CA | 130 | 0.98 | 0.59 | $ 86.72 | $ 180,380 |
| San Francisco-Oakland-Hayward, CA | 2,550 | 1.14 | 0.68 | $ 85.18 | $ 177,160 |
| Yuba City, CA | 30 | 0.73 | 0.44 | $ 76.57 | $ 159,260 |
| San Luis Obispo-Paso Robles-Arroyo Grande, CA | 140 | 1.23 | 0.74 | $ 73.70 | $ 153,300 |
| Sacramento--Roseville--Arden-Arcade, CA | 900 | 0.92 | 0.55 | $ 73.58 | $ 153,050 |
| Santa Rosa, CA | 180 | 0.93 | 0.56 | $ 73.15 | $ 152,150 |
| Santa Cruz-Watsonville, CA | 150 | 1.57 | 0.94 | $ 72.25 | $ 150,280 |
| Fresno, CA | 440 | 1.18 | 0.71 | $ 71.04 | $ 147,760 |
Nonmetropolitan areas with the highest employment in Nurse Practitioners:
| Nonmetropolitan area | Employment (1) | Employment per thousand jobs | Location quotient (9) | Hourly mean wage | Annual mean wage (2) |
|---|---|---|---|---|---|
| Northeast Mississippi nonmetropolitan area | 720 | 3.25 | 1.95 | $ 51.32 | $ 106,740 |
| Kansas nonmetropolitan area | 600 | 1.59 | 0.95 | $ 52.87 | $ 109,970 |
| West Tennessee nonmetropolitan area | 510 | 4.03 | 2.42 | $ 36.97 | $ 76,910 |
| Northeastern Wisconsin nonmetropolitan area | 490 | 2.59 | 1.55 | $ 55.23 | $ 114,880 |
| Southeast Mississippi nonmetropolitan area | 470 | 3.26 | 1.95 | $ 53.78 | $ 111,870 |
Nonmetropolitan areas with the highest concentration of jobs and location quotients in Nurse Practitioners:
| Nonmetropolitan area | Employment (1) | Employment per thousand jobs | Location quotient (9) | Hourly mean wage | Annual mean wage (2) |
|---|---|---|---|---|---|
| East Kentucky nonmetropolitan area | 420 | 4.38 | 2.63 | $ 47.41 | $ 98,620 |
| West Tennessee nonmetropolitan area | 510 | 4.03 | 2.42 | $ 36.97 | $ 76,910 |
| Northwest Mississippi nonmetropolitan area | 290 | 3.36 | 2.02 | $ 55.41 | $ 115,250 |
| Southeast Mississippi nonmetropolitan area | 470 | 3.26 | 1.95 | $ 53.78 | $ 111,870 |
| Northeast Mississippi nonmetropolitan area | 720 | 3.25 | 1.95 | $ 51.32 | $ 106,740 |
Top paying nonmetropolitan areas for Nurse Practitioners:
| Nonmetropolitan area | Employment (1) | Employment per thousand jobs | Location quotient (9) | Hourly mean wage | Annual mean wage (2) |
|---|---|---|---|---|---|
| North Valley-Northern Mountains Region of California nonmetropolitan area | 80 | 0.86 | 0.52 | $ 65.63 | $ 136,510 |
| North Coast Region of California nonmetropolitan area | 110 | 1.06 | 0.63 | $ 65.46 | $ 136,150 |
| Southeast Minnesota nonmetropolitan area | 170 | 1.16 | 0.70 | $ 62.19 | $ 129,340 |
| Middle Georgia nonmetropolitan area | 260 | 2.09 | 1.25 | $ 62.12 | $ 129,210 |
| Connecticut nonmetropolitan area | 60 | 2.06 | 1.24 | $ 62.01 | $ 128,980 |
These estimates are calculated with data collected from employers in all industry sectors, all metropolitan and nonmetropolitan areas, and all states and the District of Columbia. The top employment and wage figures are provided above. The complete list is available in the downloadable XLS files.
The percentile wage estimate is the value of a wage below which a certain percent of workers fall. The median wage is the 50th percentile wage estimate—50 percent of workers earn less than the median and 50 percent of workers earn more than the median. More about percentile wages.
(1) Estimates for detailed occupations do not sum to the totals because the totals include occupations not shown separately. Estimates do not include self-employed workers.
(2) Annual wages have been calculated by multiplying the hourly mean wage by a "year-round, full-time" hours figure of 2,080 hours; for those occupations where there is not an hourly wage published, the annual wage has been directly calculated from the reported survey data.
(3) The relative standard error (RSE) is a measure of the reliability of a survey statistic. The smaller the relative standard error, the more precise the estimate.
(9) The location quotient is the ratio of the area concentration of occupational employment to the national average concentration. A location quotient greater than one indicates the occupation has a higher share of employment than average, and a location quotient less than one indicates the occupation is less prevalent in the area than average.
Other OEWS estimates and related information:
May 2021 National Occupational Employment and Wage Estimates
May 2021 State Occupational Employment and Wage Estimates
May 2021 Metropolitan and Nonmetropolitan Area Occupational Employment and Wage Estimates
May 2021 National Industry-Specific Occupational Employment and Wage Estimates
Last Modified Date: March 31, 2022