
An official website of the United States government
An official website of the United States government
The .gov means it's official.
Federal government websites often end in .gov or .mil. Before sharing sensitive information,
make sure you're on a federal government site.
The site is secure.
The
https:// ensures that you are connecting to the official website and that any
information you provide is encrypted and transmitted securely.
Make immediate medical decisions and act to prevent death or further disability. Provide immediate recognition, evaluation, care, stabilization, and disposition of patients. May direct emergency medical staff in an emergency department.
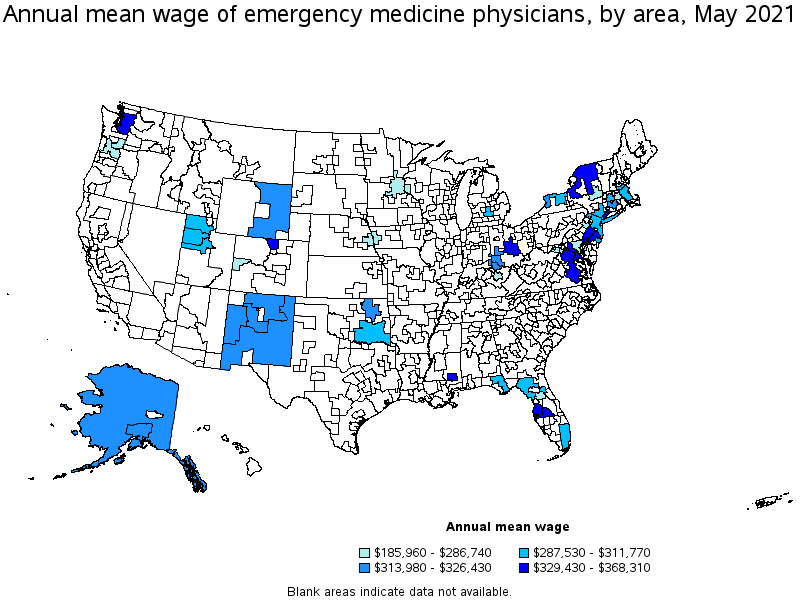
Employment estimate and mean wage estimates for Emergency Medicine Physicians:
| Employment (1) | Employment RSE (3) |
Mean hourly wage |
Mean annual wage (2) |
Wage RSE (3) |
|---|---|---|---|---|
| 36,180 | 8.9 % | $ 149.35 | $ 310,640 | 2.2 % |
Percentile wage estimates for Emergency Medicine Physicians:
| Percentile | 10% | 25% | 50% (Median) |
75% | 90% |
|---|---|---|---|---|---|
| Hourly Wage | $ 49.67 | (5) | (5) | (5) | (5) |
| Annual Wage (2) | $ 103,310 | (5) | (5) | (5) | (5) |
Industries with the highest published employment and wages for Emergency Medicine Physicians are provided. For a list of all industries with employment in Emergency Medicine Physicians, see the Create Customized Tables function.
Industries with the highest levels of employment in Emergency Medicine Physicians:
| Industry | Employment (1) | Percent of industry employment | Hourly mean wage | Annual mean wage (2) |
|---|---|---|---|---|
| Offices of Physicians | 22,740 | 0.84 | (5) | (5) |
| General Medical and Surgical Hospitals | 9,650 | 0.17 | $ 133.71 | $ 278,120 |
| Outpatient Care Centers | 2,680 | 0.27 | $ 161.55 | $ 336,030 |
| Colleges, Universities, and Professional Schools | 390 | 0.01 | $ 33.94 | $ 70,600 |
| Offices of Other Health Practitioners | 210 | 0.02 | $ 148.48 | $ 308,830 |
Industries with the highest concentration of employment in Emergency Medicine Physicians:
| Industry | Employment (1) | Percent of industry employment | Hourly mean wage | Annual mean wage (2) |
|---|---|---|---|---|
| Offices of Physicians | 22,740 | 0.84 | (5) | (5) |
| Outpatient Care Centers | 2,680 | 0.27 | $ 161.55 | $ 336,030 |
| General Medical and Surgical Hospitals | 9,650 | 0.17 | $ 133.71 | $ 278,120 |
| Specialty (except Psychiatric and Substance Abuse) Hospitals | 100 | 0.04 | $ 133.66 | $ 278,010 |
| Other Ambulatory Health Care Services | 80 | 0.03 | $ 121.19 | $ 252,080 |
Top paying industries for Emergency Medicine Physicians:
| Industry | Employment (1) | Percent of industry employment | Hourly mean wage | Annual mean wage (2) |
|---|---|---|---|---|
| Offices of Physicians | 22,740 | 0.84 | (5) | (5) |
| Outpatient Care Centers | 2,680 | 0.27 | $ 161.55 | $ 336,030 |
| Offices of Other Health Practitioners | 210 | 0.02 | $ 148.48 | $ 308,830 |
| Local Government, excluding schools and hospitals (OEWS Designation) | 60 | (7) | $ 136.38 | $ 283,670 |
| General Medical and Surgical Hospitals | 9,650 | 0.17 | $ 133.71 | $ 278,120 |
States and areas with the highest published employment, location quotients, and wages for Emergency Medicine Physicians are provided. For a list of all areas with employment in Emergency Medicine Physicians, see the Create Customized Tables function.
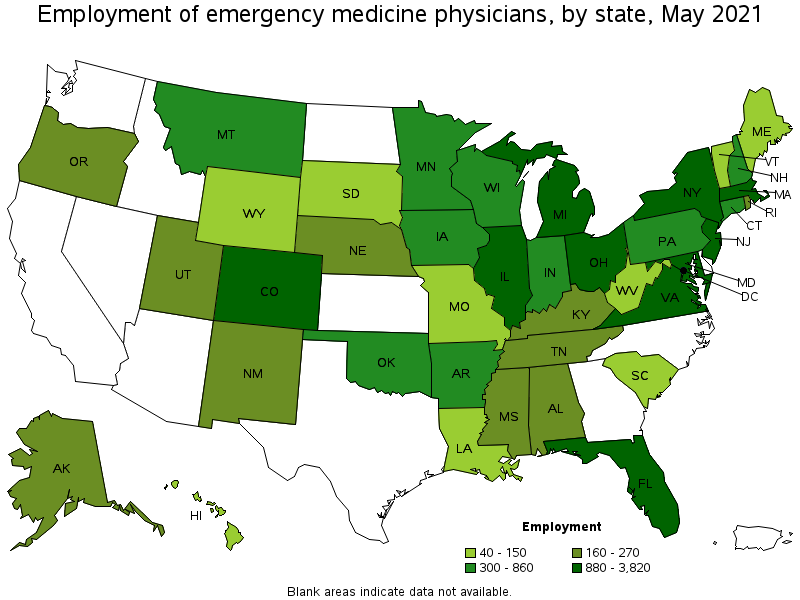
States with the highest employment level in Emergency Medicine Physicians:
| State | Employment (1) | Employment per thousand jobs | Location quotient (9) | Hourly mean wage | Annual mean wage (2) |
|---|---|---|---|---|---|
| New York | 3,820 | 0.44 | 1.72 | $ 134.42 | $ 279,590 |
| Florida | 2,490 | 0.29 | 1.13 | $ 150.76 | $ 313,590 |
| New Jersey | 1,890 | 0.49 | 1.91 | (5) | (5) |
| Michigan | 1,890 | 0.46 | 1.81 | $ 170.51 | $ 354,650 |
| Virginia | 1,440 | 0.38 | 1.49 | $ 163.51 | $ 340,100 |
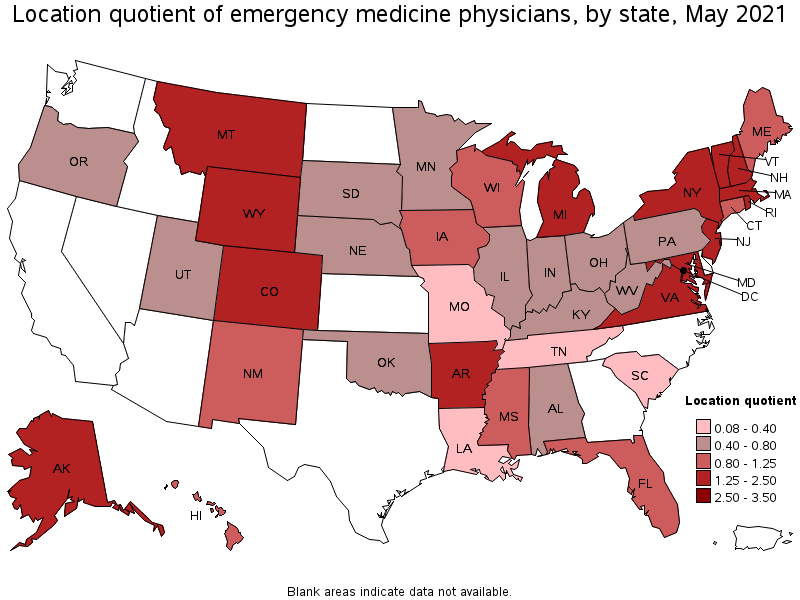
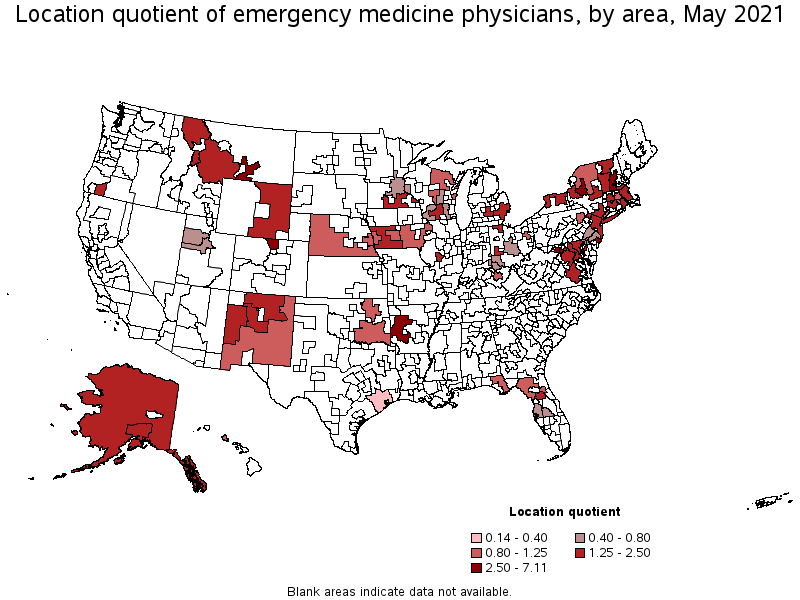
States with the highest concentration of jobs and location quotients in Emergency Medicine Physicians:
| State | Employment (1) | Employment per thousand jobs | Location quotient (9) | Hourly mean wage | Annual mean wage (2) |
|---|---|---|---|---|---|
| Montana | 300 | 0.64 | 2.49 | (5) | (5) |
| Alaska | 170 | 0.56 | 2.20 | $ 155.35 | $ 323,130 |
| New Hampshire | 360 | 0.56 | 2.18 | (5) | (5) |
| Arkansas | 600 | 0.50 | 1.95 | $ 165.21 | $ 343,650 |
| New Jersey | 1,890 | 0.49 | 1.91 | (5) | (5) |
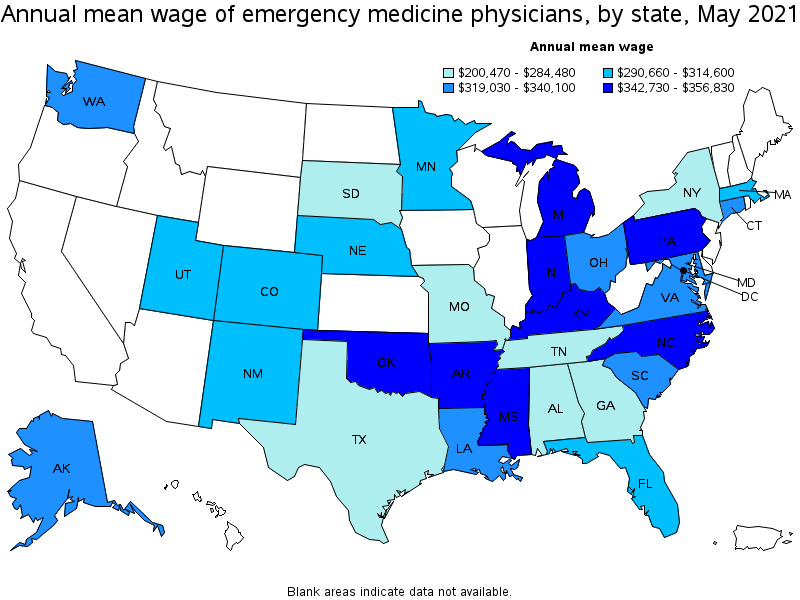
Top paying states for Emergency Medicine Physicians:
| State | Employment (1) | Employment per thousand jobs | Location quotient (9) | Hourly mean wage | Annual mean wage (2) |
|---|---|---|---|---|---|
| Arizona | (8) | (8) | (8) | (5) | (5) |
| California | (8) | (8) | (8) | (5) | (5) |
| Hawaii | 130 | 0.24 | 0.92 | (5) | (5) |
| Idaho | (8) | (8) | (8) | (5) | (5) |
| Illinois | 1,090 | 0.19 | 0.75 | (5) | (5) |
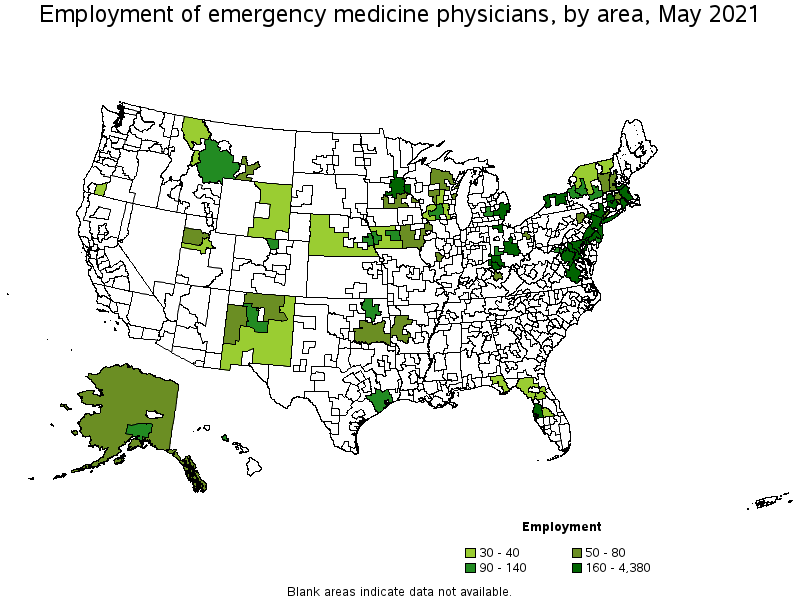
Metropolitan areas with the highest employment level in Emergency Medicine Physicians:
| Metropolitan area | Employment (1) | Employment per thousand jobs | Location quotient (9) | Hourly mean wage | Annual mean wage (2) |
|---|---|---|---|---|---|
| New York-Newark-Jersey City, NY-NJ-PA | 4,380 | 0.50 | 1.96 | $ 145.95 | $ 303,570 |
| Washington-Arlington-Alexandria, DC-VA-MD-WV | 1,010 | 0.34 | 1.34 | $ 165.31 | $ 343,850 |
| Boston-Cambridge-Nashua, MA-NH | 890 | 0.35 | 1.35 | $ 149.89 | $ 311,770 |
| Detroit-Warren-Dearborn, MI | 700 | 0.39 | 1.50 | (5) | (5) |
| Baltimore-Columbia-Towson, MD | 600 | 0.47 | 1.85 | $ 137.86 | $ 286,740 |
| Philadelphia-Camden-Wilmington, PA-NJ-DE-MD | 380 | 0.14 | 0.56 | $ 177.07 | $ 368,310 |
| Richmond, VA | 360 | 0.59 | 2.28 | $ 171.70 | $ 357,130 |
| Minneapolis-St. Paul-Bloomington, MN-WI | 330 | 0.18 | 0.71 | $ 133.64 | $ 277,970 |
| Hartford-West Hartford-East Hartford, CT | 240 | 0.44 | 1.72 | $ 154.00 | $ 320,320 |
| Rochester, NY | 230 | 0.48 | 1.86 | $ 139.77 | $ 290,720 |
Metropolitan areas with the highest concentration of jobs and location quotients in Emergency Medicine Physicians:
| Metropolitan area | Employment (1) | Employment per thousand jobs | Location quotient (9) | Hourly mean wage | Annual mean wage (2) |
|---|---|---|---|---|---|
| Winchester, VA-WV | 110 | 1.83 | 7.11 | $ 133.19 | $ 277,030 |
| Atlantic City-Hammonton, NJ | 100 | 0.90 | 3.49 | $ 147.97 | $ 307,780 |
| Fort Collins, CO | 140 | 0.88 | 3.41 | $ 164.17 | $ 341,480 |
| Billings, MT | 70 | 0.78 | 3.03 | (5) | (5) |
| Utica-Rome, NY | 90 | 0.74 | 2.89 | (5) | (5) |
| Toledo, OH | 170 | 0.63 | 2.44 | (8) | (8) |
| Richmond, VA | 360 | 0.59 | 2.28 | $ 171.70 | $ 357,130 |
| Springfield, MA-CT | 170 | 0.56 | 2.19 | $ 139.38 | $ 289,910 |
| Anchorage, AK | 90 | 0.56 | 2.18 | $ 154.90 | $ 322,190 |
| New York-Newark-Jersey City, NY-NJ-PA | 4,380 | 0.50 | 1.96 | $ 145.95 | $ 303,570 |
Top paying metropolitan areas for Emergency Medicine Physicians:
| Metropolitan area | Employment (1) | Employment per thousand jobs | Location quotient (9) | Hourly mean wage | Annual mean wage (2) |
|---|---|---|---|---|---|
| Billings, MT | 70 | 0.78 | 3.03 | (5) | (5) |
| Canton-Massillon, OH | 50 | 0.30 | 1.17 | (5) | (5) |
| Chicago-Naperville-Elgin, IL-IN-WI | (8) | (8) | (8) | (5) | (5) |
| Des Moines-West Des Moines, IA | 90 | 0.25 | 0.97 | (5) | (5) |
| Detroit-Warren-Dearborn, MI | 700 | 0.39 | 1.50 | (5) | (5) |
| Grand Rapids-Wyoming, MI | (8) | (8) | (8) | (5) | (5) |
| Jacksonville, FL | (8) | (8) | (8) | (5) | (5) |
| Los Angeles-Long Beach-Anaheim, CA | (8) | (8) | (8) | (5) | (5) |
| Madison, WI | 140 | 0.37 | 1.45 | (5) | (5) |
| Medford, OR | 40 | 0.46 | 1.77 | (5) | (5) |
Nonmetropolitan areas with the highest employment in Emergency Medicine Physicians:
| Nonmetropolitan area | Employment (1) | Employment per thousand jobs | Location quotient (9) | Hourly mean wage | Annual mean wage (2) |
|---|---|---|---|---|---|
| Southwest Montana nonmetropolitan area | 90 | 0.62 | 2.42 | (5) | (5) |
| West Arkansas nonmetropolitan area | 80 | 0.95 | 3.69 | (5) | (5) |
| West Central-Southwest New Hampshire nonmetropolitan area | 70 | 0.77 | 3.00 | (5) | (5) |
| Southeast Iowa nonmetropolitan area | 60 | 0.27 | 1.06 | (5) | (5) |
| Southern Vermont nonmetropolitan area | 60 | 0.57 | 2.24 | (5) | (5) |
Nonmetropolitan areas with the highest concentration of jobs and location quotients in Emergency Medicine Physicians:
| Nonmetropolitan area | Employment (1) | Employment per thousand jobs | Location quotient (9) | Hourly mean wage | Annual mean wage (2) |
|---|---|---|---|---|---|
| West Arkansas nonmetropolitan area | 80 | 0.95 | 3.69 | (5) | (5) |
| West Central-Southwest New Hampshire nonmetropolitan area | 70 | 0.77 | 3.00 | (5) | (5) |
| Northern New Mexico nonmetropolitan area | 50 | 0.63 | 2.46 | $ 150.95 | $ 313,980 |
| Southwest Montana nonmetropolitan area | 90 | 0.62 | 2.42 | (5) | (5) |
| Southern Vermont nonmetropolitan area | 60 | 0.57 | 2.24 | (5) | (5) |
Top paying nonmetropolitan areas for Emergency Medicine Physicians:
| Nonmetropolitan area | Employment (1) | Employment per thousand jobs | Location quotient (9) | Hourly mean wage | Annual mean wage (2) |
|---|---|---|---|---|---|
| West Arkansas nonmetropolitan area | 80 | 0.95 | 3.69 | (5) | (5) |
| Southwest Iowa nonmetropolitan area | 40 | 0.55 | 2.14 | (5) | (5) |
| Southeast Iowa nonmetropolitan area | 60 | 0.27 | 1.06 | (5) | (5) |
| Upper Peninsula of Michigan nonmetropolitan area | (8) | (8) | (8) | (5) | (5) |
| Southeast Minnesota nonmetropolitan area | 50 | 0.33 | 1.27 | (5) | (5) |
These estimates are calculated with data collected from employers in all industry sectors, all metropolitan and nonmetropolitan areas, and all states and the District of Columbia. The top employment and wage figures are provided above. The complete list is available in the downloadable XLS files.
The percentile wage estimate is the value of a wage below which a certain percent of workers fall. The median wage is the 50th percentile wage estimate—50 percent of workers earn less than the median and 50 percent of workers earn more than the median. More about percentile wages.
(1) Estimates for detailed occupations do not sum to the totals because the totals include occupations not shown separately. Estimates do not include self-employed workers.
(2) Annual wages have been calculated by multiplying the hourly mean wage by a "year-round, full-time" hours figure of 2,080 hours; for those occupations where there is not an hourly wage published, the annual wage has been directly calculated from the reported survey data.
(3) The relative standard error (RSE) is a measure of the reliability of a survey statistic. The smaller the relative standard error, the more precise the estimate.
(5) This wage is equal to or greater than $100.00 per hour or $208,000 per year.
(7) The value is less than .005 percent of industry employment.
(8) Estimate not released.
(9) The location quotient is the ratio of the area concentration of occupational employment to the national average concentration. A location quotient greater than one indicates the occupation has a higher share of employment than average, and a location quotient less than one indicates the occupation is less prevalent in the area than average.
Other OEWS estimates and related information:
May 2021 National Occupational Employment and Wage Estimates
May 2021 State Occupational Employment and Wage Estimates
May 2021 Metropolitan and Nonmetropolitan Area Occupational Employment and Wage Estimates
May 2021 National Industry-Specific Occupational Employment and Wage Estimates
Last Modified Date: March 31, 2022