
An official website of the United States government
An official website of the United States government
The .gov means it's official.
Federal government websites often end in .gov or .mil. Before sharing sensitive information,
make sure you're on a federal government site.
The site is secure.
The
https:// ensures that you are connecting to the official website and that any
information you provide is encrypted and transmitted securely.
Provide medical care related to pregnancy or childbirth. Diagnose, treat, and help prevent diseases of women, particularly those affecting the reproductive system. May also provide general care to women. May perform both medical and gynecological surgery functions.
Employment estimate and mean wage estimates for Obstetricians and Gynecologists:
| Employment (1) | Employment RSE (3) |
Mean hourly wage |
Mean annual wage (2) |
Wage RSE (3) |
|---|---|---|---|---|
| 21,570 | 10.1 % | $ 142.41 | $ 296,210 | 2.2 % |
Percentile wage estimates for Obstetricians and Gynecologists:
| Percentile | 10% | 25% | 50% (Median) |
75% | 90% |
|---|---|---|---|---|---|
| Hourly Wage | $ 48.67 | $ 95.33 | (5) | (5) | (5) |
| Annual Wage (2) | $ 101,240 | $ 198,290 | (5) | (5) | (5) |
Industries with the highest published employment and wages for Obstetricians and Gynecologists are provided. For a list of all industries with employment in Obstetricians and Gynecologists, see the Create Customized Tables function.
Industries with the highest levels of employment in Obstetricians and Gynecologists:
| Industry | Employment (1) | Percent of industry employment | Hourly mean wage | Annual mean wage (2) |
|---|---|---|---|---|
| Offices of Physicians | 15,640 | 0.58 | $ 148.66 | $ 309,210 |
| Outpatient Care Centers | 1,060 | 0.11 | $ 139.58 | $ 290,320 |
| Colleges, Universities, and Professional Schools | 310 | 0.01 | $ 45.51 | $ 94,650 |
| Local Government, excluding schools and hospitals (OEWS Designation) | 40 | 0.00 | (5) | (5) |
Industries with the highest concentration of employment in Obstetricians and Gynecologists:
| Industry | Employment (1) | Percent of industry employment | Hourly mean wage | Annual mean wage (2) |
|---|---|---|---|---|
| Offices of Physicians | 15,640 | 0.58 | $ 148.66 | $ 309,210 |
| Outpatient Care Centers | 1,060 | 0.11 | $ 139.58 | $ 290,320 |
| Colleges, Universities, and Professional Schools | 310 | 0.01 | $ 45.51 | $ 94,650 |
| Local Government, excluding schools and hospitals (OEWS Designation) | 40 | 0.00 | (5) | (5) |
Top paying industries for Obstetricians and Gynecologists:
| Industry | Employment (1) | Percent of industry employment | Hourly mean wage | Annual mean wage (2) |
|---|---|---|---|---|
| Local Government, excluding schools and hospitals (OEWS Designation) | 40 | (7) | (5) | (5) |
| Offices of Physicians | 15,640 | 0.58 | $ 148.66 | $ 309,210 |
| Outpatient Care Centers | 1,060 | 0.11 | $ 139.58 | $ 290,320 |
| General Medical and Surgical Hospitals | (8) | (8) | $ 128.92 | $ 268,150 |
| Colleges, Universities, and Professional Schools | 310 | 0.01 | $ 45.51 | $ 94,650 |
States and areas with the highest published employment, location quotients, and wages for Obstetricians and Gynecologists are provided. For a list of all areas with employment in Obstetricians and Gynecologists, see the Create Customized Tables function.
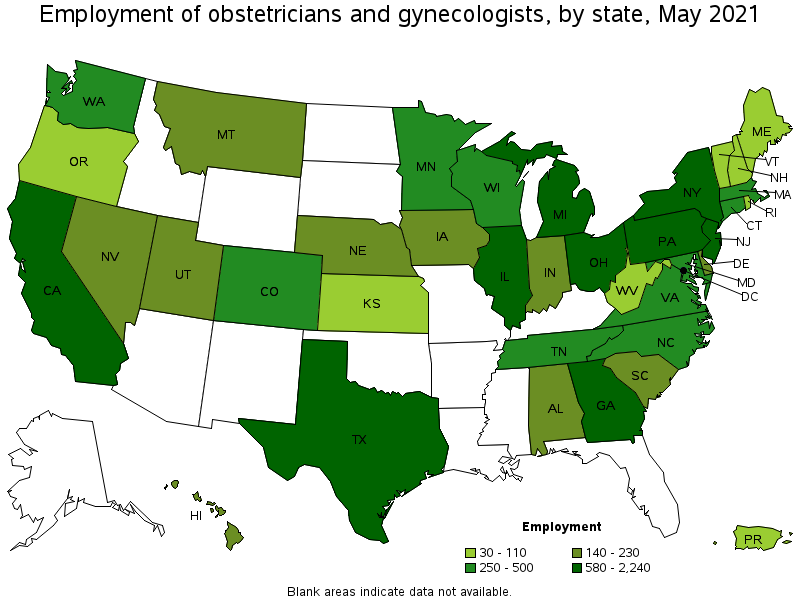
States with the highest employment level in Obstetricians and Gynecologists:
| State | Employment (1) | Employment per thousand jobs | Location quotient (9) | Hourly mean wage | Annual mean wage (2) |
|---|---|---|---|---|---|
| New York | 2,240 | 0.26 | 1.69 | $ 127.12 | $ 264,400 |
| California | 2,220 | 0.13 | 0.88 | $ 148.85 | $ 309,610 |
| New Jersey | 2,050 | 0.53 | 3.47 | (5) | (5) |
| Texas | 1,830 | 0.15 | 0.98 | $ 140.65 | $ 292,560 |
| Georgia | 930 | 0.21 | 1.38 | $ 153.51 | $ 319,300 |
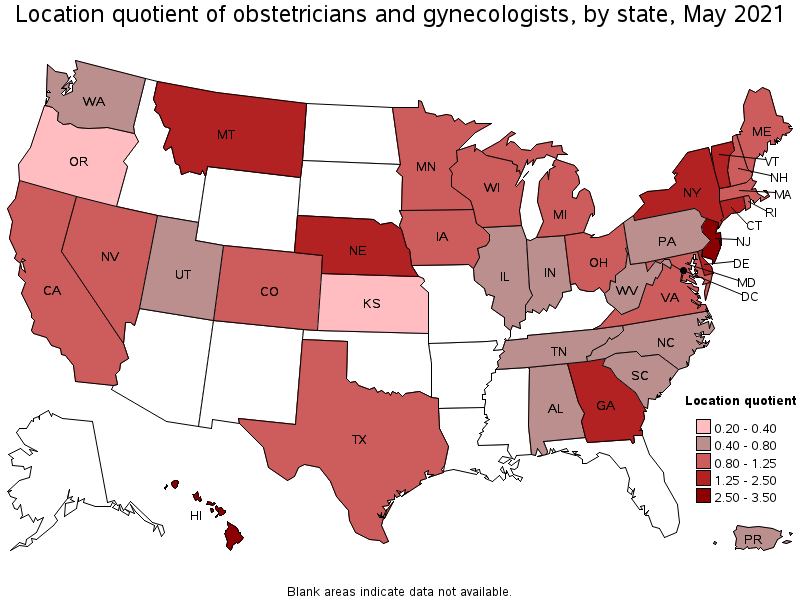
States with the highest concentration of jobs and location quotients in Obstetricians and Gynecologists:
| State | Employment (1) | Employment per thousand jobs | Location quotient (9) | Hourly mean wage | Annual mean wage (2) |
|---|---|---|---|---|---|
| New Jersey | 2,050 | 0.53 | 3.47 | (5) | (5) |
| Hawaii | 210 | 0.38 | 2.51 | $ 119.27 | $ 248,080 |
| Delaware | 160 | 0.36 | 2.37 | $ 169.56 | $ 352,680 |
| Montana | 140 | 0.30 | 1.97 | $ 164.64 | $ 342,450 |
| New York | 2,240 | 0.26 | 1.69 | $ 127.12 | $ 264,400 |
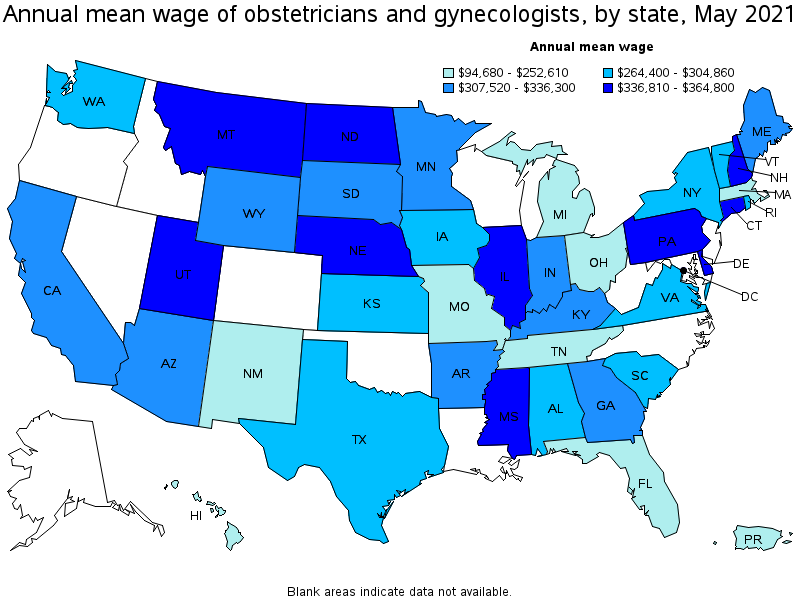
Top paying states for Obstetricians and Gynecologists:
| State | Employment (1) | Employment per thousand jobs | Location quotient (9) | Hourly mean wage | Annual mean wage (2) |
|---|---|---|---|---|---|
| Colorado | 470 | 0.18 | 1.17 | (5) | (5) |
| Maryland | 420 | 0.17 | 1.08 | (5) | (5) |
| Nevada | 170 | 0.13 | 0.87 | (5) | (5) |
| New Jersey | 2,050 | 0.53 | 3.47 | (5) | (5) |
| North Carolina | 480 | 0.11 | 0.71 | (5) | (5) |
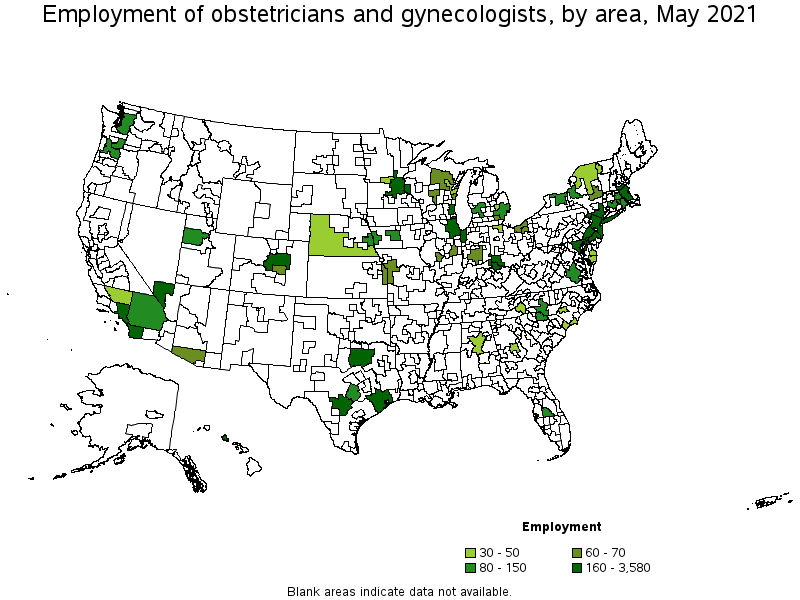
Metropolitan areas with the highest employment level in Obstetricians and Gynecologists:
| Metropolitan area | Employment (1) | Employment per thousand jobs | Location quotient (9) | Hourly mean wage | Annual mean wage (2) |
|---|---|---|---|---|---|
| New York-Newark-Jersey City, NY-NJ-PA | 3,580 | 0.41 | 2.70 | $ 132.09 | $ 274,740 |
| Los Angeles-Long Beach-Anaheim, CA | 1,120 | 0.20 | 1.28 | $ 133.63 | $ 277,960 |
| Dallas-Fort Worth-Arlington, TX | 670 | 0.19 | 1.22 | $ 157.97 | $ 328,570 |
| San Antonio-New Braunfels, TX | 390 | 0.39 | 2.55 | $ 127.03 | $ 264,220 |
| Philadelphia-Camden-Wilmington, PA-NJ-DE-MD | 380 | 0.14 | 0.94 | $ 172.03 | $ 357,820 |
| Denver-Aurora-Lakewood, CO | 320 | 0.22 | 1.44 | (5) | (5) |
| Chicago-Naperville-Elgin, IL-IN-WI | 310 | 0.07 | 0.48 | (5) | (5) |
| Boston-Cambridge-Nashua, MA-NH | 290 | 0.11 | 0.73 | $ 146.09 | $ 303,870 |
| Minneapolis-St. Paul-Bloomington, MN-WI | 280 | 0.16 | 1.01 | $ 141.63 | $ 294,600 |
| Houston-The Woodlands-Sugar Land, TX | 270 | 0.09 | 0.62 | $ 105.76 | $ 219,980 |
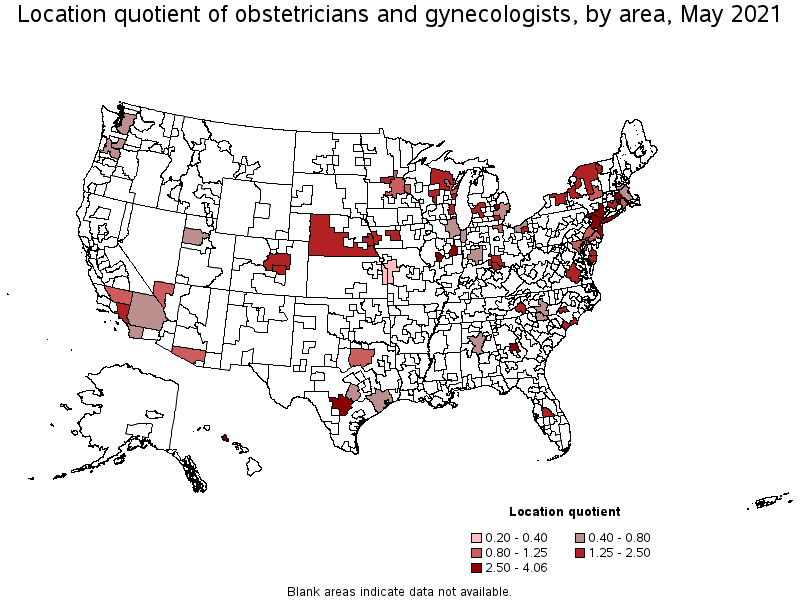
Metropolitan areas with the highest concentration of jobs and location quotients in Obstetricians and Gynecologists:
| Metropolitan area | Employment (1) | Employment per thousand jobs | Location quotient (9) | Hourly mean wage | Annual mean wage (2) |
|---|---|---|---|---|---|
| Springfield, IL | 60 | 0.62 | 4.06 | $ 162.55 | $ 338,100 |
| Champaign-Urbana, IL | 60 | 0.61 | 4.01 | $ 171.81 | $ 357,370 |
| Worcester, MA-CT | 150 | 0.55 | 3.60 | (8) | (8) |
| Macon, GA | 50 | 0.50 | 3.25 | $ 146.58 | $ 304,890 |
| Urban Honolulu, HI | 170 | 0.42 | 2.76 | $ 103.40 | $ 215,070 |
| New York-Newark-Jersey City, NY-NJ-PA | 3,580 | 0.41 | 2.70 | $ 132.09 | $ 274,740 |
| Flint, MI | 50 | 0.41 | 2.66 | $ 87.86 | $ 182,740 |
| San Antonio-New Braunfels, TX | 390 | 0.39 | 2.55 | $ 127.03 | $ 264,220 |
| Fayetteville, NC | 50 | 0.37 | 2.44 | (5) | (5) |
| St. Cloud, MN | 30 | 0.35 | 2.29 | $ 151.68 | $ 315,500 |
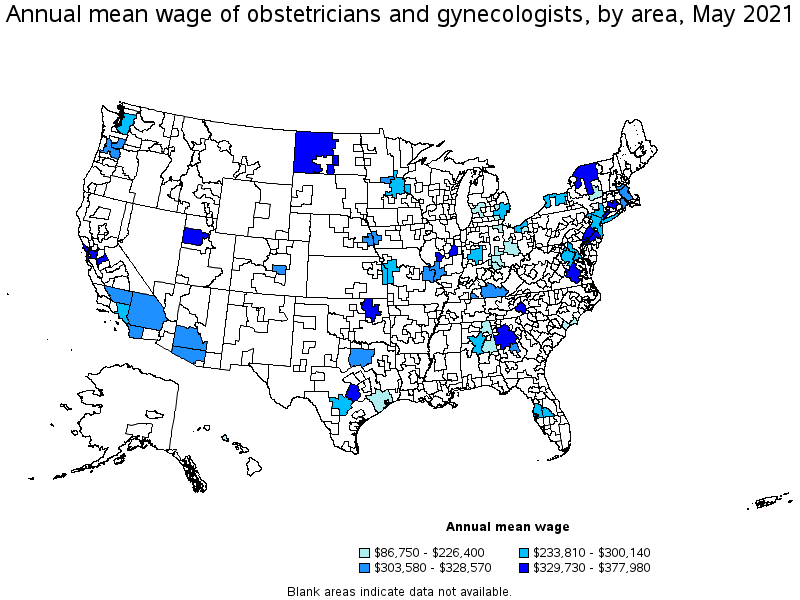
Top paying metropolitan areas for Obstetricians and Gynecologists:
| Metropolitan area | Employment (1) | Employment per thousand jobs | Location quotient (9) | Hourly mean wage | Annual mean wage (2) |
|---|---|---|---|---|---|
| Baltimore-Columbia-Towson, MD | 170 | 0.13 | 0.88 | (5) | (5) |
| Charlotte-Concord-Gastonia, NC-SC | 120 | 0.10 | 0.65 | (5) | (5) |
| Chicago-Naperville-Elgin, IL-IN-WI | 310 | 0.07 | 0.48 | (5) | (5) |
| Denver-Aurora-Lakewood, CO | 320 | 0.22 | 1.44 | (5) | (5) |
| Des Moines-West Des Moines, IA | 80 | 0.22 | 1.45 | (5) | (5) |
| Fayetteville, NC | 50 | 0.37 | 2.44 | (5) | (5) |
| Green Bay, WI | 30 | 0.18 | 1.20 | (5) | (5) |
| Greensboro-High Point, NC | (8) | (8) | (8) | (5) | (5) |
| Las Vegas-Henderson-Paradise, NV | 160 | 0.17 | 1.12 | (5) | (5) |
| Louisville/Jefferson County, KY-IN | (8) | (8) | (8) | (5) | (5) |
Nonmetropolitan areas with the highest employment in Obstetricians and Gynecologists:
| Nonmetropolitan area | Employment (1) | Employment per thousand jobs | Location quotient (9) | Hourly mean wage | Annual mean wage (2) |
|---|---|---|---|---|---|
| Northeastern Wisconsin nonmetropolitan area | 70 | 0.37 | 2.44 | (5) | (5) |
| South Nebraska nonmetropolitan area | 30 | 0.23 | 1.51 | (5) | (5) |
| Capital/Northern New York nonmetropolitan area | 30 | 0.22 | 1.47 | $ 158.53 | $ 329,730 |
Nonmetropolitan areas with the highest concentration of jobs and location quotients in Obstetricians and Gynecologists:
| Nonmetropolitan area | Employment (1) | Employment per thousand jobs | Location quotient (9) | Hourly mean wage | Annual mean wage (2) |
|---|---|---|---|---|---|
| Northeastern Wisconsin nonmetropolitan area | 70 | 0.37 | 2.44 | (5) | (5) |
| South Nebraska nonmetropolitan area | 30 | 0.23 | 1.51 | (5) | (5) |
| Capital/Northern New York nonmetropolitan area | 30 | 0.22 | 1.47 | $ 158.53 | $ 329,730 |
Top paying nonmetropolitan areas for Obstetricians and Gynecologists:
| Nonmetropolitan area | Employment (1) | Employment per thousand jobs | Location quotient (9) | Hourly mean wage | Annual mean wage (2) |
|---|---|---|---|---|---|
| South Nebraska nonmetropolitan area | 30 | 0.23 | 1.51 | (5) | (5) |
| Northeastern Wisconsin nonmetropolitan area | 70 | 0.37 | 2.44 | (5) | (5) |
| West North Dakota nonmetropolitan area | (8) | (8) | (8) | $ 170.68 | $ 355,010 |
| Capital/Northern New York nonmetropolitan area | 30 | 0.22 | 1.47 | $ 158.53 | $ 329,730 |
| South Central Kentucky nonmetropolitan area | (8) | (8) | (8) | $ 157.81 | $ 328,240 |
These estimates are calculated with data collected from employers in all industry sectors, all metropolitan and nonmetropolitan areas, and all states and the District of Columbia. The top employment and wage figures are provided above. The complete list is available in the downloadable XLS files.
The percentile wage estimate is the value of a wage below which a certain percent of workers fall. The median wage is the 50th percentile wage estimate—50 percent of workers earn less than the median and 50 percent of workers earn more than the median. More about percentile wages.
(1) Estimates for detailed occupations do not sum to the totals because the totals include occupations not shown separately. Estimates do not include self-employed workers.
(2) Annual wages have been calculated by multiplying the hourly mean wage by a "year-round, full-time" hours figure of 2,080 hours; for those occupations where there is not an hourly wage published, the annual wage has been directly calculated from the reported survey data.
(3) The relative standard error (RSE) is a measure of the reliability of a survey statistic. The smaller the relative standard error, the more precise the estimate.
(5) This wage is equal to or greater than $100.00 per hour or $208,000 per year.
(7) The value is less than .005 percent of industry employment.
(8) Estimate not released.
(9) The location quotient is the ratio of the area concentration of occupational employment to the national average concentration. A location quotient greater than one indicates the occupation has a higher share of employment than average, and a location quotient less than one indicates the occupation is less prevalent in the area than average.
Other OEWS estimates and related information:
May 2021 National Occupational Employment and Wage Estimates
May 2021 State Occupational Employment and Wage Estimates
May 2021 Metropolitan and Nonmetropolitan Area Occupational Employment and Wage Estimates
May 2021 National Industry-Specific Occupational Employment and Wage Estimates
Last Modified Date: March 31, 2022