
An official website of the United States government
An official website of the United States government
The .gov means it's official.
Federal government websites often end in .gov or .mil. Before sharing sensitive information,
make sure you're on a federal government site.
The site is secure.
The
https:// ensures that you are connecting to the official website and that any
information you provide is encrypted and transmitted securely.
Diagnose and perform surgery to treat and help prevent disorders and diseases of the eye. May also provide vision services for treatment including glasses and contacts. Excludes �Optometrists� (29-1041) and �Pediatric Surgeons� (29-1243).
Employment estimate and mean wage estimates for Ophthalmologists, Except Pediatric:
| Employment (1) | Employment RSE (3) |
Mean hourly wage |
Mean annual wage (2) |
Wage RSE (3) |
|---|---|---|---|---|
| 11,610 | 20.4 % | $ 129.85 | $ 270,090 | 10.5 % |
Percentile wage estimates for Ophthalmologists, Except Pediatric:
| Percentile | 10% | 25% | 50% (Median) |
75% | 90% |
|---|---|---|---|---|---|
| Hourly Wage | $ 48.53 | $ 79.51 | (5) | (5) | (5) |
| Annual Wage (2) | $ 100,940 | $ 165,380 | (5) | (5) | (5) |
Industries with the highest published employment and wages for Ophthalmologists, Except Pediatric are provided. For a list of all industries with employment in Ophthalmologists, Except Pediatric, see the Create Customized Tables function.
Industries with the highest levels of employment in Ophthalmologists, Except Pediatric:
| Industry | Employment (1) | Percent of industry employment | Hourly mean wage | Annual mean wage (2) |
|---|---|---|---|---|
| Offices of Physicians | 9,410 | 0.35 | $ 135.34 | $ 281,500 |
| General Medical and Surgical Hospitals | 820 | 0.01 | $ 113.62 | $ 236,330 |
| Offices of Other Health Practitioners | 700 | 0.07 | $ 91.68 | $ 190,700 |
| Outpatient Care Centers | 210 | 0.02 | $ 157.14 | $ 326,840 |
| Merchant Wholesalers, Nondurable Goods (4242 and 4246 only) | 210 | 0.05 | (8) | (8) |
Industries with the highest concentration of employment in Ophthalmologists, Except Pediatric:
| Industry | Employment (1) | Percent of industry employment | Hourly mean wage | Annual mean wage (2) |
|---|---|---|---|---|
| Offices of Physicians | 9,410 | 0.35 | $ 135.34 | $ 281,500 |
| Offices of Other Health Practitioners | 700 | 0.07 | $ 91.68 | $ 190,700 |
| Merchant Wholesalers, Nondurable Goods (4242 and 4246 only) | 210 | 0.05 | (8) | (8) |
| Outpatient Care Centers | 210 | 0.02 | $ 157.14 | $ 326,840 |
| General Medical and Surgical Hospitals | 820 | 0.01 | $ 113.62 | $ 236,330 |
Top paying industries for Ophthalmologists, Except Pediatric:
| Industry | Employment (1) | Percent of industry employment | Hourly mean wage | Annual mean wage (2) |
|---|---|---|---|---|
| Outpatient Care Centers | 210 | 0.02 | $ 157.14 | $ 326,840 |
| Offices of Physicians | 9,410 | 0.35 | $ 135.34 | $ 281,500 |
| General Medical and Surgical Hospitals | 820 | 0.01 | $ 113.62 | $ 236,330 |
| Offices of Other Health Practitioners | 700 | 0.07 | $ 91.68 | $ 190,700 |
| Other Professional, Scientific, and Technical Services | (8) | (8) | $ 55.58 | $ 115,600 |
States and areas with the highest published employment, location quotients, and wages for Ophthalmologists, Except Pediatric are provided. For a list of all areas with employment in Ophthalmologists, Except Pediatric, see the Create Customized Tables function.
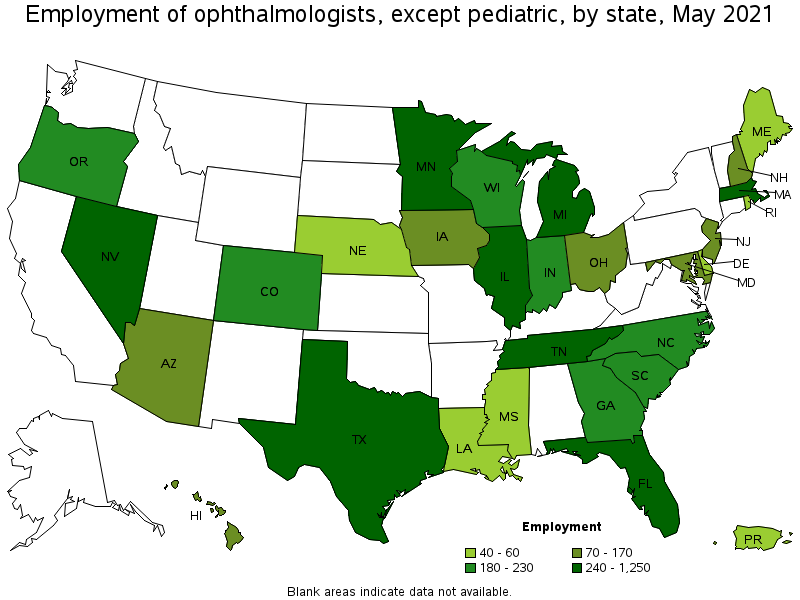
States with the highest employment level in Ophthalmologists, Except Pediatric:
| State | Employment (1) | Employment per thousand jobs | Location quotient (9) | Hourly mean wage | Annual mean wage (2) |
|---|---|---|---|---|---|
| Texas | 1,250 | 0.10 | 1.24 | $ 162.08 | $ 337,120 |
| Illinois | 800 | 0.14 | 1.74 | $ 153.33 | $ 318,930 |
| Florida | 730 | 0.08 | 1.03 | $ 115.92 | $ 241,120 |
| Nevada | 430 | 0.34 | 4.08 | $ 133.25 | $ 277,150 |
| Michigan | 400 | 0.10 | 1.20 | $ 139.33 | $ 289,810 |
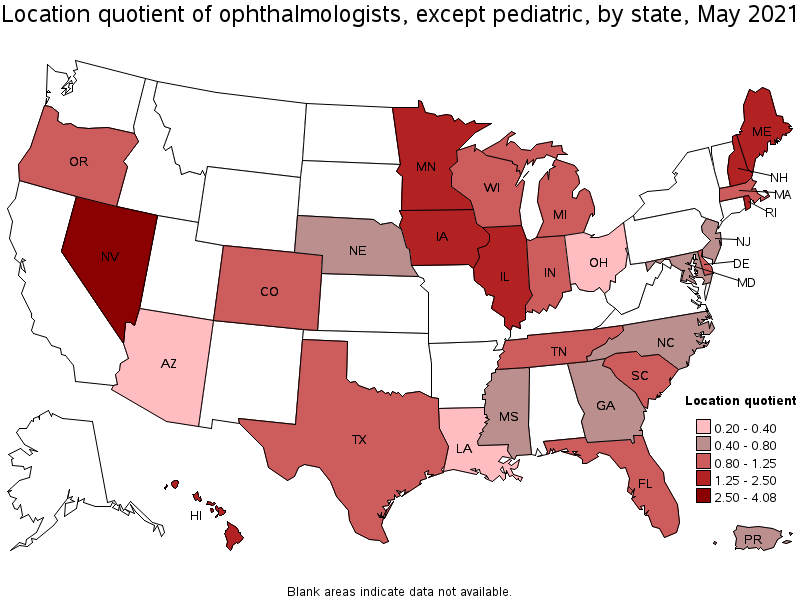
States with the highest concentration of jobs and location quotients in Ophthalmologists, Except Pediatric:
| State | Employment (1) | Employment per thousand jobs | Location quotient (9) | Hourly mean wage | Annual mean wage (2) |
|---|---|---|---|---|---|
| Nevada | 430 | 0.34 | 4.08 | $ 133.25 | $ 277,150 |
| Hawaii | 110 | 0.19 | 2.33 | $ 130.51 | $ 271,460 |
| Illinois | 800 | 0.14 | 1.74 | $ 153.33 | $ 318,930 |
| Minnesota | 370 | 0.13 | 1.63 | $ 107.42 | $ 223,430 |
| New Hampshire | 70 | 0.12 | 1.40 | $ 149.42 | $ 310,800 |
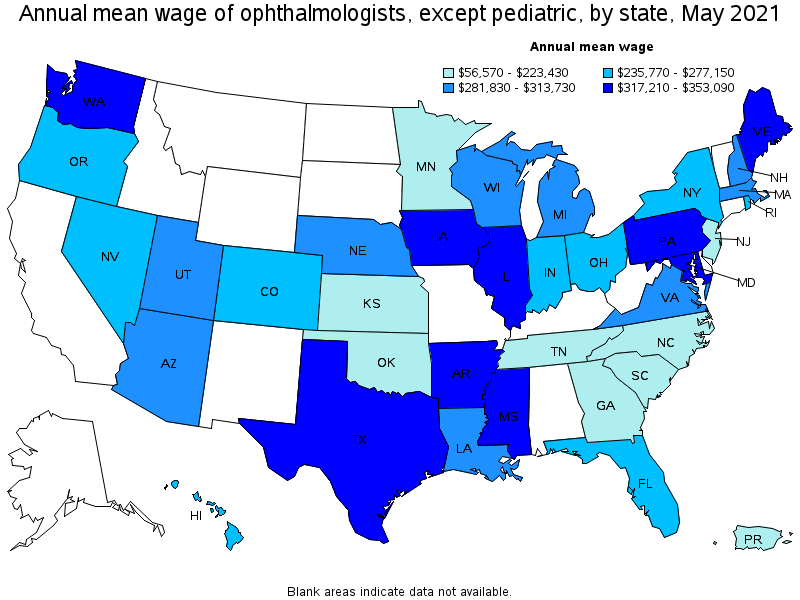
Top paying states for Ophthalmologists, Except Pediatric:
| State | Employment (1) | Employment per thousand jobs | Location quotient (9) | Hourly mean wage | Annual mean wage (2) |
|---|---|---|---|---|---|
| Delaware | 40 | 0.09 | 1.14 | (5) | (5) |
| South Dakota | (8) | (8) | (8) | (5) | (5) |
| Vermont | (8) | (8) | (8) | (5) | (5) |
| Mississippi | 50 | 0.04 | 0.50 | $ 169.75 | $ 353,090 |
| Maine | 60 | 0.11 | 1.31 | $ 168.21 | $ 349,870 |
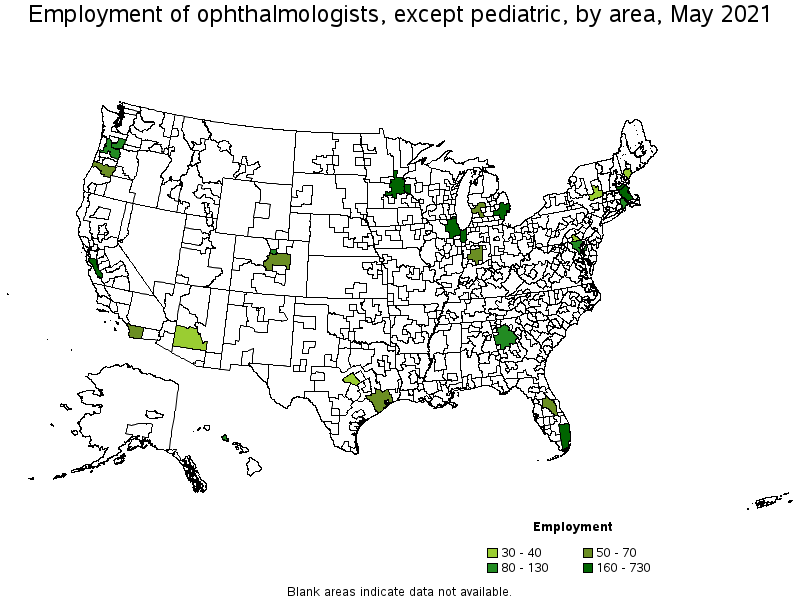
Metropolitan areas with the highest employment level in Ophthalmologists, Except Pediatric:
| Metropolitan area | Employment (1) | Employment per thousand jobs | Location quotient (9) | Hourly mean wage | Annual mean wage (2) |
|---|---|---|---|---|---|
| Chicago-Naperville-Elgin, IL-IN-WI | 730 | 0.17 | 2.10 | $ 153.02 | $ 318,280 |
| San Jose-Sunnyvale-Santa Clara, CA | 310 | 0.29 | 3.52 | $ 94.33 | $ 196,210 |
| Boston-Cambridge-Nashua, MA-NH | 230 | 0.09 | 1.09 | $ 151.82 | $ 315,790 |
| Miami-Fort Lauderdale-West Palm Beach, FL | 210 | 0.09 | 1.05 | $ 135.73 | $ 282,320 |
| Detroit-Warren-Dearborn, MI | 190 | 0.10 | 1.26 | $ 154.35 | $ 321,050 |
| Minneapolis-St. Paul-Bloomington, MN-WI | 160 | 0.09 | 1.05 | $ 101.39 | $ 210,900 |
| Atlanta-Sandy Springs-Roswell, GA | 130 | 0.05 | 0.61 | $ 107.50 | $ 223,610 |
| Boulder, CO | 100 | 0.53 | 6.48 | $ 122.55 | $ 254,910 |
| Portland-Vancouver-Hillsboro, OR-WA | 100 | 0.09 | 1.04 | $ 145.72 | $ 303,100 |
| Urban Honolulu, HI | 90 | 0.22 | 2.70 | $ 124.15 | $ 258,220 |
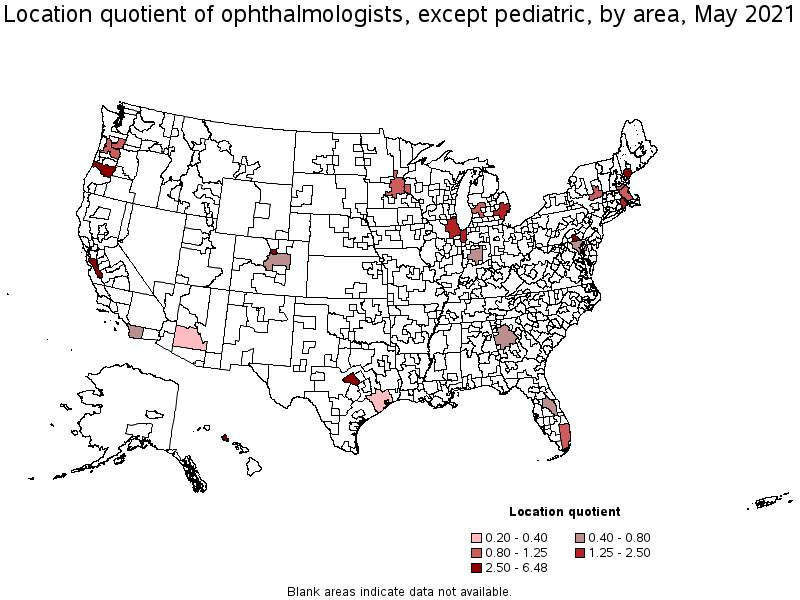
Metropolitan areas with the highest concentration of jobs and location quotients in Ophthalmologists, Except Pediatric:
| Metropolitan area | Employment (1) | Employment per thousand jobs | Location quotient (9) | Hourly mean wage | Annual mean wage (2) |
|---|---|---|---|---|---|
| Boulder, CO | 100 | 0.53 | 6.48 | $ 122.55 | $ 254,910 |
| Eugene, OR | 50 | 0.32 | 3.89 | $ 125.20 | $ 260,420 |
| San Jose-Sunnyvale-Santa Clara, CA | 310 | 0.29 | 3.52 | $ 94.33 | $ 196,210 |
| Killeen-Temple, TX | 30 | 0.24 | 2.86 | (5) | (5) |
| Urban Honolulu, HI | 90 | 0.22 | 2.70 | $ 124.15 | $ 258,220 |
| Portland-South Portland, ME | 40 | 0.21 | 2.53 | (5) | (5) |
| York-Hanover, PA | 40 | 0.21 | 2.50 | $ 165.61 | $ 344,470 |
| Chicago-Naperville-Elgin, IL-IN-WI | 730 | 0.17 | 2.10 | $ 153.02 | $ 318,280 |
| Providence-Warwick, RI-MA | 80 | 0.14 | 1.74 | $ 118.60 | $ 246,680 |
| Detroit-Warren-Dearborn, MI | 190 | 0.10 | 1.26 | $ 154.35 | $ 321,050 |
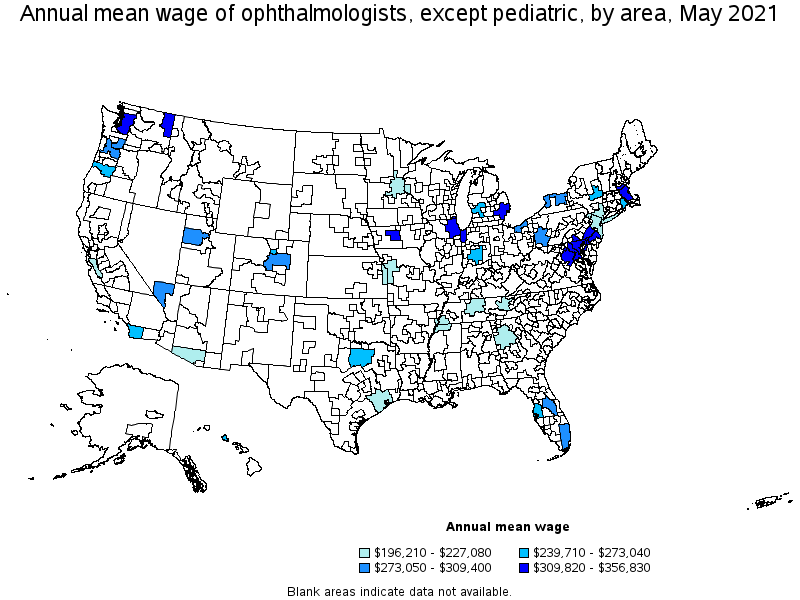
Top paying metropolitan areas for Ophthalmologists, Except Pediatric:
| Metropolitan area | Employment (1) | Employment per thousand jobs | Location quotient (9) | Hourly mean wage | Annual mean wage (2) |
|---|---|---|---|---|---|
| Killeen-Temple, TX | 30 | 0.24 | 2.86 | (5) | (5) |
| Phoenix-Mesa-Scottsdale, AZ | 30 | 0.02 | 0.20 | (5) | (5) |
| Richmond, VA | (8) | (8) | (8) | (5) | (5) |
| San Antonio-New Braunfels, TX | (8) | (8) | (8) | (5) | (5) |
| Portland-South Portland, ME | 40 | 0.21 | 2.53 | (5) | (5) |
| Philadelphia-Camden-Wilmington, PA-NJ-DE-MD | (8) | (8) | (8) | $ 171.56 | $ 356,830 |
| Des Moines-West Des Moines, IA | (8) | (8) | (8) | $ 171.03 | $ 355,740 |
| York-Hanover, PA | 40 | 0.21 | 2.50 | $ 165.61 | $ 344,470 |
| Spokane-Spokane Valley, WA | (8) | (8) | (8) | $ 162.79 | $ 338,600 |
| Seattle-Tacoma-Bellevue, WA | (8) | (8) | (8) | $ 162.30 | $ 337,590 |
These estimates are calculated with data collected from employers in all industry sectors, all metropolitan and nonmetropolitan areas, and all states and the District of Columbia. The top employment and wage figures are provided above. The complete list is available in the downloadable XLS files.
The percentile wage estimate is the value of a wage below which a certain percent of workers fall. The median wage is the 50th percentile wage estimate—50 percent of workers earn less than the median and 50 percent of workers earn more than the median. More about percentile wages.
(1) Estimates for detailed occupations do not sum to the totals because the totals include occupations not shown separately. Estimates do not include self-employed workers.
(2) Annual wages have been calculated by multiplying the hourly mean wage by a "year-round, full-time" hours figure of 2,080 hours; for those occupations where there is not an hourly wage published, the annual wage has been directly calculated from the reported survey data.
(3) The relative standard error (RSE) is a measure of the reliability of a survey statistic. The smaller the relative standard error, the more precise the estimate.
(5) This wage is equal to or greater than $100.00 per hour or $208,000 per year.
(8) Estimate not released.
(9) The location quotient is the ratio of the area concentration of occupational employment to the national average concentration. A location quotient greater than one indicates the occupation has a higher share of employment than average, and a location quotient less than one indicates the occupation is less prevalent in the area than average.
Other OEWS estimates and related information:
May 2021 National Occupational Employment and Wage Estimates
May 2021 State Occupational Employment and Wage Estimates
May 2021 Metropolitan and Nonmetropolitan Area Occupational Employment and Wage Estimates
May 2021 National Industry-Specific Occupational Employment and Wage Estimates
Last Modified Date: March 31, 2022