
An official website of the United States government
An official website of the United States government
The .gov means it's official.
Federal government websites often end in .gov or .mil. Before sharing sensitive information,
make sure you're on a federal government site.
The site is secure.
The
https:// ensures that you are connecting to the official website and that any
information you provide is encrypted and transmitted securely.
Prepare, administer, and measure radioactive isotopes in therapeutic, diagnostic, and tracer studies using a variety of radioisotope equipment. Prepare stock solutions of radioactive materials and calculate doses to be administered by radiologists. Subject patients to radiation. Execute blood volume, red cell survival, and fat absorption studies following standard laboratory techniques.
Employment estimate and mean wage estimates for Nuclear Medicine Technologists:
| Employment (1) | Employment RSE (3) |
Mean hourly wage |
Mean annual wage (2) |
Wage RSE (3) |
|---|---|---|---|---|
| 17,140 | 1.8 % | $ 40.79 | $ 84,850 | 0.9 % |
Percentile wage estimates for Nuclear Medicine Technologists:
| Percentile | 10% | 25% | 50% (Median) |
75% | 90% |
|---|---|---|---|---|---|
| Hourly Wage | $ 29.11 | $ 35.97 | $ 37.86 | $ 47.31 | $ 50.74 |
| Annual Wage (2) | $ 60,550 | $ 74,820 | $ 78,760 | $ 98,410 | $ 105,530 |
Industries with the highest published employment and wages for Nuclear Medicine Technologists are provided. For a list of all industries with employment in Nuclear Medicine Technologists, see the Create Customized Tables function.
Industries with the highest levels of employment in Nuclear Medicine Technologists:
| Industry | Employment (1) | Percent of industry employment | Hourly mean wage | Annual mean wage (2) |
|---|---|---|---|---|
| General Medical and Surgical Hospitals | 12,480 | 0.22 | $ 40.29 | $ 83,810 |
| Offices of Physicians | 2,370 | 0.09 | $ 41.54 | $ 86,400 |
| Medical and Diagnostic Laboratories | 1,030 | 0.35 | $ 39.61 | $ 82,380 |
| Outpatient Care Centers | 530 | 0.05 | $ 56.06 | $ 116,610 |
| Specialty (except Psychiatric and Substance Abuse) Hospitals | 240 | 0.09 | $ 40.75 | $ 84,770 |
Industries with the highest concentration of employment in Nuclear Medicine Technologists:
| Industry | Employment (1) | Percent of industry employment | Hourly mean wage | Annual mean wage (2) |
|---|---|---|---|---|
| Medical and Diagnostic Laboratories | 1,030 | 0.35 | $ 39.61 | $ 82,380 |
| General Medical and Surgical Hospitals | 12,480 | 0.22 | $ 40.29 | $ 83,810 |
| Offices of Physicians | 2,370 | 0.09 | $ 41.54 | $ 86,400 |
| Specialty (except Psychiatric and Substance Abuse) Hospitals | 240 | 0.09 | $ 40.75 | $ 84,770 |
| Outpatient Care Centers | 530 | 0.05 | $ 56.06 | $ 116,610 |
Top paying industries for Nuclear Medicine Technologists:
| Industry | Employment (1) | Percent of industry employment | Hourly mean wage | Annual mean wage (2) |
|---|---|---|---|---|
| Outpatient Care Centers | 530 | 0.05 | $ 56.06 | $ 116,610 |
| Colleges, Universities, and Professional Schools | 70 | (7) | $ 42.75 | $ 88,910 |
| Offices of Physicians | 2,370 | 0.09 | $ 41.54 | $ 86,400 |
| Specialty (except Psychiatric and Substance Abuse) Hospitals | 240 | 0.09 | $ 40.75 | $ 84,770 |
| General Medical and Surgical Hospitals | 12,480 | 0.22 | $ 40.29 | $ 83,810 |
States and areas with the highest published employment, location quotients, and wages for Nuclear Medicine Technologists are provided. For a list of all areas with employment in Nuclear Medicine Technologists, see the Create Customized Tables function.
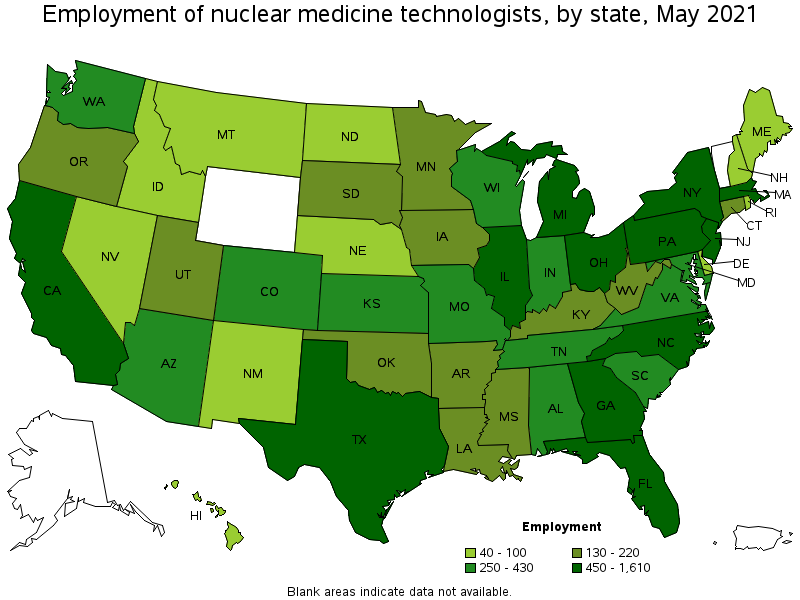
States with the highest employment level in Nuclear Medicine Technologists:
| State | Employment (1) | Employment per thousand jobs | Location quotient (9) | Hourly mean wage | Annual mean wage (2) |
|---|---|---|---|---|---|
| Florida | 1,610 | 0.19 | 1.54 | $ 36.86 | $ 76,670 |
| California | 1,420 | 0.09 | 0.71 | $ 60.06 | $ 124,930 |
| Texas | 1,040 | 0.09 | 0.70 | $ 43.59 | $ 90,670 |
| Ohio | 920 | 0.18 | 1.46 | $ 36.19 | $ 75,270 |
| New York | 880 | 0.10 | 0.84 | $ 46.19 | $ 96,080 |
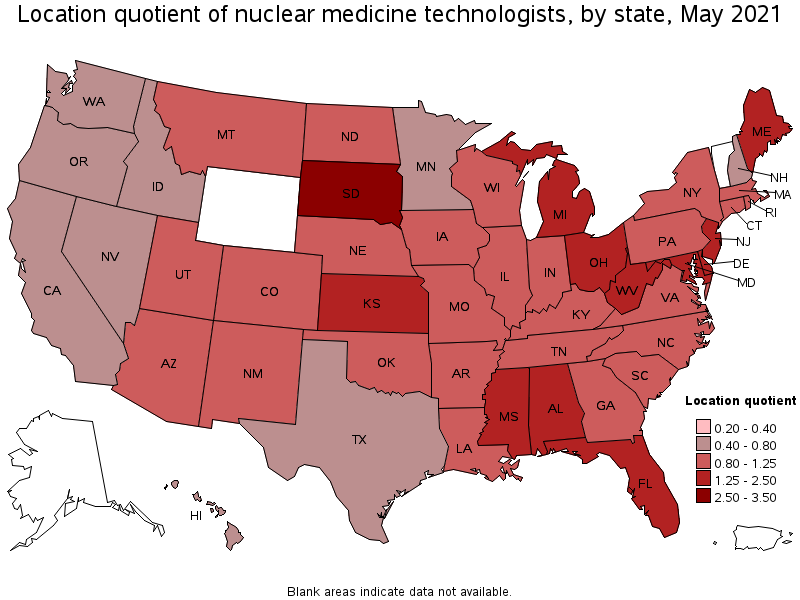
States with the highest concentration of jobs and location quotients in Nuclear Medicine Technologists:
| State | Employment (1) | Employment per thousand jobs | Location quotient (9) | Hourly mean wage | Annual mean wage (2) |
|---|---|---|---|---|---|
| South Dakota | 130 | 0.31 | 2.51 | $ 30.11 | $ 62,630 |
| Kansas | 290 | 0.22 | 1.79 | $ 33.37 | $ 69,410 |
| West Virginia | 140 | 0.21 | 1.70 | $ 31.55 | $ 65,630 |
| Florida | 1,610 | 0.19 | 1.54 | $ 36.86 | $ 76,670 |
| Alabama | 360 | 0.19 | 1.53 | $ 31.37 | $ 65,240 |
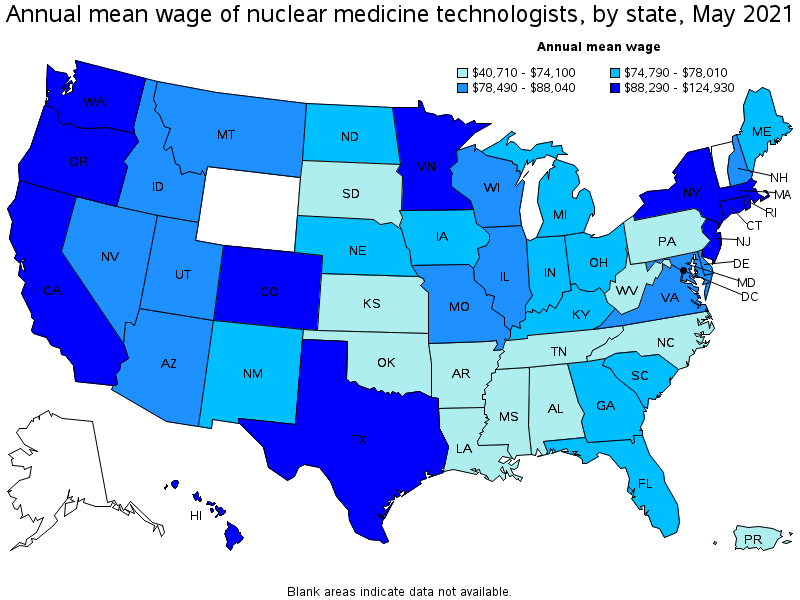
Top paying states for Nuclear Medicine Technologists:
| State | Employment (1) | Employment per thousand jobs | Location quotient (9) | Hourly mean wage | Annual mean wage (2) |
|---|---|---|---|---|---|
| California | 1,420 | 0.09 | 0.71 | $ 60.06 | $ 124,930 |
| Rhode Island | 50 | 0.11 | 0.87 | $ 51.28 | $ 106,670 |
| District of Columbia | (8) | (8) | (8) | $ 50.21 | $ 104,450 |
| Hawaii | 40 | 0.07 | 0.57 | $ 50.04 | $ 104,080 |
| Washington | 260 | 0.08 | 0.67 | $ 49.75 | $ 103,480 |
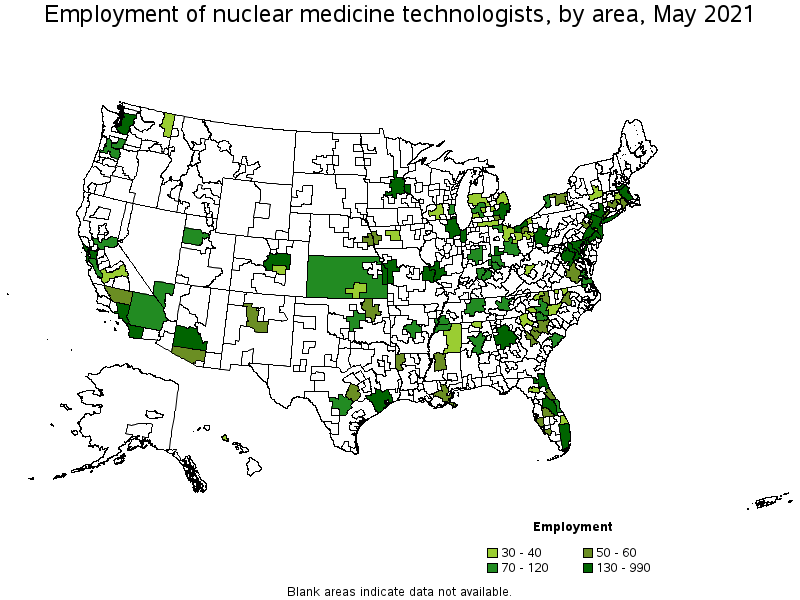
Metropolitan areas with the highest employment level in Nuclear Medicine Technologists:
| Metropolitan area | Employment (1) | Employment per thousand jobs | Location quotient (9) | Hourly mean wage | Annual mean wage (2) |
|---|---|---|---|---|---|
| New York-Newark-Jersey City, NY-NJ-PA | 990 | 0.11 | 0.94 | $ 48.26 | $ 100,370 |
| Chicago-Naperville-Elgin, IL-IN-WI | 570 | 0.13 | 1.11 | $ 42.06 | $ 87,470 |
| Los Angeles-Long Beach-Anaheim, CA | 480 | 0.08 | 0.69 | $ 58.44 | $ 121,560 |
| Miami-Fort Lauderdale-West Palm Beach, FL | 410 | 0.17 | 1.39 | $ 36.99 | $ 76,950 |
| Philadelphia-Camden-Wilmington, PA-NJ-DE-MD | 410 | 0.15 | 1.27 | $ 40.64 | $ 84,540 |
| Atlanta-Sandy Springs-Roswell, GA | 330 | 0.13 | 1.05 | $ 38.85 | $ 80,800 |
| Boston-Cambridge-Nashua, MA-NH | 330 | 0.13 | 1.04 | $ 42.63 | $ 88,670 |
| Washington-Arlington-Alexandria, DC-VA-MD-WV | 300 | 0.10 | 0.84 | $ 43.59 | $ 90,670 |
| Detroit-Warren-Dearborn, MI | 290 | 0.16 | 1.32 | $ 36.55 | $ 76,030 |
| Phoenix-Mesa-Scottsdale, AZ | 290 | 0.14 | 1.12 | $ 40.11 | $ 83,430 |
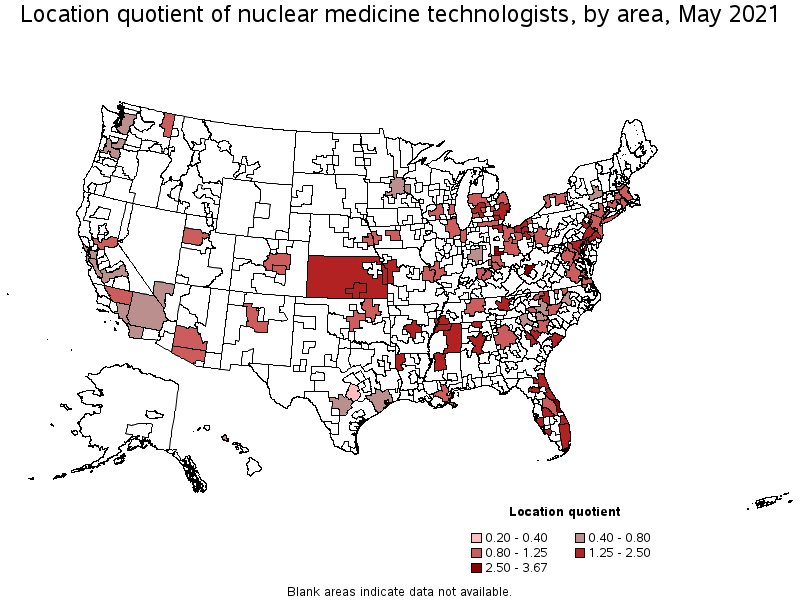
Metropolitan areas with the highest concentration of jobs and location quotients in Nuclear Medicine Technologists:
| Metropolitan area | Employment (1) | Employment per thousand jobs | Location quotient (9) | Hourly mean wage | Annual mean wage (2) |
|---|---|---|---|---|---|
| Palm Bay-Melbourne-Titusville, FL | 100 | 0.45 | 3.67 | $ 38.16 | $ 79,370 |
| Dayton, OH | 150 | 0.42 | 3.42 | $ 36.91 | $ 76,780 |
| Charleston, WV | 30 | 0.32 | 2.65 | (8) | (8) |
| Toledo, OH | 80 | 0.30 | 2.44 | $ 33.36 | $ 69,390 |
| Shreveport-Bossier City, LA | 50 | 0.28 | 2.34 | $ 34.15 | $ 71,030 |
| Gainesville, FL | 40 | 0.28 | 2.34 | $ 35.28 | $ 73,370 |
| Canton-Massillon, OH | 40 | 0.27 | 2.20 | $ 35.18 | $ 73,180 |
| Port St. Lucie, FL | 40 | 0.26 | 2.18 | $ 34.94 | $ 72,680 |
| Jackson, MS | 60 | 0.26 | 2.13 | $ 34.86 | $ 72,510 |
| Birmingham-Hoover, AL | 120 | 0.25 | 2.07 | $ 32.36 | $ 67,310 |
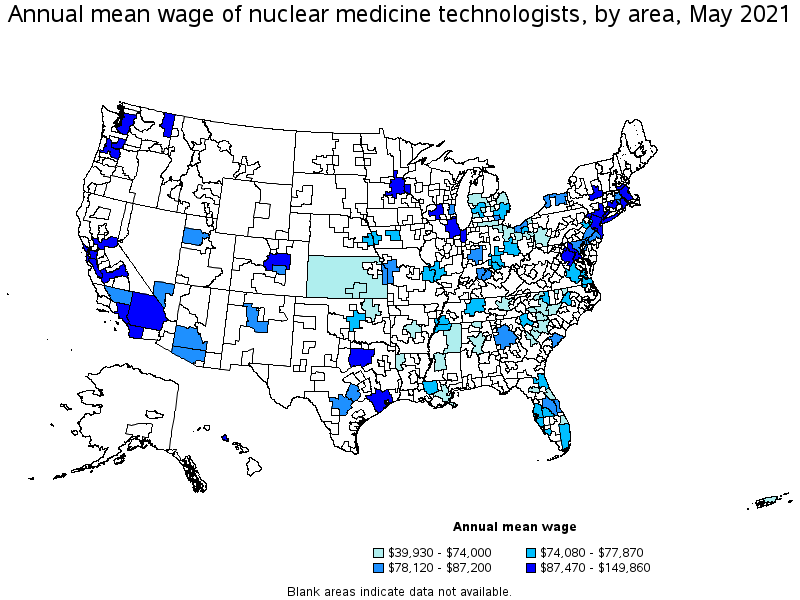
Top paying metropolitan areas for Nuclear Medicine Technologists:
| Metropolitan area | Employment (1) | Employment per thousand jobs | Location quotient (9) | Hourly mean wage | Annual mean wage (2) |
|---|---|---|---|---|---|
| San Jose-Sunnyvale-Santa Clara, CA | 80 | 0.08 | 0.64 | $ 72.05 | $ 149,860 |
| San Francisco-Oakland-Hayward, CA | 170 | 0.07 | 0.61 | $ 71.27 | $ 148,240 |
| Sacramento--Roseville--Arden-Arcade, CA | 100 | 0.10 | 0.86 | $ 64.94 | $ 135,080 |
| Fresno, CA | 40 | 0.09 | 0.78 | $ 59.90 | $ 124,580 |
| San Diego-Carlsbad, CA | 130 | 0.09 | 0.77 | $ 59.16 | $ 123,060 |
| Los Angeles-Long Beach-Anaheim, CA | 480 | 0.08 | 0.69 | $ 58.44 | $ 121,560 |
| Seattle-Tacoma-Bellevue, WA | 140 | 0.07 | 0.61 | $ 52.73 | $ 109,670 |
| Riverside-San Bernardino-Ontario, CA | 120 | 0.08 | 0.67 | $ 52.41 | $ 109,010 |
| Urban Honolulu, HI | 30 | 0.08 | 0.67 | $ 50.78 | $ 105,610 |
| Houston-The Woodlands-Sugar Land, TX | 280 | 0.10 | 0.79 | $ 50.59 | $ 105,220 |
Nonmetropolitan areas with the highest employment in Nuclear Medicine Technologists:
| Nonmetropolitan area | Employment (1) | Employment per thousand jobs | Location quotient (9) | Hourly mean wage | Annual mean wage (2) |
|---|---|---|---|---|---|
| Kansas nonmetropolitan area | 100 | 0.26 | 2.17 | $ 29.75 | $ 61,880 |
| North Northeastern Ohio nonmetropolitan area (noncontiguous) | 40 | 0.14 | 1.17 | $ 35.58 | $ 74,000 |
| Northeast Mississippi nonmetropolitan area | 40 | 0.16 | 1.31 | $ 30.98 | $ 64,430 |
| Balance of Lower Peninsula of Michigan nonmetropolitan area | 30 | 0.13 | 1.08 | $ 35.26 | $ 73,340 |
| Piedmont North Carolina nonmetropolitan area | 30 | 0.13 | 1.10 | $ 34.41 | $ 71,560 |
Nonmetropolitan areas with the highest concentration of jobs and location quotients in Nuclear Medicine Technologists:
| Nonmetropolitan area | Employment (1) | Employment per thousand jobs | Location quotient (9) | Hourly mean wage | Annual mean wage (2) |
|---|---|---|---|---|---|
| Kansas nonmetropolitan area | 100 | 0.26 | 2.17 | $ 29.75 | $ 61,880 |
| Northeast Mississippi nonmetropolitan area | 40 | 0.16 | 1.31 | $ 30.98 | $ 64,430 |
| North Northeastern Ohio nonmetropolitan area (noncontiguous) | 40 | 0.14 | 1.17 | $ 35.58 | $ 74,000 |
| Piedmont North Carolina nonmetropolitan area | 30 | 0.13 | 1.10 | $ 34.41 | $ 71,560 |
| Balance of Lower Peninsula of Michigan nonmetropolitan area | 30 | 0.13 | 1.08 | $ 35.26 | $ 73,340 |
Top paying nonmetropolitan areas for Nuclear Medicine Technologists:
| Nonmetropolitan area | Employment (1) | Employment per thousand jobs | Location quotient (9) | Hourly mean wage | Annual mean wage (2) |
|---|---|---|---|---|---|
| North Northeastern Ohio nonmetropolitan area (noncontiguous) | 40 | 0.14 | 1.17 | $ 35.58 | $ 74,000 |
| Balance of Lower Peninsula of Michigan nonmetropolitan area | 30 | 0.13 | 1.08 | $ 35.26 | $ 73,340 |
| Piedmont North Carolina nonmetropolitan area | 30 | 0.13 | 1.10 | $ 34.41 | $ 71,560 |
| Northeast Mississippi nonmetropolitan area | 40 | 0.16 | 1.31 | $ 30.98 | $ 64,430 |
| Kansas nonmetropolitan area | 100 | 0.26 | 2.17 | $ 29.75 | $ 61,880 |
These estimates are calculated with data collected from employers in all industry sectors, all metropolitan and nonmetropolitan areas, and all states and the District of Columbia. The top employment and wage figures are provided above. The complete list is available in the downloadable XLS files.
The percentile wage estimate is the value of a wage below which a certain percent of workers fall. The median wage is the 50th percentile wage estimate—50 percent of workers earn less than the median and 50 percent of workers earn more than the median. More about percentile wages.
(1) Estimates for detailed occupations do not sum to the totals because the totals include occupations not shown separately. Estimates do not include self-employed workers.
(2) Annual wages have been calculated by multiplying the hourly mean wage by a "year-round, full-time" hours figure of 2,080 hours; for those occupations where there is not an hourly wage published, the annual wage has been directly calculated from the reported survey data.
(3) The relative standard error (RSE) is a measure of the reliability of a survey statistic. The smaller the relative standard error, the more precise the estimate.
(7) The value is less than .005 percent of industry employment.
(8) Estimate not released.
(9) The location quotient is the ratio of the area concentration of occupational employment to the national average concentration. A location quotient greater than one indicates the occupation has a higher share of employment than average, and a location quotient less than one indicates the occupation is less prevalent in the area than average.
Other OEWS estimates and related information:
May 2021 National Occupational Employment and Wage Estimates
May 2021 State Occupational Employment and Wage Estimates
May 2021 Metropolitan and Nonmetropolitan Area Occupational Employment and Wage Estimates
May 2021 National Industry-Specific Occupational Employment and Wage Estimates
Last Modified Date: March 31, 2022