
An official website of the United States government
An official website of the United States government
The .gov means it's official.
Federal government websites often end in .gov or .mil. Before sharing sensitive information,
make sure you're on a federal government site.
The site is secure.
The
https:// ensures that you are connecting to the official website and that any
information you provide is encrypted and transmitted securely.
Administer basic or advanced emergency medical care and assess injuries and illnesses. May administer medication intravenously, use equipment such as EKGs, or administer advanced life support to sick or injured individuals. Excludes �Emergency Medical Technicians� (29-2042) and �Ambulance Drivers and Attendants, Except Emergency Medical Technicians� (53-3011).
Employment estimate and mean wage estimates for Paramedics:
| Employment (1) | Employment RSE (3) |
Mean hourly wage |
Mean annual wage (2) |
Wage RSE (3) |
|---|---|---|---|---|
| 96,510 | 1.7 % | $ 23.80 | $ 49,500 | 0.5 % |
Percentile wage estimates for Paramedics:
| Percentile | 10% | 25% | 50% (Median) |
75% | 90% |
|---|---|---|---|---|---|
| Hourly Wage | $ 16.55 | $ 17.85 | $ 22.48 | $ 28.27 | $ 35.67 |
| Annual Wage (2) | $ 34,420 | $ 37,120 | $ 46,770 | $ 58,810 | $ 74,200 |
Industries with the highest published employment and wages for Paramedics are provided. For a list of all industries with employment in Paramedics, see the Create Customized Tables function.
Industries with the highest levels of employment in Paramedics:
| Industry | Employment (1) | Percent of industry employment | Hourly mean wage | Annual mean wage (2) |
|---|---|---|---|---|
| Other Ambulatory Health Care Services | 40,320 | 12.93 | $ 22.57 | $ 46,950 |
| Local Government, excluding schools and hospitals (OEWS Designation) | 32,290 | 0.60 | $ 25.52 | $ 53,090 |
| General Medical and Surgical Hospitals | 17,470 | 0.31 | $ 23.67 | $ 49,230 |
| Other Support Services | 1,860 | 0.66 | $ 19.12 | $ 39,770 |
| Offices of Physicians | 1,620 | 0.06 | $ 26.30 | $ 54,690 |
Industries with the highest concentration of employment in Paramedics:
| Industry | Employment (1) | Percent of industry employment | Hourly mean wage | Annual mean wage (2) |
|---|---|---|---|---|
| Other Ambulatory Health Care Services | 40,320 | 12.93 | $ 22.57 | $ 46,950 |
| Other Support Services | 1,860 | 0.66 | $ 19.12 | $ 39,770 |
| Local Government, excluding schools and hospitals (OEWS Designation) | 32,290 | 0.60 | $ 25.52 | $ 53,090 |
| General Medical and Surgical Hospitals | 17,470 | 0.31 | $ 23.67 | $ 49,230 |
| Nonscheduled Air Transportation | 100 | 0.21 | $ 38.26 | $ 79,580 |
Top paying industries for Paramedics:
| Industry | Employment (1) | Percent of industry employment | Hourly mean wage | Annual mean wage (2) |
|---|---|---|---|---|
| Nonscheduled Air Transportation | 100 | 0.21 | $ 38.26 | $ 79,580 |
| State Government, excluding schools and hospitals (OEWS Designation) | 40 | (7) | $ 33.95 | $ 70,620 |
| Medical and Diagnostic Laboratories | 160 | 0.05 | $ 26.33 | $ 54,760 |
| Offices of Physicians | 1,620 | 0.06 | $ 26.30 | $ 54,690 |
| Chemical Manufacturing (3251, 3252, 3253, and 3259 only) | 40 | 0.01 | $ 25.63 | $ 53,310 |
States and areas with the highest published employment, location quotients, and wages for Paramedics are provided. For a list of all areas with employment in Paramedics, see the Create Customized Tables function.
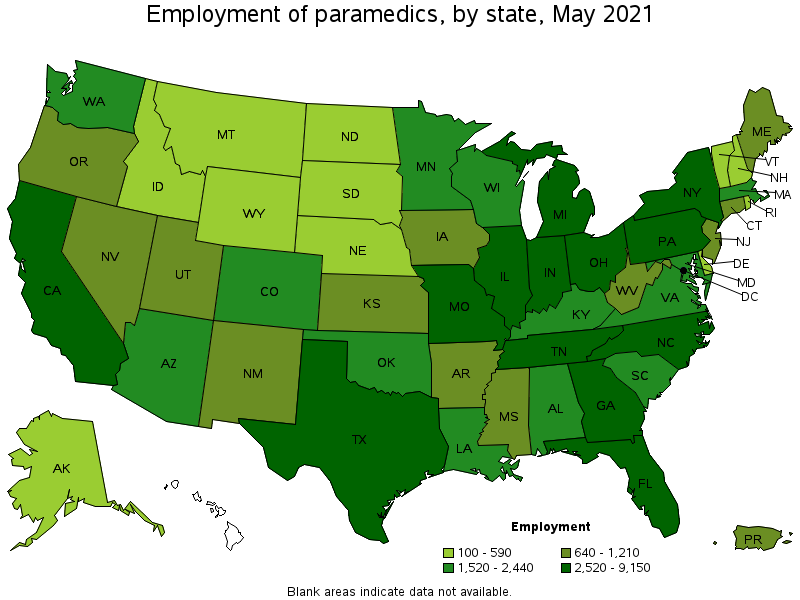
States with the highest employment level in Paramedics:
| State | Employment (1) | Employment per thousand jobs | Location quotient (9) | Hourly mean wage | Annual mean wage (2) |
|---|---|---|---|---|---|
| Texas | 9,150 | 0.75 | 1.09 | $ 21.99 | $ 45,730 |
| New York | 5,660 | 0.65 | 0.95 | $ 27.56 | $ 57,320 |
| California | 5,150 | 0.31 | 0.45 | $ 27.97 | $ 58,190 |
| Florida | 4,970 | 0.58 | 0.84 | $ 22.46 | $ 46,710 |
| North Carolina | 4,910 | 1.11 | 1.62 | $ 20.48 | $ 42,610 |
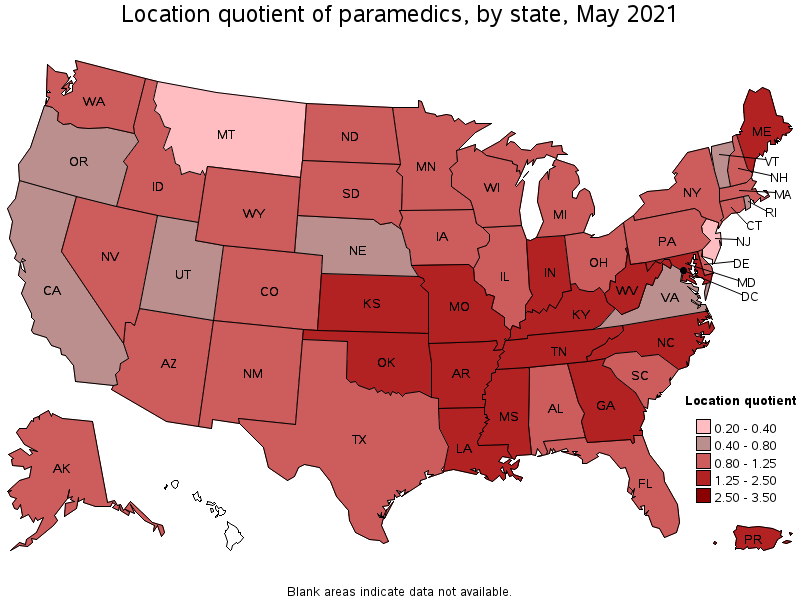
States with the highest concentration of jobs and location quotients in Paramedics:
| State | Employment (1) | Employment per thousand jobs | Location quotient (9) | Hourly mean wage | Annual mean wage (2) |
|---|---|---|---|---|---|
| West Virginia | 930 | 1.41 | 2.06 | $ 19.02 | $ 39,550 |
| Maine | 720 | 1.22 | 1.78 | $ 21.92 | $ 45,590 |
| Tennessee | 3,360 | 1.13 | 1.64 | $ 22.20 | $ 46,170 |
| North Carolina | 4,910 | 1.11 | 1.62 | $ 20.48 | $ 42,610 |
| Oklahoma | 1,690 | 1.08 | 1.58 | $ 20.07 | $ 41,750 |
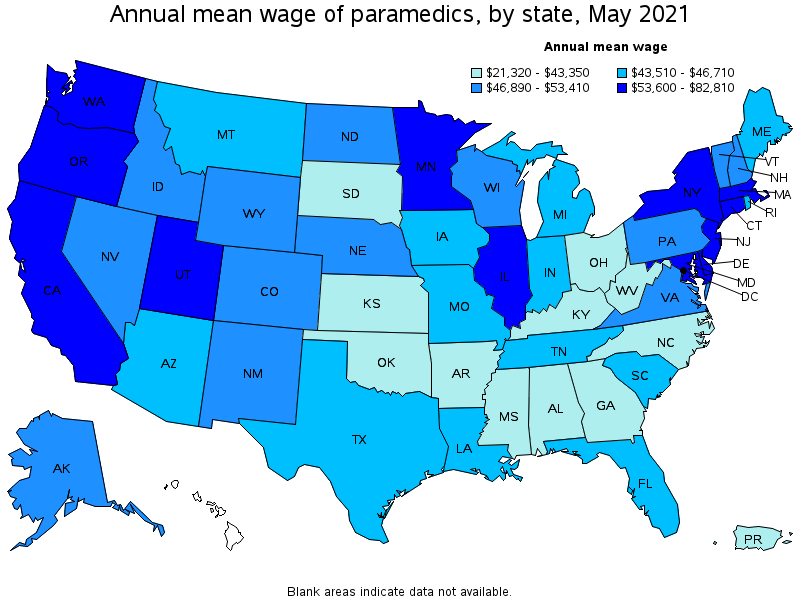
Top paying states for Paramedics:
| State | Employment (1) | Employment per thousand jobs | Location quotient (9) | Hourly mean wage | Annual mean wage (2) |
|---|---|---|---|---|---|
| Washington | 2,280 | 0.71 | 1.04 | $ 39.81 | $ 82,810 |
| New Jersey | 970 | 0.25 | 0.37 | $ 34.22 | $ 71,180 |
| District of Columbia | 120 | 0.19 | 0.28 | $ 31.22 | $ 64,940 |
| Connecticut | 1,100 | 0.70 | 1.02 | $ 29.91 | $ 62,210 |
| Maryland | 2,290 | 0.90 | 1.31 | $ 28.62 | $ 59,520 |
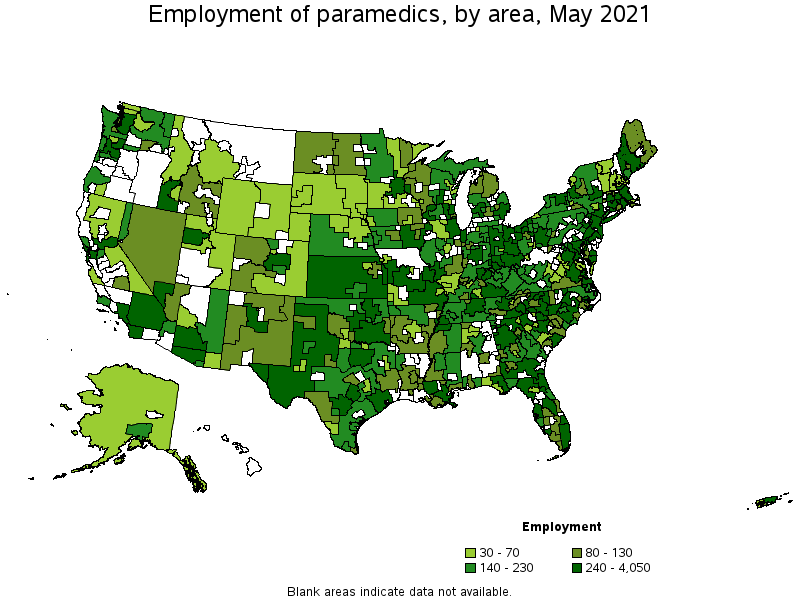
Metropolitan areas with the highest employment level in Paramedics:
| Metropolitan area | Employment (1) | Employment per thousand jobs | Location quotient (9) | Hourly mean wage | Annual mean wage (2) |
|---|---|---|---|---|---|
| New York-Newark-Jersey City, NY-NJ-PA | 4,050 | 0.47 | 0.68 | $ 31.48 | $ 65,490 |
| Chicago-Naperville-Elgin, IL-IN-WI | 3,310 | 0.78 | 1.14 | $ 30.37 | $ 63,180 |
| Atlanta-Sandy Springs-Roswell, GA | 2,280 | 0.88 | 1.29 | $ 22.44 | $ 46,670 |
| Dallas-Fort Worth-Arlington, TX | 2,250 | 0.63 | 0.92 | $ 23.24 | $ 48,340 |
| Houston-The Woodlands-Sugar Land, TX | 1,930 | 0.67 | 0.97 | $ 21.35 | $ 44,400 |
| Boston-Cambridge-Nashua, MA-NH | 1,540 | 0.60 | 0.87 | $ 28.78 | $ 59,860 |
| Philadelphia-Camden-Wilmington, PA-NJ-DE-MD | 1,510 | 0.57 | 0.83 | $ 28.92 | $ 60,140 |
| Los Angeles-Long Beach-Anaheim, CA | 1,370 | 0.24 | 0.35 | $ 28.84 | $ 59,990 |
| Baltimore-Columbia-Towson, MD | 1,330 | 1.06 | 1.55 | $ 28.82 | $ 59,950 |
| St. Louis, MO-IL | 1,100 | 0.86 | 1.26 | $ 21.22 | $ 44,140 |
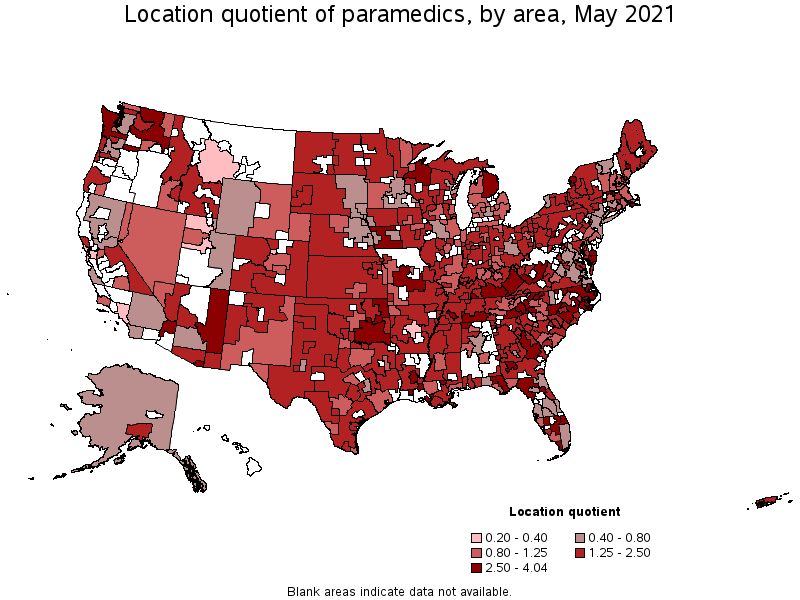
Metropolitan areas with the highest concentration of jobs and location quotients in Paramedics:
| Metropolitan area | Employment (1) | Employment per thousand jobs | Location quotient (9) | Hourly mean wage | Annual mean wage (2) |
|---|---|---|---|---|---|
| Jackson, TN | 180 | 2.77 | 4.04 | $ 20.70 | $ 43,050 |
| Johnstown, PA | 130 | 2.69 | 3.92 | $ 18.90 | $ 39,310 |
| Asheville, NC | 490 | 2.59 | 3.79 | $ 20.27 | $ 42,160 |
| New Bern, NC | 110 | 2.44 | 3.56 | $ 19.10 | $ 39,730 |
| Lewiston-Auburn, ME | 110 | 2.38 | 3.48 | $ 25.54 | $ 53,130 |
| Florence-Muscle Shoals, AL | 120 | 2.38 | 3.47 | $ 16.10 | $ 33,490 |
| Port St. Lucie, FL | 310 | 2.06 | 3.01 | $ 28.00 | $ 58,240 |
| Watertown-Fort Drum, NY | 70 | 1.83 | 2.68 | $ 22.11 | $ 45,990 |
| New Bedford, MA | 110 | 1.77 | 2.58 | $ 26.67 | $ 55,480 |
| Alexandria, LA | 100 | 1.76 | 2.58 | $ 23.86 | $ 49,630 |
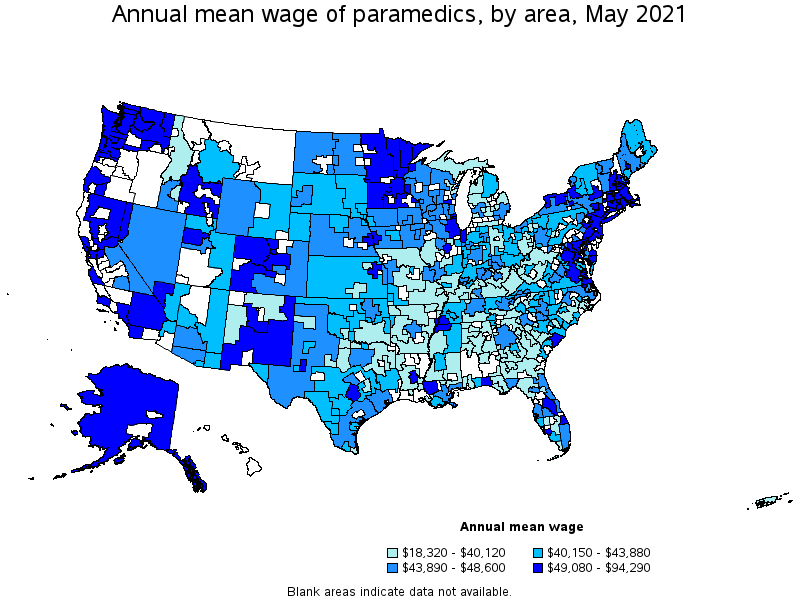
Top paying metropolitan areas for Paramedics:
| Metropolitan area | Employment (1) | Employment per thousand jobs | Location quotient (9) | Hourly mean wage | Annual mean wage (2) |
|---|---|---|---|---|---|
| Seattle-Tacoma-Bellevue, WA | 960 | 0.50 | 0.73 | $ 45.33 | $ 94,290 |
| Longview, WA | 40 | 1.05 | 1.53 | $ 41.32 | $ 85,940 |
| Olympia-Tumwater, WA | 100 | 0.85 | 1.24 | $ 41.12 | $ 85,530 |
| Bremerton-Silverdale, WA | 90 | 1.04 | 1.52 | $ 41.06 | $ 85,400 |
| Bellingham, WA | 60 | 0.68 | 0.99 | $ 40.83 | $ 84,930 |
| Mount Vernon-Anacortes, WA | 60 | 1.17 | 1.71 | $ 36.92 | $ 76,790 |
| Barnstable Town, MA | 70 | 0.73 | 1.07 | $ 36.47 | $ 75,860 |
| Kennewick-Richland, WA | 80 | 0.68 | 0.99 | $ 36.11 | $ 75,120 |
| Fond du Lac, WI | 40 | 0.90 | 1.31 | $ 36.05 | $ 74,990 |
| Portland-Vancouver-Hillsboro, OR-WA | 480 | 0.42 | 0.62 | $ 35.91 | $ 74,690 |
Nonmetropolitan areas with the highest employment in Paramedics:
| Nonmetropolitan area | Employment (1) | Employment per thousand jobs | Location quotient (9) | Hourly mean wage | Annual mean wage (2) |
|---|---|---|---|---|---|
| Piedmont North Carolina nonmetropolitan area | 500 | 2.06 | 3.00 | $ 19.36 | $ 40,270 |
| Southeast Coastal North Carolina nonmetropolitan area | 440 | 1.85 | 2.70 | $ 18.47 | $ 38,410 |
| Kansas nonmetropolitan area | 390 | 1.03 | 1.50 | $ 19.95 | $ 41,490 |
| North Northeastern Ohio nonmetropolitan area (noncontiguous) | 370 | 1.18 | 1.72 | $ 20.54 | $ 42,720 |
| Southeast Oklahoma nonmetropolitan area | 340 | 2.11 | 3.09 | $ 18.89 | $ 39,300 |
Nonmetropolitan areas with the highest concentration of jobs and location quotients in Paramedics:
| Nonmetropolitan area | Employment (1) | Employment per thousand jobs | Location quotient (9) | Hourly mean wage | Annual mean wage (2) |
|---|---|---|---|---|---|
| Mountain North Carolina nonmetropolitan area | 330 | 2.62 | 3.82 | $ 18.44 | $ 38,360 |
| North Florida nonmetropolitan area | 290 | 2.47 | 3.61 | $ 15.40 | $ 32,020 |
| Southern West Virginia nonmetropolitan area | 160 | 2.43 | 3.54 | $ 18.53 | $ 38,540 |
| South Central Tennessee nonmetropolitan area | 220 | 2.15 | 3.13 | $ 17.96 | $ 37,350 |
| Southeast Oklahoma nonmetropolitan area | 340 | 2.11 | 3.09 | $ 18.89 | $ 39,300 |
Top paying nonmetropolitan areas for Paramedics:
| Nonmetropolitan area | Employment (1) | Employment per thousand jobs | Location quotient (9) | Hourly mean wage | Annual mean wage (2) |
|---|---|---|---|---|---|
| Western Washington nonmetropolitan area | 230 | 1.91 | 2.79 | $ 32.25 | $ 67,070 |
| Alaska nonmetropolitan area | 40 | 0.46 | 0.67 | $ 30.98 | $ 64,450 |
| North Valley-Northern Mountains Region of California nonmetropolitan area | 50 | 0.53 | 0.77 | $ 30.96 | $ 64,400 |
| Massachusetts nonmetropolitan area | 100 | 1.73 | 2.52 | $ 28.55 | $ 59,390 |
| Southwest Minnesota nonmetropolitan area | 60 | 0.55 | 0.81 | $ 28.26 | $ 58,770 |
These estimates are calculated with data collected from employers in all industry sectors, all metropolitan and nonmetropolitan areas, and all states and the District of Columbia. The top employment and wage figures are provided above. The complete list is available in the downloadable XLS files.
The percentile wage estimate is the value of a wage below which a certain percent of workers fall. The median wage is the 50th percentile wage estimate—50 percent of workers earn less than the median and 50 percent of workers earn more than the median. More about percentile wages.
(1) Estimates for detailed occupations do not sum to the totals because the totals include occupations not shown separately. Estimates do not include self-employed workers.
(2) Annual wages have been calculated by multiplying the hourly mean wage by a "year-round, full-time" hours figure of 2,080 hours; for those occupations where there is not an hourly wage published, the annual wage has been directly calculated from the reported survey data.
(3) The relative standard error (RSE) is a measure of the reliability of a survey statistic. The smaller the relative standard error, the more precise the estimate.
(7) The value is less than .005 percent of industry employment.
(9) The location quotient is the ratio of the area concentration of occupational employment to the national average concentration. A location quotient greater than one indicates the occupation has a higher share of employment than average, and a location quotient less than one indicates the occupation is less prevalent in the area than average.
Other OEWS estimates and related information:
May 2021 National Occupational Employment and Wage Estimates
May 2021 State Occupational Employment and Wage Estimates
May 2021 Metropolitan and Nonmetropolitan Area Occupational Employment and Wage Estimates
May 2021 National Industry-Specific Occupational Employment and Wage Estimates
Last Modified Date: March 31, 2022