
An official website of the United States government
An official website of the United States government
The .gov means it's official.
Federal government websites often end in .gov or .mil. Before sharing sensitive information,
make sure you're on a federal government site.
The site is secure.
The
https:// ensures that you are connecting to the official website and that any
information you provide is encrypted and transmitted securely.
Compile, process, and maintain medical records of hospital and clinic patients in a manner consistent with medical, administrative, ethical, legal, and regulatory requirements of the healthcare system. Classify medical and healthcare concepts, including diagnosis, procedures, medical services, and equipment, into the healthcare industry�s numerical coding system. Includes medical coders. Excludes �Health Information Technologists and Medical Registrars� (29-9021) and �File Clerks� (43-4071).
Employment estimate and mean wage estimates for Medical Records Specialists:
| Employment (1) | Employment RSE (3) |
Mean hourly wage |
Mean annual wage (2) |
Wage RSE (3) |
|---|---|---|---|---|
| 180,570 | 1.5 % | $ 23.23 | $ 48,310 | 0.4 % |
Percentile wage estimates for Medical Records Specialists:
| Percentile | 10% | 25% | 50% (Median) |
75% | 90% |
|---|---|---|---|---|---|
| Hourly Wage | $ 14.15 | $ 17.75 | $ 22.43 | $ 28.43 | $ 35.67 |
| Annual Wage (2) | $ 29,430 | $ 36,930 | $ 46,660 | $ 59,120 | $ 74,200 |
Industries with the highest published employment and wages for Medical Records Specialists are provided. For a list of all industries with employment in Medical Records Specialists, see the Create Customized Tables function.
Industries with the highest levels of employment in Medical Records Specialists:
| Industry | Employment (1) | Percent of industry employment | Hourly mean wage | Annual mean wage (2) |
|---|---|---|---|---|
| General Medical and Surgical Hospitals | 49,610 | 0.89 | $ 24.58 | $ 51,120 |
| Offices of Physicians | 35,410 | 1.31 | $ 19.49 | $ 40,540 |
| Management of Companies and Enterprises | 16,210 | 0.64 | $ 26.58 | $ 55,290 |
| Accounting, Tax Preparation, Bookkeeping, and Payroll Services | 9,280 | 0.92 | $ 23.19 | $ 48,240 |
| Nursing Care Facilities (Skilled Nursing Facilities) | 8,450 | 0.60 | $ 20.39 | $ 42,410 |
Industries with the highest concentration of employment in Medical Records Specialists:
| Industry | Employment (1) | Percent of industry employment | Hourly mean wage | Annual mean wage (2) |
|---|---|---|---|---|
| Offices of Physicians | 35,410 | 1.31 | $ 19.49 | $ 40,540 |
| Office Administrative Services | 6,160 | 1.27 | $ 23.73 | $ 49,360 |
| Accounting, Tax Preparation, Bookkeeping, and Payroll Services | 9,280 | 0.92 | $ 23.19 | $ 48,240 |
| General Medical and Surgical Hospitals | 49,610 | 0.89 | $ 24.58 | $ 51,120 |
| Outpatient Care Centers | 7,010 | 0.71 | $ 22.95 | $ 47,730 |
Top paying industries for Medical Records Specialists:
| Industry | Employment (1) | Percent of industry employment | Hourly mean wage | Annual mean wage (2) |
|---|---|---|---|---|
| Insurance Carriers | 3,540 | 0.29 | $ 30.85 | $ 64,170 |
| Scientific Research and Development Services | 640 | 0.08 | $ 29.37 | $ 61,080 |
| Electronic Shopping and Mail-Order Houses | (8) | (8) | $ 28.47 | $ 59,210 |
| Other Professional, Scientific, and Technical Services | (8) | (8) | $ 28.27 | $ 58,800 |
| Management, Scientific, and Technical Consulting Services | 3,480 | 0.22 | $ 27.66 | $ 57,530 |
States and areas with the highest published employment, location quotients, and wages for Medical Records Specialists are provided. For a list of all areas with employment in Medical Records Specialists, see the Create Customized Tables function.
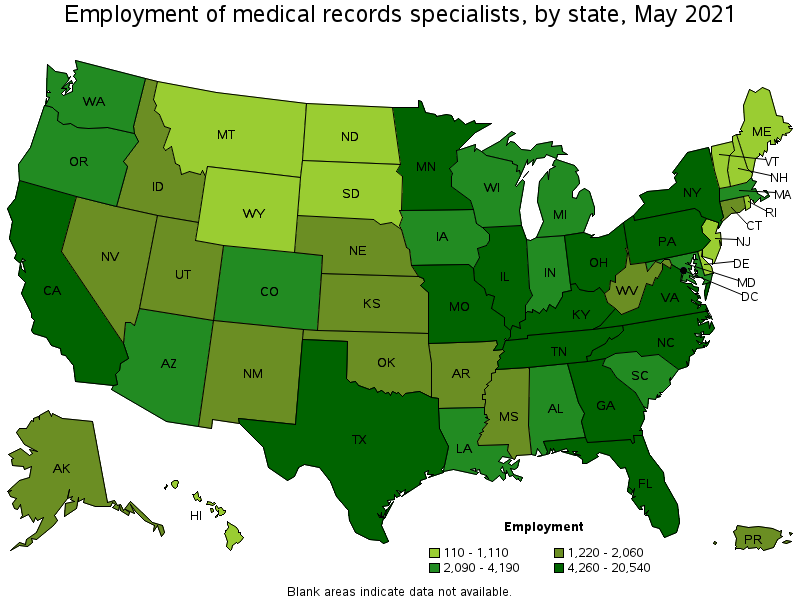
States with the highest employment level in Medical Records Specialists:
| State | Employment (1) | Employment per thousand jobs | Location quotient (9) | Hourly mean wage | Annual mean wage (2) |
|---|---|---|---|---|---|
| Texas | 20,540 | 1.68 | 1.31 | $ 21.38 | $ 44,470 |
| California | 18,580 | 1.12 | 0.88 | $ 27.86 | $ 57,950 |
| Florida | 15,370 | 1.79 | 1.39 | $ 21.60 | $ 44,930 |
| Ohio | 7,990 | 1.54 | 1.20 | $ 22.28 | $ 46,340 |
| New York | 7,340 | 0.85 | 0.66 | $ 26.61 | $ 55,350 |
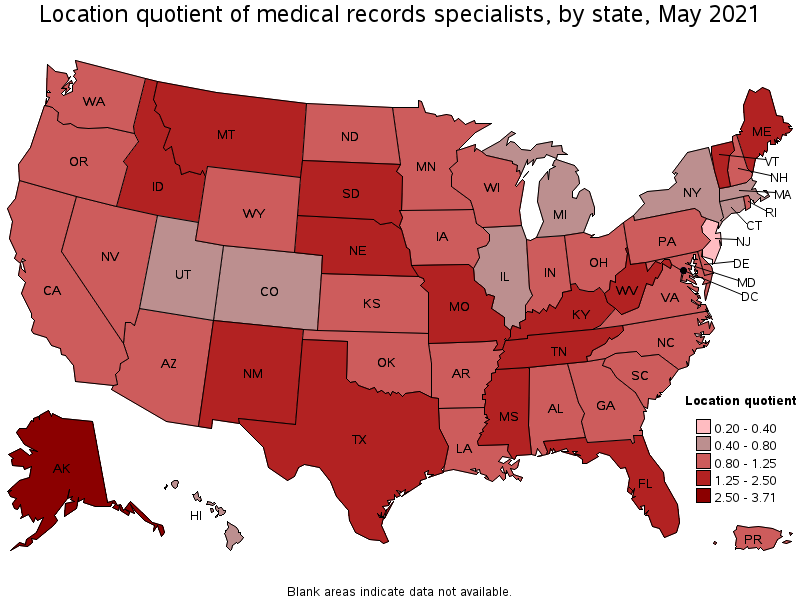
States with the highest concentration of jobs and location quotients in Medical Records Specialists:
| State | Employment (1) | Employment per thousand jobs | Location quotient (9) | Hourly mean wage | Annual mean wage (2) |
|---|---|---|---|---|---|
| Alaska | 1,410 | 4.76 | 3.71 | $ 26.22 | $ 54,540 |
| South Dakota | 1,110 | 2.62 | 2.05 | $ 22.68 | $ 47,160 |
| Kentucky | 4,260 | 2.31 | 1.81 | $ 20.86 | $ 43,390 |
| West Virginia | 1,450 | 2.20 | 1.72 | $ 19.83 | $ 41,250 |
| Mississippi | 2,060 | 1.87 | 1.46 | $ 18.27 | $ 37,990 |
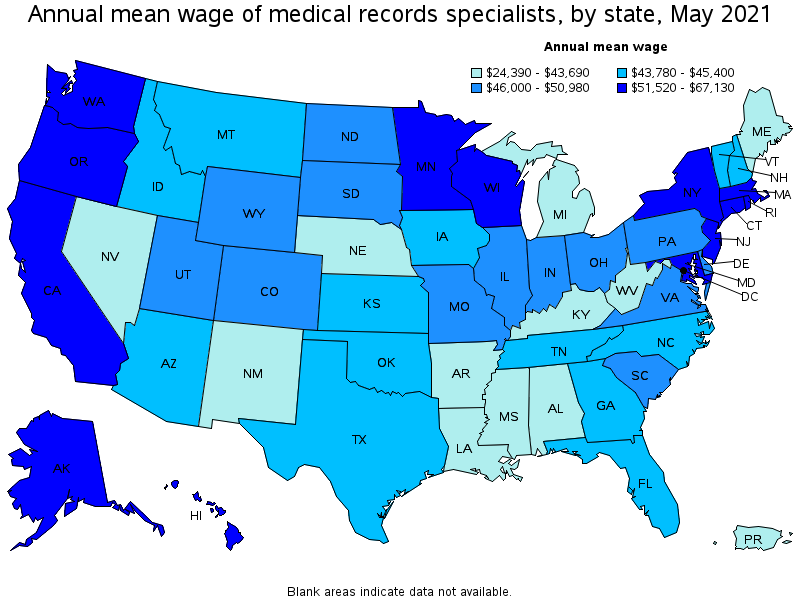
Top paying states for Medical Records Specialists:
| State | Employment (1) | Employment per thousand jobs | Location quotient (9) | Hourly mean wage | Annual mean wage (2) |
|---|---|---|---|---|---|
| New Jersey | 1,090 | 0.28 | 0.22 | $ 32.28 | $ 67,130 |
| District of Columbia | 270 | 0.41 | 0.32 | $ 30.42 | $ 63,270 |
| Massachusetts | 3,160 | 0.93 | 0.73 | $ 28.34 | $ 58,950 |
| California | 18,580 | 1.12 | 0.88 | $ 27.86 | $ 57,950 |
| Connecticut | 1,230 | 0.78 | 0.61 | $ 27.64 | $ 57,480 |
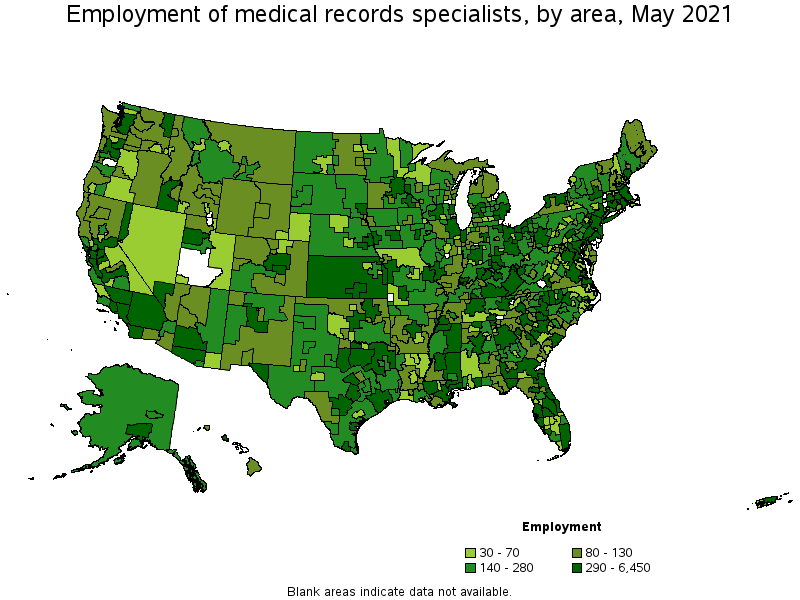
Metropolitan areas with the highest employment level in Medical Records Specialists:
| Metropolitan area | Employment (1) | Employment per thousand jobs | Location quotient (9) | Hourly mean wage | Annual mean wage (2) |
|---|---|---|---|---|---|
| Los Angeles-Long Beach-Anaheim, CA | 6,450 | 1.13 | 0.88 | $ 27.55 | $ 57,310 |
| Dallas-Fort Worth-Arlington, TX | 6,240 | 1.74 | 1.36 | $ 22.56 | $ 46,920 |
| New York-Newark-Jersey City, NY-NJ-PA | 5,270 | 0.61 | 0.47 | $ 29.31 | $ 60,960 |
| Houston-The Woodlands-Sugar Land, TX | 4,890 | 1.69 | 1.32 | $ 22.71 | $ 47,240 |
| Miami-Fort Lauderdale-West Palm Beach, FL | 3,900 | 1.59 | 1.24 | $ 21.71 | $ 45,170 |
| Chicago-Naperville-Elgin, IL-IN-WI | 3,290 | 0.78 | 0.61 | $ 24.64 | $ 51,240 |
| Phoenix-Mesa-Scottsdale, AZ | 2,850 | 1.34 | 1.05 | $ 21.46 | $ 44,640 |
| Minneapolis-St. Paul-Bloomington, MN-WI | 2,750 | 1.51 | 1.18 | $ 27.77 | $ 57,760 |
| Philadelphia-Camden-Wilmington, PA-NJ-DE-MD | 2,700 | 1.02 | 0.79 | $ 26.36 | $ 54,820 |
| Washington-Arlington-Alexandria, DC-VA-MD-WV | 2,690 | 0.92 | 0.71 | $ 28.23 | $ 58,710 |
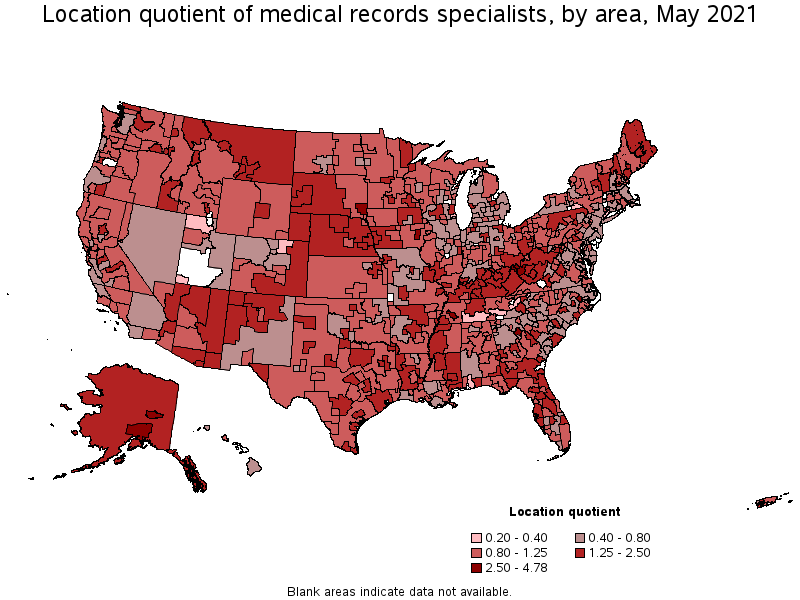
Metropolitan areas with the highest concentration of jobs and location quotients in Medical Records Specialists:
| Metropolitan area | Employment (1) | Employment per thousand jobs | Location quotient (9) | Hourly mean wage | Annual mean wage (2) |
|---|---|---|---|---|---|
| Fairbanks, AK | 210 | 6.13 | 4.78 | $ 24.80 | $ 51,580 |
| Anchorage, AK | 940 | 5.84 | 4.55 | $ 26.37 | $ 54,850 |
| Athens-Clarke County, GA | 350 | 4.05 | 3.16 | $ 21.23 | $ 44,150 |
| Greenville, NC | 280 | 3.68 | 2.87 | $ 21.62 | $ 44,970 |
| Iowa City, IA | 310 | 3.60 | 2.81 | $ 26.54 | $ 55,190 |
| Jackson, TN | 240 | 3.58 | 2.79 | $ 19.64 | $ 40,850 |
| Sioux Falls, SD | 540 | 3.45 | 2.69 | $ 24.08 | $ 50,090 |
| Huntington-Ashland, WV-KY-OH | 400 | 3.21 | 2.50 | $ 21.74 | $ 45,230 |
| Hattiesburg, MS | 190 | 3.17 | 2.47 | $ 17.02 | $ 35,400 |
| Roanoke, VA | 440 | 3.05 | 2.38 | $ 21.45 | $ 44,610 |
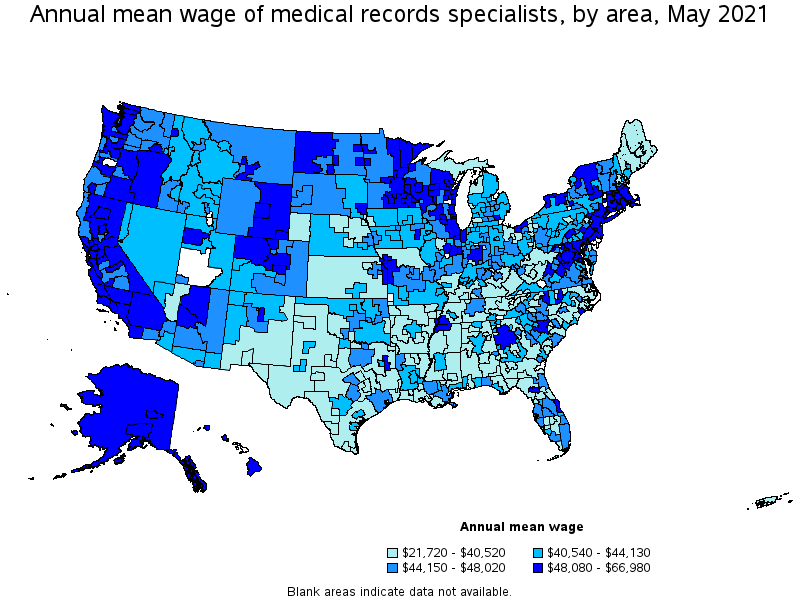
Top paying metropolitan areas for Medical Records Specialists:
| Metropolitan area | Employment (1) | Employment per thousand jobs | Location quotient (9) | Hourly mean wage | Annual mean wage (2) |
|---|---|---|---|---|---|
| San Francisco-Oakland-Hayward, CA | 2,320 | 1.04 | 0.81 | $ 32.20 | $ 66,980 |
| San Jose-Sunnyvale-Santa Clara, CA | 920 | 0.86 | 0.67 | $ 32.16 | $ 66,900 |
| Stockton-Lodi, CA | 390 | 1.52 | 1.19 | $ 31.72 | $ 65,990 |
| Trenton, NJ | 80 | 0.33 | 0.26 | $ 31.22 | $ 64,930 |
| Sacramento--Roseville--Arden-Arcade, CA | 1,200 | 1.22 | 0.95 | $ 30.16 | $ 62,730 |
| Vallejo-Fairfield, CA | 190 | 1.48 | 1.16 | $ 29.37 | $ 61,090 |
| Boston-Cambridge-Nashua, MA-NH | 2,270 | 0.88 | 0.69 | $ 29.35 | $ 61,050 |
| New York-Newark-Jersey City, NY-NJ-PA | 5,270 | 0.61 | 0.47 | $ 29.31 | $ 60,960 |
| Barnstable Town, MA | 80 | 0.85 | 0.67 | $ 29.05 | $ 60,420 |
| Seattle-Tacoma-Bellevue, WA | 1,810 | 0.95 | 0.74 | $ 28.98 | $ 60,270 |
Nonmetropolitan areas with the highest employment in Medical Records Specialists:
| Nonmetropolitan area | Employment (1) | Employment per thousand jobs | Location quotient (9) | Hourly mean wage | Annual mean wage (2) |
|---|---|---|---|---|---|
| Kansas nonmetropolitan area | 590 | 1.58 | 1.23 | $ 18.91 | $ 39,330 |
| North Northeastern Ohio nonmetropolitan area (noncontiguous) | 360 | 1.15 | 0.89 | $ 19.45 | $ 40,450 |
| Northeast Mississippi nonmetropolitan area | 330 | 1.51 | 1.17 | $ 17.27 | $ 35,930 |
| South Georgia nonmetropolitan area | 320 | 1.75 | 1.37 | $ 17.83 | $ 37,080 |
| North Texas Region of Texas nonmetropolitan area | 310 | 1.17 | 0.91 | $ 18.27 | $ 38,000 |
Nonmetropolitan areas with the highest concentration of jobs and location quotients in Medical Records Specialists:
| Nonmetropolitan area | Employment (1) | Employment per thousand jobs | Location quotient (9) | Hourly mean wage | Annual mean wage (2) |
|---|---|---|---|---|---|
| East Kentucky nonmetropolitan area | 290 | 3.01 | 2.35 | $ 17.30 | $ 35,970 |
| West South Dakota nonmetropolitan area | 170 | 2.79 | 2.18 | $ 21.77 | $ 45,270 |
| Northern New Mexico nonmetropolitan area | 200 | 2.65 | 2.07 | $ 20.17 | $ 41,950 |
| Southern Vermont nonmetropolitan area | 250 | 2.64 | 2.06 | $ 21.56 | $ 44,850 |
| Arizona nonmetropolitan area | 230 | 2.56 | 2.00 | $ 21.67 | $ 45,070 |
Top paying nonmetropolitan areas for Medical Records Specialists:
| Nonmetropolitan area | Employment (1) | Employment per thousand jobs | Location quotient (9) | Hourly mean wage | Annual mean wage (2) |
|---|---|---|---|---|---|
| Northwest Virginia nonmetropolitan area | 40 | 0.72 | 0.56 | $ 27.76 | $ 57,750 |
| Alaska nonmetropolitan area | 250 | 2.53 | 1.98 | $ 27.03 | $ 56,220 |
| Central Oregon nonmetropolitan area | 70 | 1.19 | 0.93 | $ 26.17 | $ 54,430 |
| Eastern Sierra-Mother Lode Region of California nonmetropolitan area | 60 | 1.13 | 0.88 | $ 25.75 | $ 53,560 |
| West North Dakota nonmetropolitan area | 150 | 1.40 | 1.09 | $ 24.76 | $ 51,510 |
These estimates are calculated with data collected from employers in all industry sectors, all metropolitan and nonmetropolitan areas, and all states and the District of Columbia. The top employment and wage figures are provided above. The complete list is available in the downloadable XLS files.
The percentile wage estimate is the value of a wage below which a certain percent of workers fall. The median wage is the 50th percentile wage estimate—50 percent of workers earn less than the median and 50 percent of workers earn more than the median. More about percentile wages.
(1) Estimates for detailed occupations do not sum to the totals because the totals include occupations not shown separately. Estimates do not include self-employed workers.
(2) Annual wages have been calculated by multiplying the hourly mean wage by a "year-round, full-time" hours figure of 2,080 hours; for those occupations where there is not an hourly wage published, the annual wage has been directly calculated from the reported survey data.
(3) The relative standard error (RSE) is a measure of the reliability of a survey statistic. The smaller the relative standard error, the more precise the estimate.
(8) Estimate not released.
(9) The location quotient is the ratio of the area concentration of occupational employment to the national average concentration. A location quotient greater than one indicates the occupation has a higher share of employment than average, and a location quotient less than one indicates the occupation is less prevalent in the area than average.
Other OEWS estimates and related information:
May 2021 National Occupational Employment and Wage Estimates
May 2021 State Occupational Employment and Wage Estimates
May 2021 Metropolitan and Nonmetropolitan Area Occupational Employment and Wage Estimates
May 2021 National Industry-Specific Occupational Employment and Wage Estimates
Last Modified Date: March 31, 2022