
An official website of the United States government
An official website of the United States government
The .gov means it's official.
Federal government websites often end in .gov or .mil. Before sharing sensitive information,
make sure you're on a federal government site.
The site is secure.
The
https:// ensures that you are connecting to the official website and that any
information you provide is encrypted and transmitted securely.
Design, measure, fit, and adapt lenses and frames for client according to written optical prescription or specification. Assist client with inserting, removing, and caring for contact lenses. Assist client with selecting frames. Measure customer for size of eyeglasses and coordinate frames with facial and eye measurements and optical prescription. Prepare work order for optical laboratory containing instructions for grinding and mounting lenses in frames. Verify exactness of finished lens spectacles. Adjust frame and lens position to fit client. May shape or reshape frames. Includes contact lens opticians.
Employment estimate and mean wage estimates for Opticians, Dispensing:
| Employment (1) | Employment RSE (3) |
Mean hourly wage |
Mean annual wage (2) |
Wage RSE (3) |
|---|---|---|---|---|
| 73,270 | 1.9 % | $ 20.70 | $ 43,060 | 1.2 % |
Percentile wage estimates for Opticians, Dispensing:
| Percentile | 10% | 25% | 50% (Median) |
75% | 90% |
|---|---|---|---|---|---|
| Hourly Wage | $ 13.90 | $ 14.57 | $ 18.06 | $ 22.91 | $ 28.98 |
| Annual Wage (2) | $ 28,910 | $ 30,310 | $ 37,570 | $ 47,660 | $ 60,280 |
Industries with the highest published employment and wages for Opticians, Dispensing are provided. For a list of all industries with employment in Opticians, Dispensing, see the Create Customized Tables function.
Industries with the highest levels of employment in Opticians, Dispensing:
| Industry | Employment (1) | Percent of industry employment | Hourly mean wage | Annual mean wage (2) |
|---|---|---|---|---|
| Offices of Other Health Practitioners | 29,470 | 3.03 | $ 18.68 | $ 38,860 |
| Health and Personal Care Stores | 18,110 | 1.79 | $ 22.20 | $ 46,180 |
| General Merchandise Stores | 14,040 | 0.46 | $ 21.76 | $ 45,260 |
| Offices of Physicians | 9,250 | 0.34 | $ 20.83 | $ 43,320 |
| Outpatient Care Centers | 1,380 | 0.14 | (8) | (8) |
Industries with the highest concentration of employment in Opticians, Dispensing:
| Industry | Employment (1) | Percent of industry employment | Hourly mean wage | Annual mean wage (2) |
|---|---|---|---|---|
| Offices of Other Health Practitioners | 29,470 | 3.03 | $ 18.68 | $ 38,860 |
| Health and Personal Care Stores | 18,110 | 1.79 | $ 22.20 | $ 46,180 |
| General Merchandise Stores | 14,040 | 0.46 | $ 21.76 | $ 45,260 |
| Offices of Physicians | 9,250 | 0.34 | $ 20.83 | $ 43,320 |
| Outpatient Care Centers | 1,380 | 0.14 | (8) | (8) |
Top paying industries for Opticians, Dispensing:
| Industry | Employment (1) | Percent of industry employment | Hourly mean wage | Annual mean wage (2) |
|---|---|---|---|---|
| Management of Companies and Enterprises | (8) | (8) | $ 25.39 | $ 52,820 |
| Professional and Commercial Equipment and Supplies Merchant Wholesalers | 110 | 0.02 | $ 24.18 | $ 50,280 |
| General Medical and Surgical Hospitals | 240 | (7) | $ 23.78 | $ 49,460 |
| Medical Equipment and Supplies Manufacturing | 60 | 0.02 | $ 22.43 | $ 46,660 |
| Colleges, Universities, and Professional Schools | 260 | 0.01 | $ 22.41 | $ 46,610 |
States and areas with the highest published employment, location quotients, and wages for Opticians, Dispensing are provided. For a list of all areas with employment in Opticians, Dispensing, see the Create Customized Tables function.
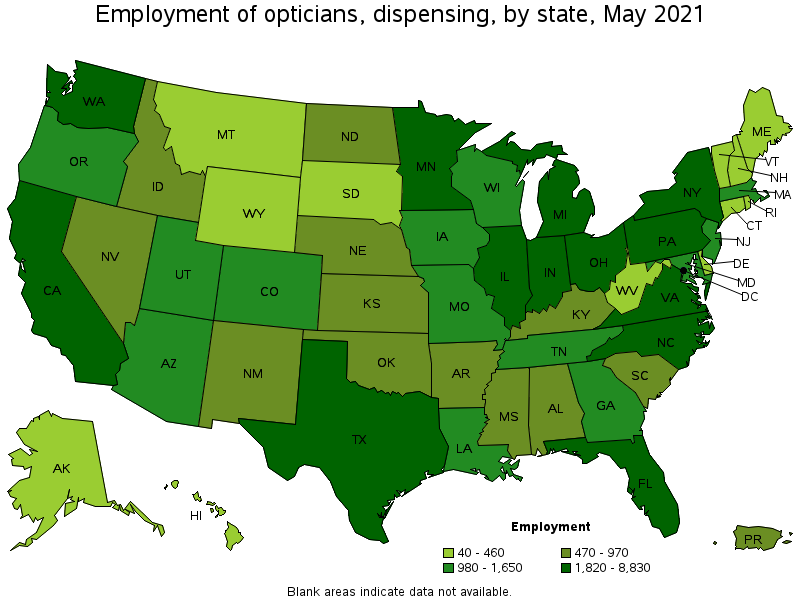
States with the highest employment level in Opticians, Dispensing:
| State | Employment (1) | Employment per thousand jobs | Location quotient (9) | Hourly mean wage | Annual mean wage (2) |
|---|---|---|---|---|---|
| California | 8,830 | 0.53 | 1.03 | $ 25.69 | $ 53,440 |
| Texas | 5,060 | 0.41 | 0.80 | $ 16.37 | $ 34,040 |
| Florida | 4,010 | 0.47 | 0.90 | $ 20.83 | $ 43,330 |
| Michigan | 3,840 | 0.95 | 1.82 | $ 18.44 | $ 38,360 |
| New York | 3,810 | 0.44 | 0.85 | $ 27.23 | $ 56,640 |
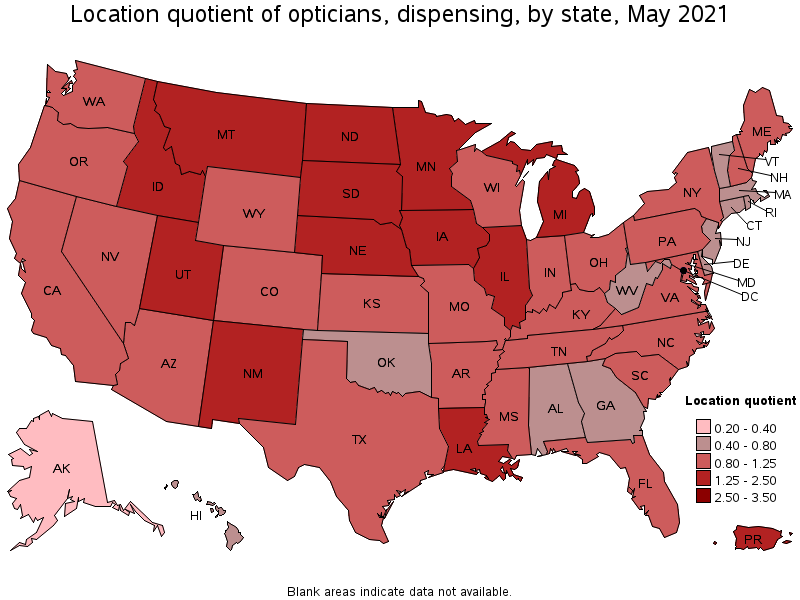
States with the highest concentration of jobs and location quotients in Opticians, Dispensing:
| State | Employment (1) | Employment per thousand jobs | Location quotient (9) | Hourly mean wage | Annual mean wage (2) |
|---|---|---|---|---|---|
| North Dakota | 500 | 1.27 | 2.43 | $ 18.53 | $ 38,540 |
| South Dakota | 410 | 0.98 | 1.89 | $ 16.58 | $ 34,480 |
| Michigan | 3,840 | 0.95 | 1.82 | $ 18.44 | $ 38,360 |
| New Mexico | 700 | 0.90 | 1.74 | $ 18.05 | $ 37,540 |
| Utah | 1,260 | 0.81 | 1.56 | $ 16.10 | $ 33,490 |
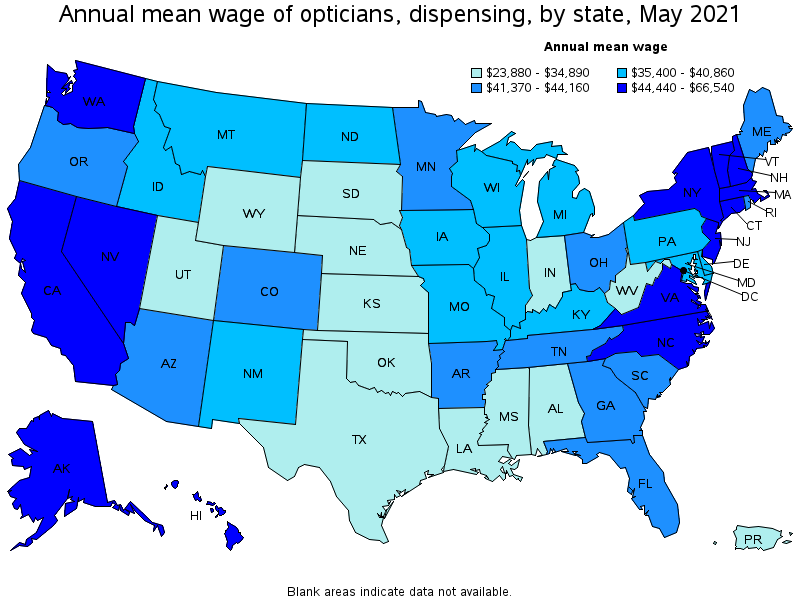
Top paying states for Opticians, Dispensing:
| State | Employment (1) | Employment per thousand jobs | Location quotient (9) | Hourly mean wage | Annual mean wage (2) |
|---|---|---|---|---|---|
| Connecticut | 460 | 0.29 | 0.56 | $ 31.99 | $ 66,540 |
| New Jersey | 1,290 | 0.34 | 0.65 | $ 29.95 | $ 62,300 |
| Massachusetts | 1,240 | 0.36 | 0.70 | $ 28.77 | $ 59,840 |
| New York | 3,810 | 0.44 | 0.85 | $ 27.23 | $ 56,640 |
| Alaska | 40 | 0.13 | 0.26 | $ 26.87 | $ 55,900 |
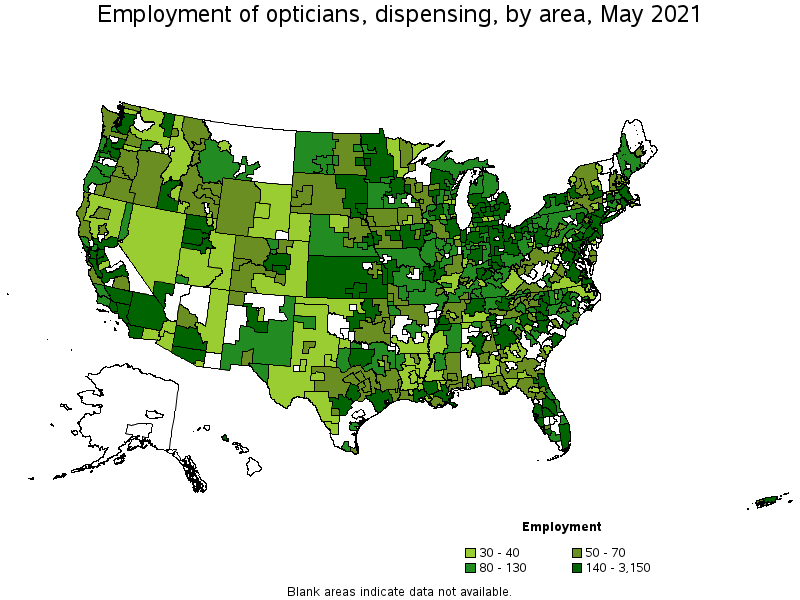
Metropolitan areas with the highest employment level in Opticians, Dispensing:
| Metropolitan area | Employment (1) | Employment per thousand jobs | Location quotient (9) | Hourly mean wage | Annual mean wage (2) |
|---|---|---|---|---|---|
| New York-Newark-Jersey City, NY-NJ-PA | 3,150 | 0.36 | 0.70 | $ 29.56 | $ 61,480 |
| Los Angeles-Long Beach-Anaheim, CA | 2,730 | 0.48 | 0.92 | $ 26.16 | $ 54,420 |
| Chicago-Naperville-Elgin, IL-IN-WI | 2,590 | 0.61 | 1.18 | $ 18.31 | $ 38,090 |
| Detroit-Warren-Dearborn, MI | 1,990 | 1.10 | 2.12 | $ 19.26 | $ 40,060 |
| Dallas-Fort Worth-Arlington, TX | 1,410 | 0.39 | 0.76 | $ 17.03 | $ 35,410 |
| Washington-Arlington-Alexandria, DC-VA-MD-WV | 1,210 | 0.41 | 0.79 | $ 24.22 | $ 50,380 |
| Philadelphia-Camden-Wilmington, PA-NJ-DE-MD | 1,190 | 0.45 | 0.86 | $ 20.12 | $ 41,850 |
| San Francisco-Oakland-Hayward, CA | 1,130 | 0.50 | 0.97 | $ 28.36 | $ 58,980 |
| Riverside-San Bernardino-Ontario, CA | 1,090 | 0.71 | 1.37 | $ 23.86 | $ 49,620 |
| Houston-The Woodlands-Sugar Land, TX | 1,060 | 0.37 | 0.70 | $ 16.08 | $ 33,440 |
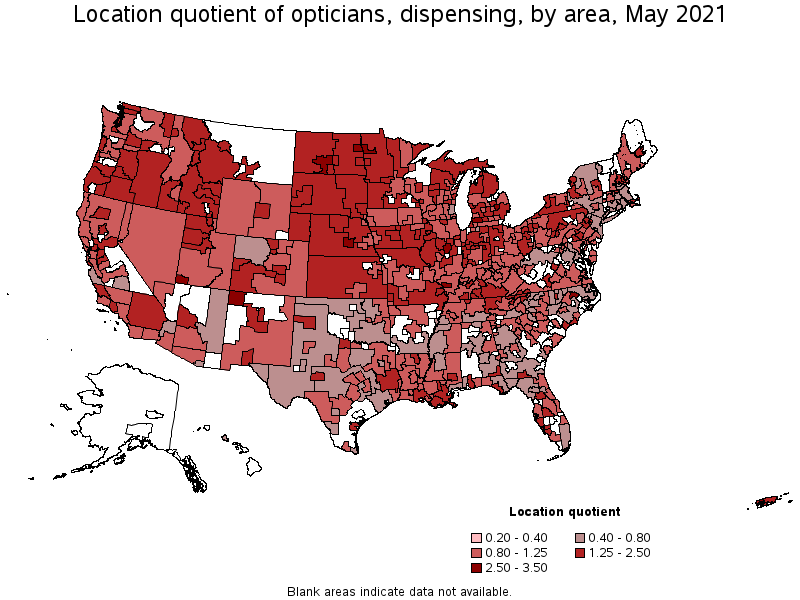
Metropolitan areas with the highest concentration of jobs and location quotients in Opticians, Dispensing:
| Metropolitan area | Employment (1) | Employment per thousand jobs | Location quotient (9) | Hourly mean wage | Annual mean wage (2) |
|---|---|---|---|---|---|
| St. George, UT | 130 | 1.77 | 3.40 | $ 16.20 | $ 33,690 |
| Grand Forks, ND-MN | 80 | 1.72 | 3.31 | $ 18.19 | $ 37,840 |
| Carbondale-Marion, IL | 80 | 1.64 | 3.15 | $ 15.57 | $ 32,390 |
| Bismarck, ND | 110 | 1.62 | 3.11 | $ 18.96 | $ 39,430 |
| Farmington, NM | 60 | 1.57 | 3.01 | $ 17.37 | $ 36,120 |
| Muncie, IN | 70 | 1.50 | 2.89 | $ 15.40 | $ 32,020 |
| Rocky Mount, NC | 80 | 1.47 | 2.83 | $ 18.23 | $ 37,910 |
| Grand Island, NE | 60 | 1.45 | 2.78 | $ 15.33 | $ 31,890 |
| Bloomington, IL | 120 | 1.42 | 2.72 | $ 15.59 | $ 32,430 |
| Flint, MI | 170 | 1.37 | 2.64 | $ 18.16 | $ 37,770 |
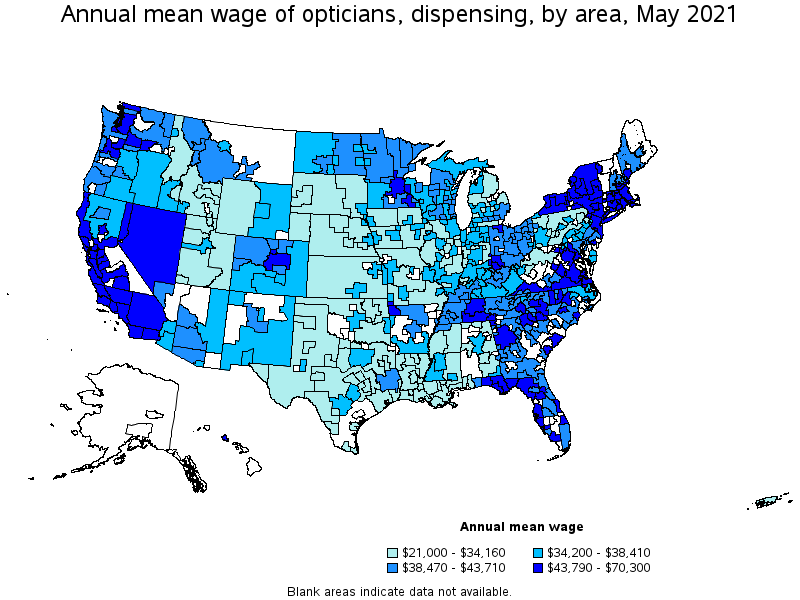
Top paying metropolitan areas for Opticians, Dispensing:
| Metropolitan area | Employment (1) | Employment per thousand jobs | Location quotient (9) | Hourly mean wage | Annual mean wage (2) |
|---|---|---|---|---|---|
| Bridgeport-Stamford-Norwalk, CT | 120 | 0.32 | 0.61 | $ 33.80 | $ 70,300 |
| New Haven, CT | 90 | 0.34 | 0.65 | $ 33.40 | $ 69,460 |
| Hartford-West Hartford-East Hartford, CT | 110 | 0.21 | 0.40 | $ 31.25 | $ 65,010 |
| Barnstable Town, MA | 60 | 0.66 | 1.27 | $ 29.95 | $ 62,300 |
| New York-Newark-Jersey City, NY-NJ-PA | 3,150 | 0.36 | 0.70 | $ 29.56 | $ 61,480 |
| Trenton, NJ | 70 | 0.30 | 0.59 | $ 29.10 | $ 60,530 |
| Springfield, MA-CT | 150 | 0.47 | 0.91 | $ 28.73 | $ 59,750 |
| Norwich-New London-Westerly, CT-RI | 40 | 0.31 | 0.59 | $ 28.64 | $ 59,580 |
| New Bedford, MA | 40 | 0.59 | 1.13 | $ 28.61 | $ 59,510 |
| San Francisco-Oakland-Hayward, CA | 1,130 | 0.50 | 0.97 | $ 28.36 | $ 58,980 |
Nonmetropolitan areas with the highest employment in Opticians, Dispensing:
| Nonmetropolitan area | Employment (1) | Employment per thousand jobs | Location quotient (9) | Hourly mean wage | Annual mean wage (2) |
|---|---|---|---|---|---|
| Kansas nonmetropolitan area | 250 | 0.66 | 1.26 | $ 15.66 | $ 32,570 |
| West Northwestern Ohio nonmetropolitan area | 180 | 0.77 | 1.48 | $ 19.97 | $ 41,540 |
| North Northeastern Ohio nonmetropolitan area (noncontiguous) | 180 | 0.57 | 1.10 | $ 19.78 | $ 41,150 |
| Northeastern Wisconsin nonmetropolitan area | 180 | 0.92 | 1.77 | $ 19.86 | $ 41,310 |
| Southeast Iowa nonmetropolitan area | 160 | 0.76 | 1.46 | $ 16.20 | $ 33,690 |
Nonmetropolitan areas with the highest concentration of jobs and location quotients in Opticians, Dispensing:
| Nonmetropolitan area | Employment (1) | Employment per thousand jobs | Location quotient (9) | Hourly mean wage | Annual mean wage (2) |
|---|---|---|---|---|---|
| Upper Peninsula of Michigan nonmetropolitan area | 130 | 1.25 | 2.40 | $ 16.59 | $ 34,510 |
| West North Dakota nonmetropolitan area | 120 | 1.15 | 2.22 | $ 18.32 | $ 38,100 |
| Northwest Lower Peninsula of Michigan nonmetropolitan area | 130 | 1.11 | 2.14 | $ 16.55 | $ 34,420 |
| Northeast Lower Peninsula of Michigan nonmetropolitan area | 80 | 1.10 | 2.11 | $ 15.96 | $ 33,200 |
| East South Dakota nonmetropolitan area | 140 | 1.06 | 2.05 | $ 15.51 | $ 32,250 |
Top paying nonmetropolitan areas for Opticians, Dispensing:
| Nonmetropolitan area | Employment (1) | Employment per thousand jobs | Location quotient (9) | Hourly mean wage | Annual mean wage (2) |
|---|---|---|---|---|---|
| Massachusetts nonmetropolitan area | 30 | 0.59 | 1.13 | $ 32.05 | $ 66,670 |
| Central East New York nonmetropolitan area | 60 | 0.39 | 0.75 | $ 24.54 | $ 51,030 |
| Capital/Northern New York nonmetropolitan area | 50 | 0.40 | 0.77 | $ 23.93 | $ 49,780 |
| Nevada nonmetropolitan area | 40 | 0.43 | 0.83 | $ 23.54 | $ 48,960 |
| South Central Tennessee nonmetropolitan area | 40 | 0.35 | 0.67 | $ 22.53 | $ 46,870 |
These estimates are calculated with data collected from employers in all industry sectors, all metropolitan and nonmetropolitan areas, and all states and the District of Columbia. The top employment and wage figures are provided above. The complete list is available in the downloadable XLS files.
The percentile wage estimate is the value of a wage below which a certain percent of workers fall. The median wage is the 50th percentile wage estimate—50 percent of workers earn less than the median and 50 percent of workers earn more than the median. More about percentile wages.
(1) Estimates for detailed occupations do not sum to the totals because the totals include occupations not shown separately. Estimates do not include self-employed workers.
(2) Annual wages have been calculated by multiplying the hourly mean wage by a "year-round, full-time" hours figure of 2,080 hours; for those occupations where there is not an hourly wage published, the annual wage has been directly calculated from the reported survey data.
(3) The relative standard error (RSE) is a measure of the reliability of a survey statistic. The smaller the relative standard error, the more precise the estimate.
(7) The value is less than .005 percent of industry employment.
(8) Estimate not released.
(9) The location quotient is the ratio of the area concentration of occupational employment to the national average concentration. A location quotient greater than one indicates the occupation has a higher share of employment than average, and a location quotient less than one indicates the occupation is less prevalent in the area than average.
Other OEWS estimates and related information:
May 2021 National Occupational Employment and Wage Estimates
May 2021 State Occupational Employment and Wage Estimates
May 2021 Metropolitan and Nonmetropolitan Area Occupational Employment and Wage Estimates
May 2021 National Industry-Specific Occupational Employment and Wage Estimates
Last Modified Date: March 31, 2022