
An official website of the United States government
An official website of the United States government
The .gov means it's official.
Federal government websites often end in .gov or .mil. Before sharing sensitive information,
make sure you're on a federal government site.
The site is secure.
The
https:// ensures that you are connecting to the official website and that any
information you provide is encrypted and transmitted securely.
Record drugs delivered to the pharmacy, store incoming merchandise, and inform the supervisor of stock needs. May operate cash register and accept prescriptions for filling.
Employment estimate and mean wage estimates for Pharmacy Aides:
| Employment (1) | Employment RSE (3) |
Mean hourly wage |
Mean annual wage (2) |
Wage RSE (3) |
|---|---|---|---|---|
| 43,560 | 3.7 % | $ 16.61 | $ 34,560 | 1.1 % |
Percentile wage estimates for Pharmacy Aides:
| Percentile | 10% | 25% | 50% (Median) |
75% | 90% |
|---|---|---|---|---|---|
| Hourly Wage | $ 10.98 | $ 13.41 | $ 14.39 | $ 18.03 | $ 24.55 |
| Annual Wage (2) | $ 22,840 | $ 27,880 | $ 29,930 | $ 37,500 | $ 51,060 |
Industries with the highest published employment and wages for Pharmacy Aides are provided. For a list of all industries with employment in Pharmacy Aides, see the Create Customized Tables function.
Industries with the highest levels of employment in Pharmacy Aides:
| Industry | Employment (1) | Percent of industry employment | Hourly mean wage | Annual mean wage (2) |
|---|---|---|---|---|
| Health and Personal Care Stores | 27,850 | 2.76 | $ 14.39 | $ 29,920 |
| Food and Beverage Stores (4451 and 4452 only) | 3,280 | 0.11 | $ 14.07 | $ 29,260 |
| General Medical and Surgical Hospitals | 3,130 | 0.06 | $ 21.62 | $ 44,970 |
| Outpatient Care Centers | 2,610 | 0.26 | $ 29.83 | $ 62,040 |
| Electronic Shopping and Mail-Order Houses | 2,010 | 0.44 | $ 21.49 | $ 44,710 |
Industries with the highest concentration of employment in Pharmacy Aides:
| Industry | Employment (1) | Percent of industry employment | Hourly mean wage | Annual mean wage (2) |
|---|---|---|---|---|
| Health and Personal Care Stores | 27,850 | 2.76 | $ 14.39 | $ 29,920 |
| Electronic Shopping and Mail-Order Houses | 2,010 | 0.44 | $ 21.49 | $ 44,710 |
| Outpatient Care Centers | 2,610 | 0.26 | $ 29.83 | $ 62,040 |
| Food and Beverage Stores (4451 and 4452 only) | 3,280 | 0.11 | $ 14.07 | $ 29,260 |
| General Medical and Surgical Hospitals | 3,130 | 0.06 | $ 21.62 | $ 44,970 |
Top paying industries for Pharmacy Aides:
| Industry | Employment (1) | Percent of industry employment | Hourly mean wage | Annual mean wage (2) |
|---|---|---|---|---|
| Outpatient Care Centers | 2,610 | 0.26 | $ 29.83 | $ 62,040 |
| Insurance Carriers | 130 | 0.01 | $ 21.70 | $ 45,140 |
| General Medical and Surgical Hospitals | 3,130 | 0.06 | $ 21.62 | $ 44,970 |
| Electronic Shopping and Mail-Order Houses | 2,010 | 0.44 | $ 21.49 | $ 44,710 |
| State Government, excluding schools and hospitals (OEWS Designation) | 100 | (7) | $ 19.65 | $ 40,880 |
States and areas with the highest published employment, location quotients, and wages for Pharmacy Aides are provided. For a list of all areas with employment in Pharmacy Aides, see the Create Customized Tables function.
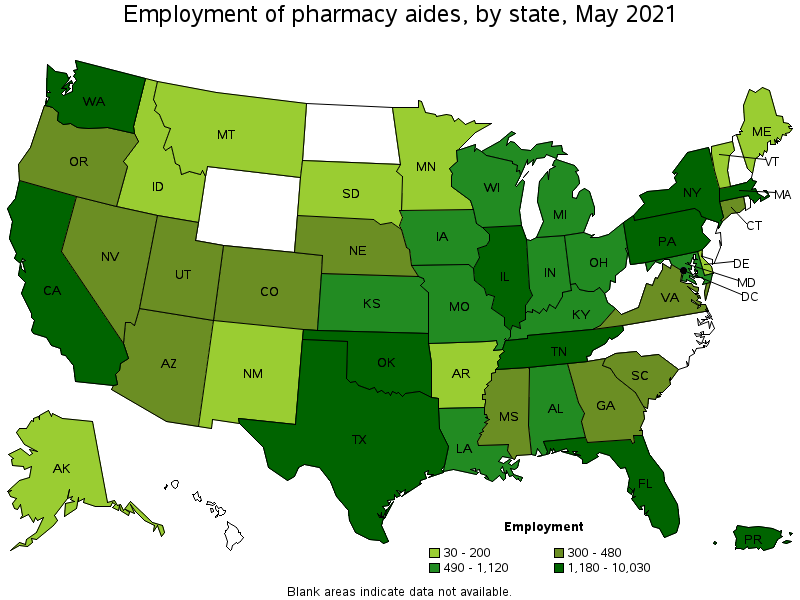
States with the highest employment level in Pharmacy Aides:
| State | Employment (1) | Employment per thousand jobs | Location quotient (9) | Hourly mean wage | Annual mean wage (2) |
|---|---|---|---|---|---|
| California | 10,030 | 0.61 | 1.96 | $ 22.68 | $ 47,170 |
| New York | 2,940 | 0.34 | 1.10 | $ 16.29 | $ 33,880 |
| Florida | 2,810 | 0.33 | 1.06 | $ 15.90 | $ 33,070 |
| Texas | 2,370 | 0.19 | 0.63 | $ 13.57 | $ 28,220 |
| Pennsylvania | 2,280 | 0.41 | 1.32 | $ 15.61 | $ 32,480 |
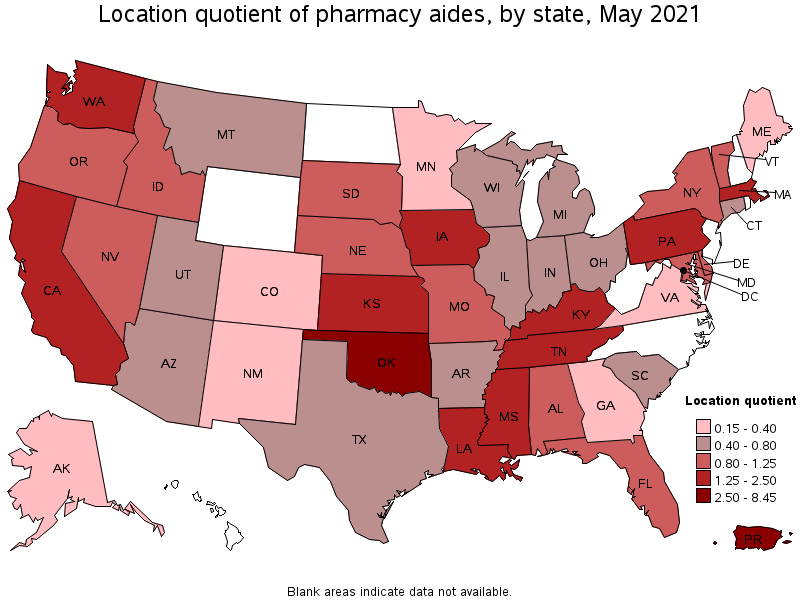
States with the highest concentration of jobs and location quotients in Pharmacy Aides:
| State | Employment (1) | Employment per thousand jobs | Location quotient (9) | Hourly mean wage | Annual mean wage (2) |
|---|---|---|---|---|---|
| Oklahoma | 1,320 | 0.85 | 2.74 | $ 12.28 | $ 25,530 |
| California | 10,030 | 0.61 | 1.96 | $ 22.68 | $ 47,170 |
| Tennessee | 1,770 | 0.59 | 1.91 | $ 11.96 | $ 24,880 |
| Washington | 1,810 | 0.56 | 1.83 | $ 17.56 | $ 36,520 |
| Louisiana | 990 | 0.55 | 1.78 | $ 11.83 | $ 24,600 |
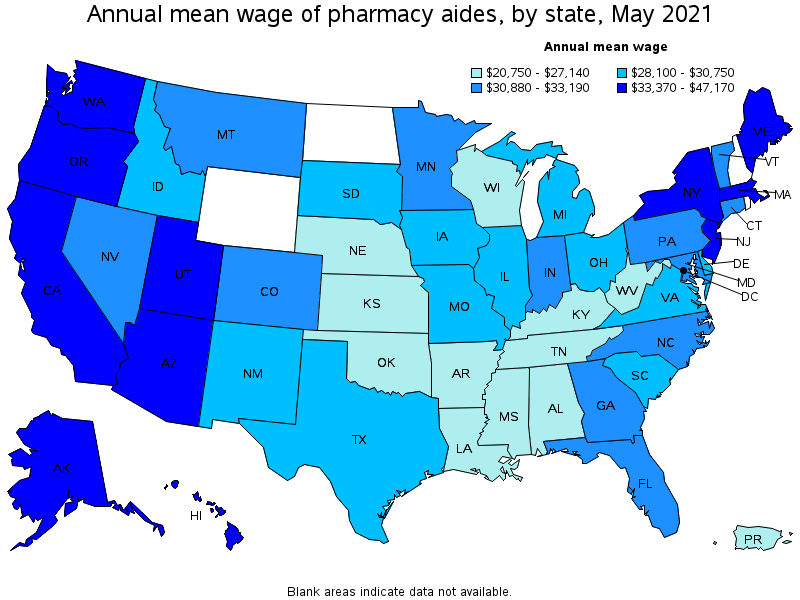
Top paying states for Pharmacy Aides:
| State | Employment (1) | Employment per thousand jobs | Location quotient (9) | Hourly mean wage | Annual mean wage (2) |
|---|---|---|---|---|---|
| California | 10,030 | 0.61 | 1.96 | $ 22.68 | $ 47,170 |
| District of Columbia | 80 | 0.12 | 0.38 | $ 22.66 | $ 47,130 |
| Utah | 300 | 0.19 | 0.63 | $ 17.92 | $ 37,280 |
| Massachusetts | 1,310 | 0.39 | 1.25 | $ 17.80 | $ 37,010 |
| Washington | 1,810 | 0.56 | 1.83 | $ 17.56 | $ 36,520 |
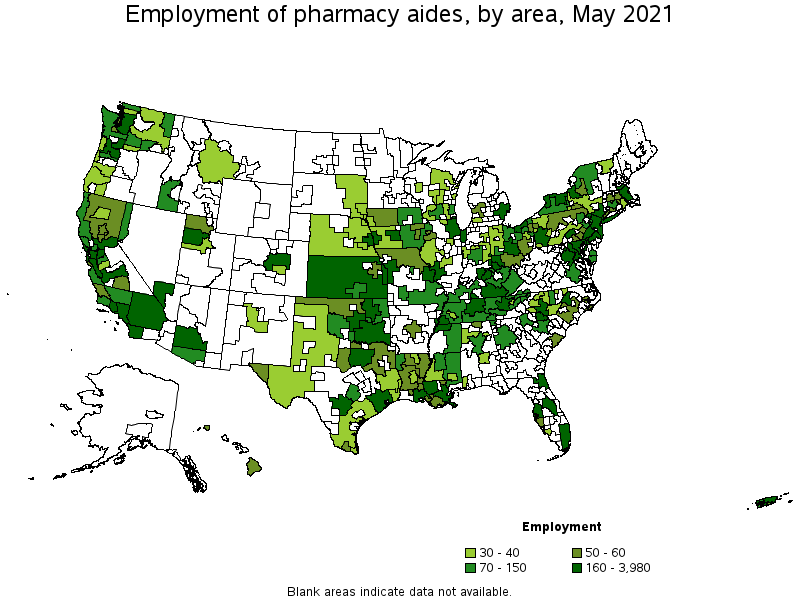
Metropolitan areas with the highest employment level in Pharmacy Aides:
| Metropolitan area | Employment (1) | Employment per thousand jobs | Location quotient (9) | Hourly mean wage | Annual mean wage (2) |
|---|---|---|---|---|---|
| Los Angeles-Long Beach-Anaheim, CA | 3,980 | 0.70 | 2.25 | $ 21.64 | $ 45,010 |
| New York-Newark-Jersey City, NY-NJ-PA | 1,900 | 0.22 | 0.71 | $ 16.99 | $ 35,340 |
| San Francisco-Oakland-Hayward, CA | 1,330 | 0.59 | 1.91 | $ 27.71 | $ 57,630 |
| Boston-Cambridge-Nashua, MA-NH | 1,120 | 0.43 | 1.40 | $ 18.08 | $ 37,600 |
| Seattle-Tacoma-Bellevue, WA | 1,030 | 0.53 | 1.73 | $ 18.15 | $ 37,740 |
| Miami-Fort Lauderdale-West Palm Beach, FL | 1,020 | 0.42 | 1.34 | $ 15.26 | $ 31,730 |
| Dallas-Fort Worth-Arlington, TX | 980 | 0.27 | 0.88 | $ 14.04 | $ 29,210 |
| Riverside-San Bernardino-Ontario, CA | 920 | 0.60 | 1.94 | $ 21.71 | $ 45,150 |
| Philadelphia-Camden-Wilmington, PA-NJ-DE-MD | 870 | 0.33 | 1.06 | $ 16.52 | $ 34,370 |
| Chicago-Naperville-Elgin, IL-IN-WI | 790 | 0.19 | 0.60 | $ 15.22 | $ 31,650 |
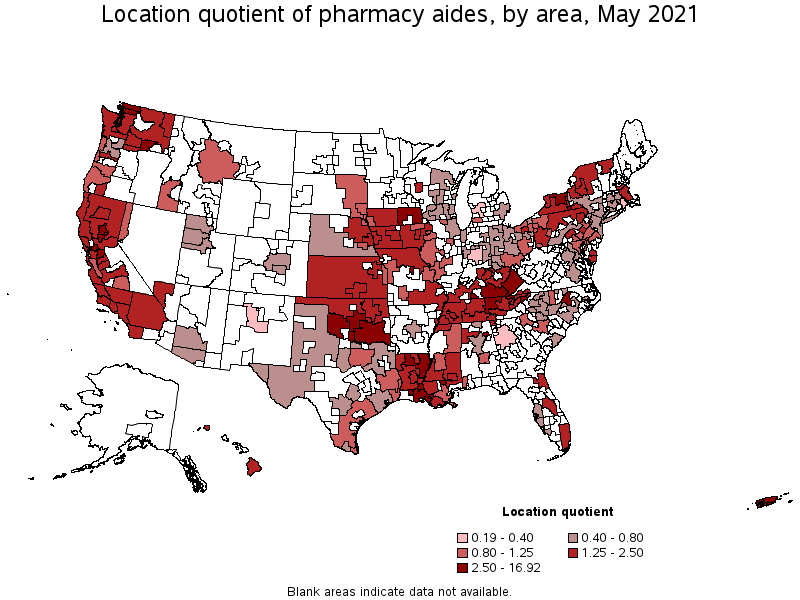
Metropolitan areas with the highest concentration of jobs and location quotients in Pharmacy Aides:
| Metropolitan area | Employment (1) | Employment per thousand jobs | Location quotient (9) | Hourly mean wage | Annual mean wage (2) |
|---|---|---|---|---|---|
| Stockton-Lodi, CA | 290 | 1.11 | 3.60 | $ 23.25 | $ 48,370 |
| Rochester, NY | 500 | 1.06 | 3.43 | $ 15.80 | $ 32,870 |
| Yuba City, CA | 50 | 1.05 | 3.39 | $ 18.57 | $ 38,620 |
| Lafayette, LA | 190 | 1.04 | 3.35 | $ 11.05 | $ 22,980 |
| Vallejo-Fairfield, CA | 130 | 1.03 | 3.32 | $ 28.44 | $ 59,160 |
| Columbia, MO | 90 | 1.00 | 3.23 | $ 14.37 | $ 29,890 |
| Oklahoma City, OK | 600 | 0.99 | 3.20 | $ 12.37 | $ 25,720 |
| Elmira, NY | 30 | 0.98 | 3.18 | $ 16.46 | $ 34,240 |
| Gadsden, AL | 30 | 0.98 | 3.18 | $ 12.37 | $ 25,720 |
| Johnson City, TN | 70 | 0.96 | 3.12 | $ 11.75 | $ 24,450 |
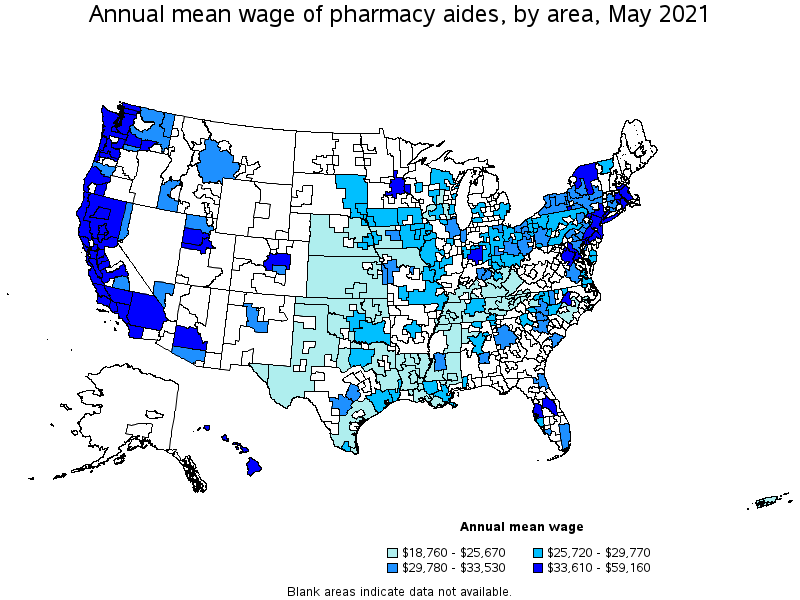
Top paying metropolitan areas for Pharmacy Aides:
| Metropolitan area | Employment (1) | Employment per thousand jobs | Location quotient (9) | Hourly mean wage | Annual mean wage (2) |
|---|---|---|---|---|---|
| Vallejo-Fairfield, CA | 130 | 1.03 | 3.32 | $ 28.44 | $ 59,160 |
| San Francisco-Oakland-Hayward, CA | 1,330 | 0.59 | 1.91 | $ 27.71 | $ 57,630 |
| Santa Rosa, CA | 100 | 0.54 | 1.73 | $ 27.14 | $ 56,450 |
| San Jose-Sunnyvale-Santa Clara, CA | 370 | 0.35 | 1.12 | $ 25.23 | $ 52,470 |
| Sacramento--Roseville--Arden-Arcade, CA | 680 | 0.69 | 2.24 | $ 24.89 | $ 51,770 |
| Stockton-Lodi, CA | 290 | 1.11 | 3.60 | $ 23.25 | $ 48,370 |
| Riverside-San Bernardino-Ontario, CA | 920 | 0.60 | 1.94 | $ 21.71 | $ 45,150 |
| Los Angeles-Long Beach-Anaheim, CA | 3,980 | 0.70 | 2.25 | $ 21.64 | $ 45,010 |
| San Diego-Carlsbad, CA | 750 | 0.54 | 1.74 | $ 21.58 | $ 44,890 |
| Bakersfield, CA | 150 | 0.49 | 1.59 | $ 20.95 | $ 43,570 |
Nonmetropolitan areas with the highest employment in Pharmacy Aides:
| Nonmetropolitan area | Employment (1) | Employment per thousand jobs | Location quotient (9) | Hourly mean wage | Annual mean wage (2) |
|---|---|---|---|---|---|
| Kansas nonmetropolitan area | 190 | 0.51 | 1.65 | $ 12.02 | $ 24,990 |
| South Central Kentucky nonmetropolitan area | 160 | 0.97 | 3.13 | $ 11.11 | $ 23,110 |
| Southeast Oklahoma nonmetropolitan area | 160 | 0.96 | 3.11 | $ 12.76 | $ 26,530 |
| Southwest Oklahoma nonmetropolitan area | 100 | 1.78 | 5.76 | $ 11.55 | $ 24,020 |
| Southeast Iowa nonmetropolitan area | 100 | 0.48 | 1.57 | $ 12.85 | $ 26,730 |
Nonmetropolitan areas with the highest concentration of jobs and location quotients in Pharmacy Aides:
| Nonmetropolitan area | Employment (1) | Employment per thousand jobs | Location quotient (9) | Hourly mean wage | Annual mean wage (2) |
|---|---|---|---|---|---|
| Southwest Oklahoma nonmetropolitan area | 100 | 1.78 | 5.76 | $ 11.55 | $ 24,020 |
| Southwest Louisiana nonmetropolitan area | 60 | 0.97 | 3.15 | $ 10.92 | $ 22,720 |
| South Central Kentucky nonmetropolitan area | 160 | 0.97 | 3.13 | $ 11.11 | $ 23,110 |
| East Kentucky nonmetropolitan area | 90 | 0.96 | 3.12 | $ 11.31 | $ 23,510 |
| Southeast Oklahoma nonmetropolitan area | 160 | 0.96 | 3.11 | $ 12.76 | $ 26,530 |
Top paying nonmetropolitan areas for Pharmacy Aides:
| Nonmetropolitan area | Employment (1) | Employment per thousand jobs | Location quotient (9) | Hourly mean wage | Annual mean wage (2) |
|---|---|---|---|---|---|
| North Valley-Northern Mountains Region of California nonmetropolitan area | 60 | 0.57 | 1.85 | $ 18.57 | $ 38,630 |
| North Coast Region of California nonmetropolitan area | 70 | 0.69 | 2.24 | $ 17.81 | $ 37,040 |
| Hawaii / Kauai nonmetropolitan area | 50 | 0.53 | 1.72 | $ 17.30 | $ 35,990 |
| Coast Oregon nonmetropolitan area | 40 | 0.32 | 1.05 | $ 16.48 | $ 34,270 |
| Western Washington nonmetropolitan area | 80 | 0.67 | 2.16 | $ 16.35 | $ 34,000 |
These estimates are calculated with data collected from employers in all industry sectors, all metropolitan and nonmetropolitan areas, and all states and the District of Columbia. The top employment and wage figures are provided above. The complete list is available in the downloadable XLS files.
The percentile wage estimate is the value of a wage below which a certain percent of workers fall. The median wage is the 50th percentile wage estimate—50 percent of workers earn less than the median and 50 percent of workers earn more than the median. More about percentile wages.
(1) Estimates for detailed occupations do not sum to the totals because the totals include occupations not shown separately. Estimates do not include self-employed workers.
(2) Annual wages have been calculated by multiplying the hourly mean wage by a "year-round, full-time" hours figure of 2,080 hours; for those occupations where there is not an hourly wage published, the annual wage has been directly calculated from the reported survey data.
(3) The relative standard error (RSE) is a measure of the reliability of a survey statistic. The smaller the relative standard error, the more precise the estimate.
(7) The value is less than .005 percent of industry employment.
(9) The location quotient is the ratio of the area concentration of occupational employment to the national average concentration. A location quotient greater than one indicates the occupation has a higher share of employment than average, and a location quotient less than one indicates the occupation is less prevalent in the area than average.
Other OEWS estimates and related information:
May 2021 National Occupational Employment and Wage Estimates
May 2021 State Occupational Employment and Wage Estimates
May 2021 Metropolitan and Nonmetropolitan Area Occupational Employment and Wage Estimates
May 2021 National Industry-Specific Occupational Employment and Wage Estimates
Last Modified Date: March 31, 2022