
An official website of the United States government
An official website of the United States government
The .gov means it's official.
Federal government websites often end in .gov or .mil. Before sharing sensitive information,
make sure you're on a federal government site.
The site is secure.
The
https:// ensures that you are connecting to the official website and that any
information you provide is encrypted and transmitted securely.
Directly supervise and coordinate activities of security workers and security guards.
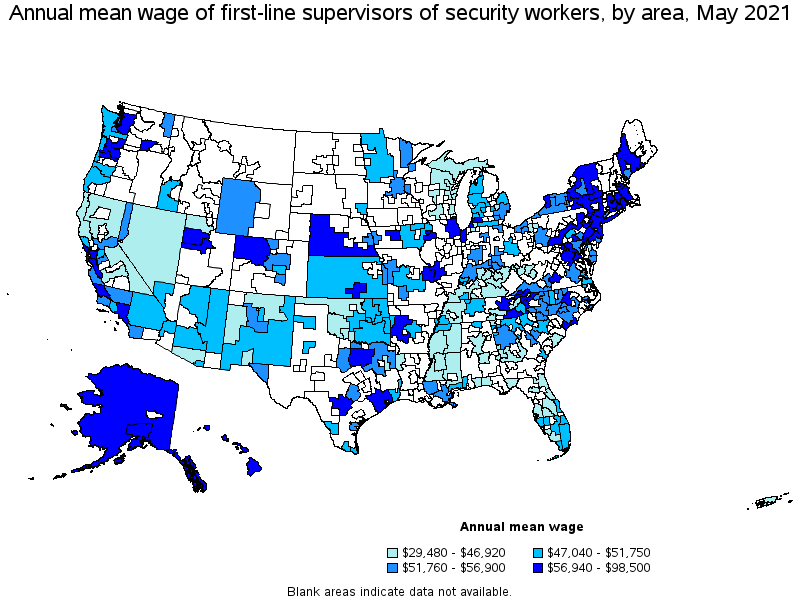
Employment estimate and mean wage estimates for First-Line Supervisors of Security Workers:
| Employment (1) | Employment RSE (3) |
Mean hourly wage |
Mean annual wage (2) |
Wage RSE (3) |
|---|---|---|---|---|
| 55,450 | 1.4 % | $ 26.48 | $ 55,080 | 0.7 % |
Percentile wage estimates for First-Line Supervisors of Security Workers:
| Percentile | 10% | 25% | 50% (Median) |
75% | 90% |
|---|---|---|---|---|---|
| Hourly Wage | $ 15.11 | $ 18.41 | $ 24.15 | $ 30.77 | $ 39.00 |
| Annual Wage (2) | $ 31,440 | $ 38,290 | $ 50,240 | $ 64,010 | $ 81,110 |
Industries with the highest published employment and wages for First-Line Supervisors of Security Workers are provided. For a list of all industries with employment in First-Line Supervisors of Security Workers, see the Create Customized Tables function.
Industries with the highest levels of employment in First-Line Supervisors of Security Workers:
| Industry | Employment (1) | Percent of industry employment | Hourly mean wage | Annual mean wage (2) |
|---|---|---|---|---|
| Investigation and Security Services | 27,060 | 2.94 | $ 23.71 | $ 49,310 |
| General Merchandise Stores | 3,870 | 0.13 | $ 28.32 | $ 58,910 |
| Traveler Accommodation | 3,680 | 0.27 | $ 24.27 | $ 50,490 |
| General Medical and Surgical Hospitals | 2,990 | 0.05 | $ 29.63 | $ 61,630 |
| Gambling Industries | 2,280 | 1.26 | $ 22.47 | $ 46,750 |
Industries with the highest concentration of employment in First-Line Supervisors of Security Workers:
| Industry | Employment (1) | Percent of industry employment | Hourly mean wage | Annual mean wage (2) |
|---|---|---|---|---|
| Investigation and Security Services | 27,060 | 2.94 | $ 23.71 | $ 49,310 |
| Gambling Industries | 2,280 | 1.26 | $ 22.47 | $ 46,750 |
| Monetary Authorities-Central Bank | 140 | 0.69 | $ 49.41 | $ 102,770 |
| Promoters of Performing Arts, Sports, and Similar Events | 350 | 0.45 | $ 24.91 | $ 51,810 |
| Museums, Historical Sites, and Similar Institutions | 510 | 0.39 | $ 27.78 | $ 57,780 |
Top paying industries for First-Line Supervisors of Security Workers:
| Industry | Employment (1) | Percent of industry employment | Hourly mean wage | Annual mean wage (2) |
|---|---|---|---|---|
| Chemical Manufacturing (3251, 3252, 3253, and 3259 only) | 30 | 0.01 | $ 63.59 | $ 132,270 |
| Monetary Authorities-Central Bank | 140 | 0.69 | $ 49.41 | $ 102,770 |
| Electric Power Generation, Transmission and Distribution | 600 | 0.16 | $ 47.01 | $ 97,780 |
| Telecommunications | 60 | 0.01 | $ 44.61 | $ 92,800 |
| Truck Transportation | 40 | (7) | $ 44.43 | $ 92,410 |
States and areas with the highest published employment, location quotients, and wages for First-Line Supervisors of Security Workers are provided. For a list of all areas with employment in First-Line Supervisors of Security Workers, see the Create Customized Tables function.
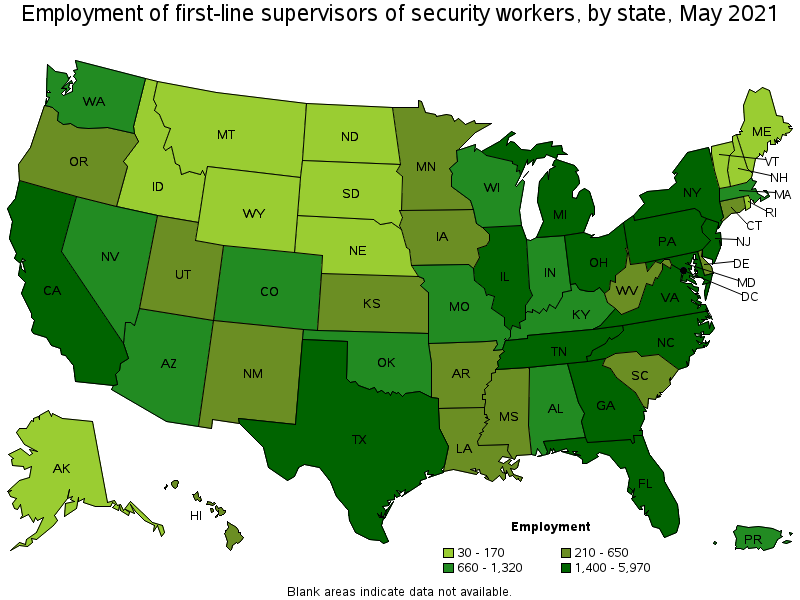
States with the highest employment level in First-Line Supervisors of Security Workers:
| State | Employment (1) | Employment per thousand jobs | Location quotient (9) | Hourly mean wage | Annual mean wage (2) |
|---|---|---|---|---|---|
| New York | 5,970 | 0.69 | 1.75 | $ 30.37 | $ 63,170 |
| California | 5,690 | 0.34 | 0.87 | $ 27.41 | $ 57,020 |
| Florida | 4,650 | 0.54 | 1.37 | $ 22.51 | $ 46,820 |
| Texas | 4,040 | 0.33 | 0.84 | $ 27.53 | $ 57,260 |
| Illinois | 1,980 | 0.35 | 0.90 | $ 28.36 | $ 58,990 |
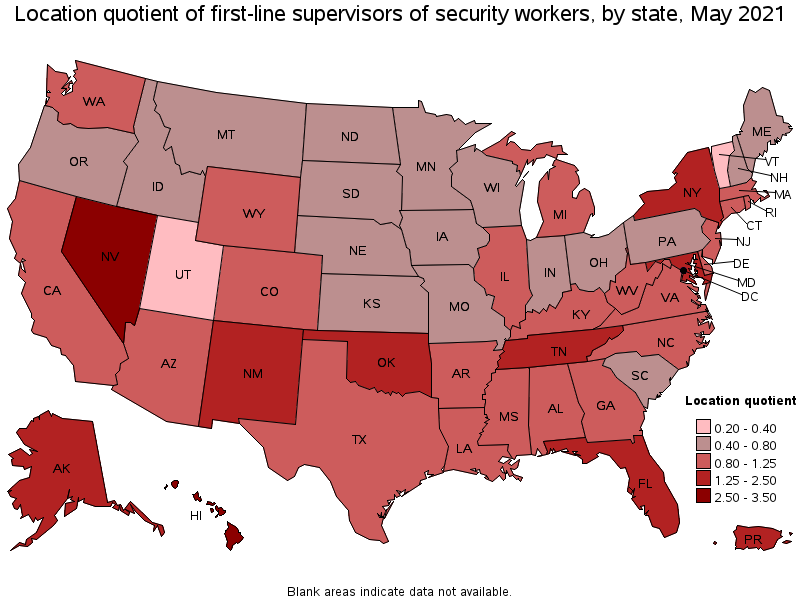
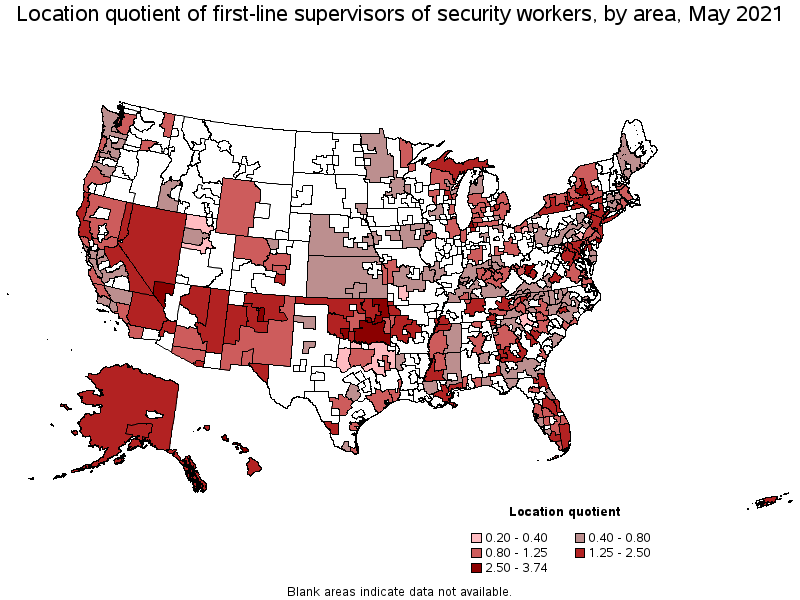
States with the highest concentration of jobs and location quotients in First-Line Supervisors of Security Workers:
| State | Employment (1) | Employment per thousand jobs | Location quotient (9) | Hourly mean wage | Annual mean wage (2) |
|---|---|---|---|---|---|
| Hawaii | 650 | 1.19 | 3.03 | $ 27.78 | $ 57,780 |
| District of Columbia | 740 | 1.11 | 2.83 | $ 32.44 | $ 67,470 |
| Nevada | 1,320 | 1.02 | 2.60 | $ 23.36 | $ 48,600 |
| New York | 5,970 | 0.69 | 1.75 | $ 30.37 | $ 63,170 |
| New Mexico | 530 | 0.68 | 1.73 | $ 24.41 | $ 50,780 |
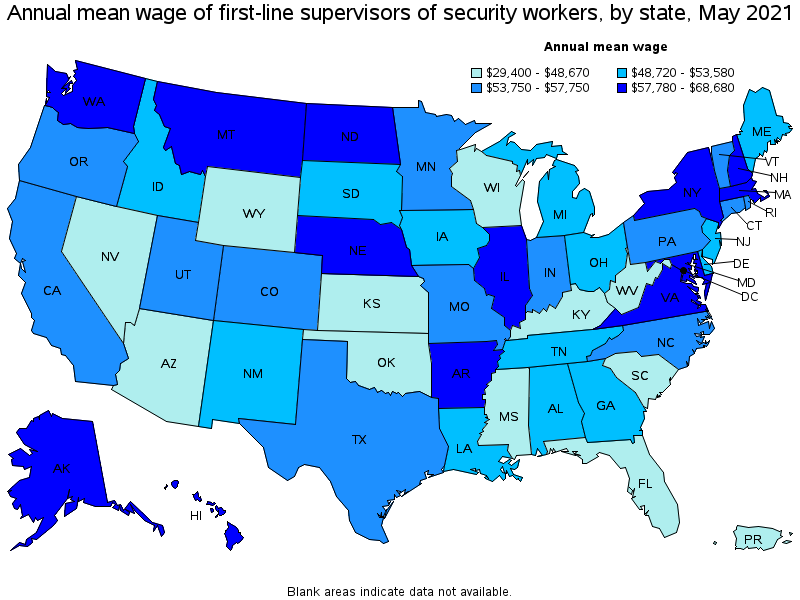
Top paying states for First-Line Supervisors of Security Workers:
| State | Employment (1) | Employment per thousand jobs | Location quotient (9) | Hourly mean wage | Annual mean wage (2) |
|---|---|---|---|---|---|
| New Hampshire | 130 | 0.21 | 0.54 | $ 33.02 | $ 68,680 |
| Alaska | 170 | 0.58 | 1.46 | $ 32.81 | $ 68,230 |
| District of Columbia | 740 | 1.11 | 2.83 | $ 32.44 | $ 67,470 |
| Arkansas | 560 | 0.47 | 1.20 | $ 31.01 | $ 64,490 |
| New York | 5,970 | 0.69 | 1.75 | $ 30.37 | $ 63,170 |
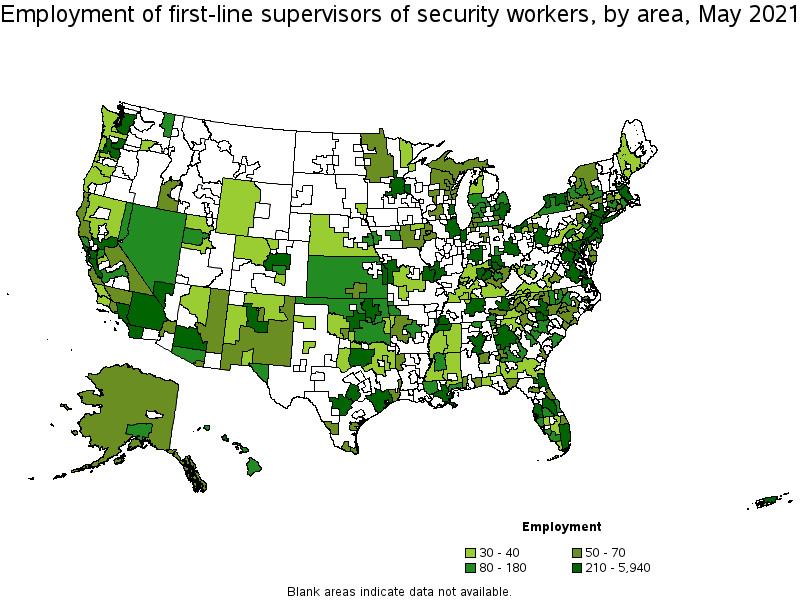
Metropolitan areas with the highest employment level in First-Line Supervisors of Security Workers:
| Metropolitan area | Employment (1) | Employment per thousand jobs | Location quotient (9) | Hourly mean wage | Annual mean wage (2) |
|---|---|---|---|---|---|
| New York-Newark-Jersey City, NY-NJ-PA | 5,940 | 0.68 | 1.74 | $ 29.70 | $ 61,770 |
| Washington-Arlington-Alexandria, DC-VA-MD-WV | 2,100 | 0.72 | 1.82 | $ 32.01 | $ 66,580 |
| Miami-Fort Lauderdale-West Palm Beach, FL | 2,080 | 0.85 | 2.15 | $ 23.48 | $ 48,830 |
| Los Angeles-Long Beach-Anaheim, CA | 2,030 | 0.36 | 0.90 | $ 27.81 | $ 57,840 |
| Chicago-Naperville-Elgin, IL-IN-WI | 1,770 | 0.42 | 1.06 | $ 28.17 | $ 58,590 |
| Dallas-Fort Worth-Arlington, TX | 1,350 | 0.38 | 0.95 | $ 28.64 | $ 59,580 |
| Boston-Cambridge-Nashua, MA-NH | 1,120 | 0.43 | 1.10 | $ 28.68 | $ 59,660 |
| Houston-The Woodlands-Sugar Land, TX | 1,100 | 0.38 | 0.97 | $ 28.45 | $ 59,170 |
| Las Vegas-Henderson-Paradise, NV | 1,070 | 1.17 | 2.96 | $ 23.68 | $ 49,250 |
| Atlanta-Sandy Springs-Roswell, GA | 1,040 | 0.40 | 1.02 | $ 25.00 | $ 52,000 |
Metropolitan areas with the highest concentration of jobs and location quotients in First-Line Supervisors of Security Workers:
| Metropolitan area | Employment (1) | Employment per thousand jobs | Location quotient (9) | Hourly mean wage | Annual mean wage (2) |
|---|---|---|---|---|---|
| Lawton, OK | 60 | 1.47 | 3.74 | $ 21.86 | $ 45,480 |
| Atlantic City-Hammonton, NJ | 160 | 1.39 | 3.53 | $ 25.28 | $ 52,580 |
| Kahului-Wailuku-Lahaina, HI | 90 | 1.37 | 3.48 | $ 28.29 | $ 58,850 |
| Utica-Rome, NY | 150 | 1.33 | 3.38 | $ 26.23 | $ 54,560 |
| Urban Honolulu, HI | 490 | 1.24 | 3.16 | $ 27.66 | $ 57,520 |
| Las Vegas-Henderson-Paradise, NV | 1,070 | 1.17 | 2.96 | $ 23.68 | $ 49,250 |
| Santa Fe, NM | 60 | 1.09 | 2.77 | $ 23.70 | $ 49,290 |
| Niles-Benton Harbor, MI | 60 | 1.04 | 2.64 | $ 27.67 | $ 57,560 |
| Charleston, WV | 100 | 1.03 | 2.61 | $ 18.04 | $ 37,510 |
| Knoxville, TN | 330 | 0.86 | 2.19 | $ 27.85 | $ 57,920 |
Top paying metropolitan areas for First-Line Supervisors of Security Workers:
| Metropolitan area | Employment (1) | Employment per thousand jobs | Location quotient (9) | Hourly mean wage | Annual mean wage (2) |
|---|---|---|---|---|---|
| San Luis Obispo-Paso Robles-Arroyo Grande, CA | 40 | 0.36 | 0.93 | $ 47.36 | $ 98,500 |
| Kennewick-Richland, WA | 40 | 0.35 | 0.88 | $ 41.46 | $ 86,240 |
| Syracuse, NY | 100 | 0.36 | 0.91 | $ 33.47 | $ 69,610 |
| Lynchburg, VA | 70 | 0.75 | 1.91 | $ 32.69 | $ 68,000 |
| Anchorage, AK | 100 | 0.64 | 1.62 | $ 32.68 | $ 67,970 |
| San Jose-Sunnyvale-Santa Clara, CA | 310 | 0.29 | 0.73 | $ 32.14 | $ 66,850 |
| New Haven, CT | 70 | 0.26 | 0.67 | $ 32.05 | $ 66,660 |
| Washington-Arlington-Alexandria, DC-VA-MD-WV | 2,100 | 0.72 | 1.82 | $ 32.01 | $ 66,580 |
| York-Hanover, PA | 40 | 0.23 | 0.58 | $ 31.97 | $ 66,500 |
| Kalamazoo-Portage, MI | 60 | 0.48 | 1.21 | $ 31.84 | $ 66,220 |
Nonmetropolitan areas with the highest employment in First-Line Supervisors of Security Workers:
| Nonmetropolitan area | Employment (1) | Employment per thousand jobs | Location quotient (9) | Hourly mean wage | Annual mean wage (2) |
|---|---|---|---|---|---|
| Southeast Oklahoma nonmetropolitan area | 180 | 1.08 | 2.75 | $ 22.62 | $ 47,040 |
| Northeast Oklahoma nonmetropolitan area | 130 | 1.12 | 2.86 | $ 23.25 | $ 48,350 |
| Balance of Lower Peninsula of Michigan nonmetropolitan area | 110 | 0.43 | 1.08 | $ 22.90 | $ 47,620 |
| Southwest New York nonmetropolitan area | 100 | 0.58 | 1.48 | $ 26.26 | $ 54,630 |
| Nevada nonmetropolitan area | 90 | 0.95 | 2.41 | $ 17.91 | $ 37,260 |
Nonmetropolitan areas with the highest concentration of jobs and location quotients in First-Line Supervisors of Security Workers:
| Nonmetropolitan area | Employment (1) | Employment per thousand jobs | Location quotient (9) | Hourly mean wage | Annual mean wage (2) |
|---|---|---|---|---|---|
| Northeast Oklahoma nonmetropolitan area | 130 | 1.12 | 2.86 | $ 23.25 | $ 48,350 |
| Southeast Oklahoma nonmetropolitan area | 180 | 1.08 | 2.75 | $ 22.62 | $ 47,040 |
| Nevada nonmetropolitan area | 90 | 0.95 | 2.41 | $ 17.91 | $ 37,260 |
| Eastern Sierra-Mother Lode Region of California nonmetropolitan area | 50 | 0.87 | 2.20 | $ 22.33 | $ 46,440 |
| Northwest Oklahoma nonmetropolitan area | 80 | 0.86 | 2.19 | $ 20.92 | $ 43,510 |
Top paying nonmetropolitan areas for First-Line Supervisors of Security Workers:
| Nonmetropolitan area | Employment (1) | Employment per thousand jobs | Location quotient (9) | Hourly mean wage | Annual mean wage (2) |
|---|---|---|---|---|---|
| Central East New York nonmetropolitan area | 70 | 0.49 | 1.26 | $ 38.76 | $ 80,620 |
| South Nebraska nonmetropolitan area | 40 | 0.24 | 0.61 | $ 34.86 | $ 72,520 |
| West Arkansas nonmetropolitan area | 70 | 0.83 | 2.11 | $ 34.55 | $ 71,870 |
| Alaska nonmetropolitan area | 50 | 0.52 | 1.31 | $ 33.22 | $ 69,110 |
| Mountain North Carolina nonmetropolitan area | 40 | 0.29 | 0.74 | $ 31.87 | $ 66,280 |
These estimates are calculated with data collected from employers in all industry sectors, all metropolitan and nonmetropolitan areas, and all states and the District of Columbia. The top employment and wage figures are provided above. The complete list is available in the downloadable XLS files.
The percentile wage estimate is the value of a wage below which a certain percent of workers fall. The median wage is the 50th percentile wage estimate—50 percent of workers earn less than the median and 50 percent of workers earn more than the median. More about percentile wages.
(1) Estimates for detailed occupations do not sum to the totals because the totals include occupations not shown separately. Estimates do not include self-employed workers.
(2) Annual wages have been calculated by multiplying the hourly mean wage by a "year-round, full-time" hours figure of 2,080 hours; for those occupations where there is not an hourly wage published, the annual wage has been directly calculated from the reported survey data.
(3) The relative standard error (RSE) is a measure of the reliability of a survey statistic. The smaller the relative standard error, the more precise the estimate.
(7) The value is less than .005 percent of industry employment.
(9) The location quotient is the ratio of the area concentration of occupational employment to the national average concentration. A location quotient greater than one indicates the occupation has a higher share of employment than average, and a location quotient less than one indicates the occupation is less prevalent in the area than average.
Other OEWS estimates and related information:
May 2021 National Occupational Employment and Wage Estimates
May 2021 State Occupational Employment and Wage Estimates
May 2021 Metropolitan and Nonmetropolitan Area Occupational Employment and Wage Estimates
May 2021 National Industry-Specific Occupational Employment and Wage Estimates
Last Modified Date: March 31, 2022