
An official website of the United States government
An official website of the United States government
The .gov means it's official.
Federal government websites often end in .gov or .mil. Before sharing sensitive information,
make sure you're on a federal government site.
The site is secure.
The
https:// ensures that you are connecting to the official website and that any
information you provide is encrypted and transmitted securely.
Patrol assigned area to prevent fish and game law violations. Investigate reports of damage to crops or property by wildlife. Compile biological data.
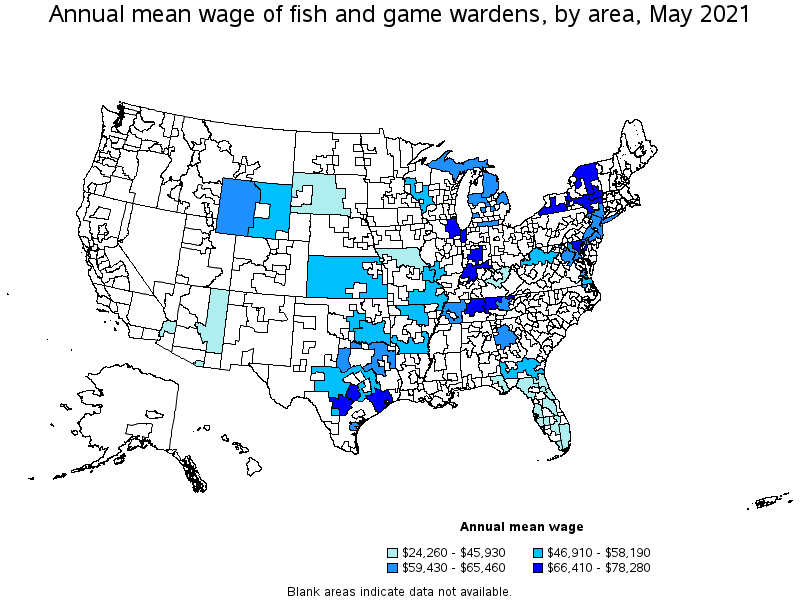
Employment estimate and mean wage estimates for Fish and Game Wardens:
| Employment (1) | Employment RSE (3) |
Mean hourly wage |
Mean annual wage (2) |
Wage RSE (3) |
|---|---|---|---|---|
| 6,730 | 0.3 % | $ 27.98 | $ 58,190 | 0.3 % |
Percentile wage estimates for Fish and Game Wardens:
| Percentile | 10% | 25% | 50% (Median) |
75% | 90% |
|---|---|---|---|---|---|
| Hourly Wage | $ 15.00 | $ 22.72 | $ 29.20 | $ 34.39 | $ 37.66 |
| Annual Wage (2) | $ 31,200 | $ 47,260 | $ 60,730 | $ 71,530 | $ 78,330 |
Industries with the highest published employment and wages for Fish and Game Wardens are provided. For a list of all industries with employment in Fish and Game Wardens, see the Create Customized Tables function.
Industries with the highest levels of employment in Fish and Game Wardens:
| Industry | Employment (1) | Percent of industry employment | Hourly mean wage | Annual mean wage (2) |
|---|---|---|---|---|
| State Government, excluding schools and hospitals (OEWS Designation) | 6,380 | 0.29 | $ 28.18 | $ 58,610 |
| Local Government, excluding schools and hospitals (OEWS Designation) | 340 | 0.01 | $ 24.23 | $ 50,390 |
Industries with the highest concentration of employment in Fish and Game Wardens:
| Industry | Employment (1) | Percent of industry employment | Hourly mean wage | Annual mean wage (2) |
|---|---|---|---|---|
| State Government, excluding schools and hospitals (OEWS Designation) | 6,380 | 0.29 | $ 28.18 | $ 58,610 |
| Local Government, excluding schools and hospitals (OEWS Designation) | 340 | 0.01 | $ 24.23 | $ 50,390 |
Top paying industries for Fish and Game Wardens:
| Industry | Employment (1) | Percent of industry employment | Hourly mean wage | Annual mean wage (2) |
|---|---|---|---|---|
| State Government, excluding schools and hospitals (OEWS Designation) | 6,380 | 0.29 | $ 28.18 | $ 58,610 |
| Local Government, excluding schools and hospitals (OEWS Designation) | 340 | 0.01 | $ 24.23 | $ 50,390 |
States and areas with the highest published employment, location quotients, and wages for Fish and Game Wardens are provided. For a list of all areas with employment in Fish and Game Wardens, see the Create Customized Tables function.
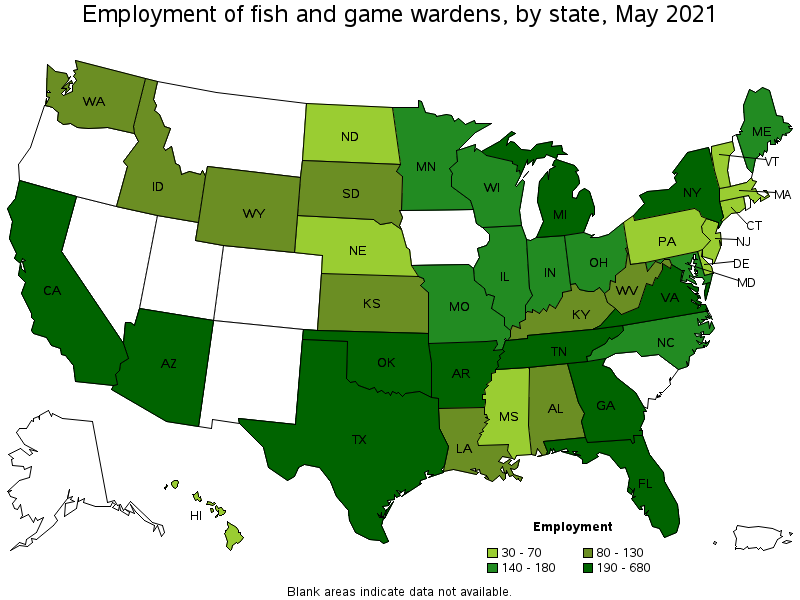
States with the highest employment level in Fish and Game Wardens:
| State | Employment (1) | Employment per thousand jobs | Location quotient (9) | Hourly mean wage | Annual mean wage (2) |
|---|---|---|---|---|---|
| Florida | 680 | 0.08 | 1.66 | $ 13.00 | $ 27,030 |
| Texas | 490 | 0.04 | 0.83 | $ 31.36 | $ 65,220 |
| New York | 380 | 0.04 | 0.92 | $ 32.63 | $ 67,870 |
| Tennessee | 350 | 0.12 | 2.45 | $ 33.26 | $ 69,170 |
| California | 290 | 0.02 | 0.36 | $ 39.48 | $ 82,120 |
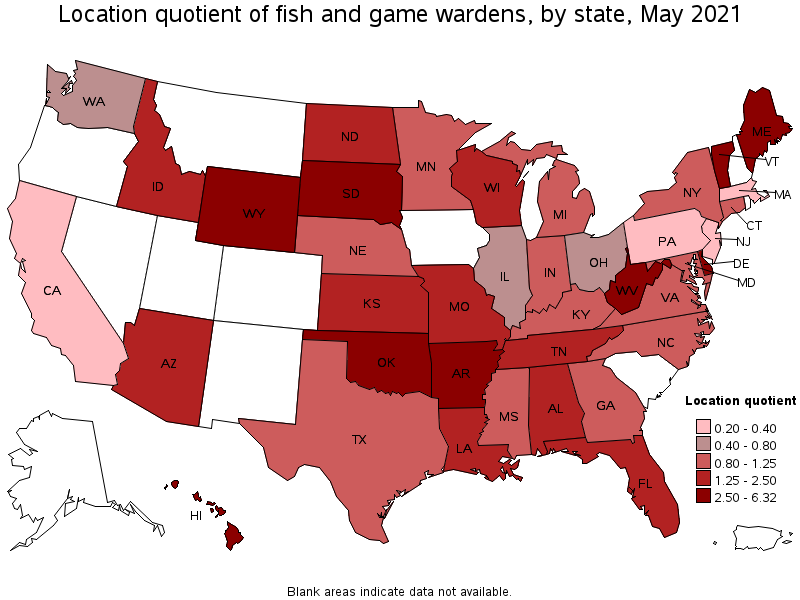
States with the highest concentration of jobs and location quotients in Fish and Game Wardens:
| State | Employment (1) | Employment per thousand jobs | Location quotient (9) | Hourly mean wage | Annual mean wage (2) |
|---|---|---|---|---|---|
| Wyoming | 80 | 0.30 | 6.32 | $ 28.08 | $ 58,410 |
| South Dakota | 120 | 0.28 | 5.96 | $ 23.69 | $ 49,280 |
| Maine | 140 | 0.23 | 4.85 | $ 29.33 | $ 61,010 |
| Arkansas | 190 | 0.16 | 3.31 | $ 24.80 | $ 51,580 |
| West Virginia | 100 | 0.15 | 3.06 | $ 24.01 | $ 49,950 |
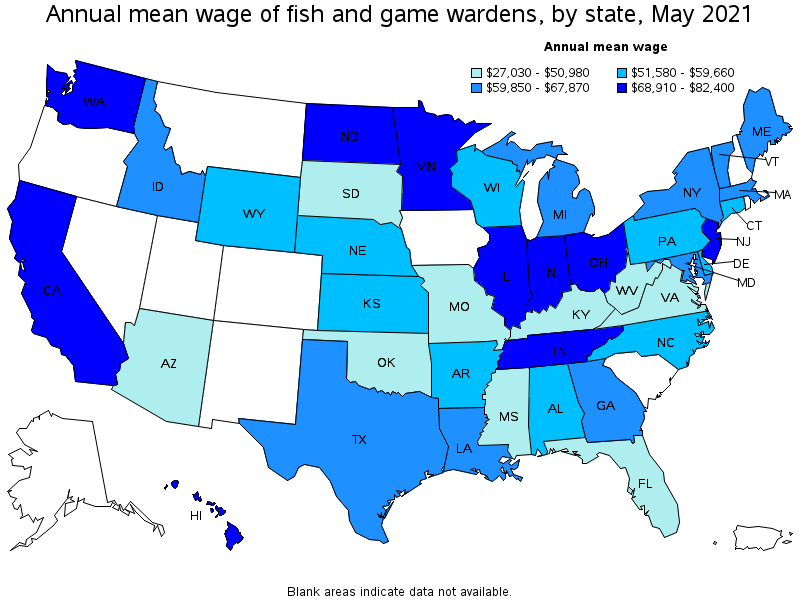
Top paying states for Fish and Game Wardens:
| State | Employment (1) | Employment per thousand jobs | Location quotient (9) | Hourly mean wage | Annual mean wage (2) |
|---|---|---|---|---|---|
| New Jersey | 50 | 0.01 | 0.28 | $ 39.62 | $ 82,400 |
| California | 290 | 0.02 | 0.36 | $ 39.48 | $ 82,120 |
| Washington | 110 | 0.04 | 0.74 | $ 37.54 | $ 78,080 |
| Illinois | 180 | 0.03 | 0.68 | $ 36.92 | $ 76,800 |
| Hawaii | 70 | 0.13 | 2.67 | $ 34.87 | $ 72,530 |
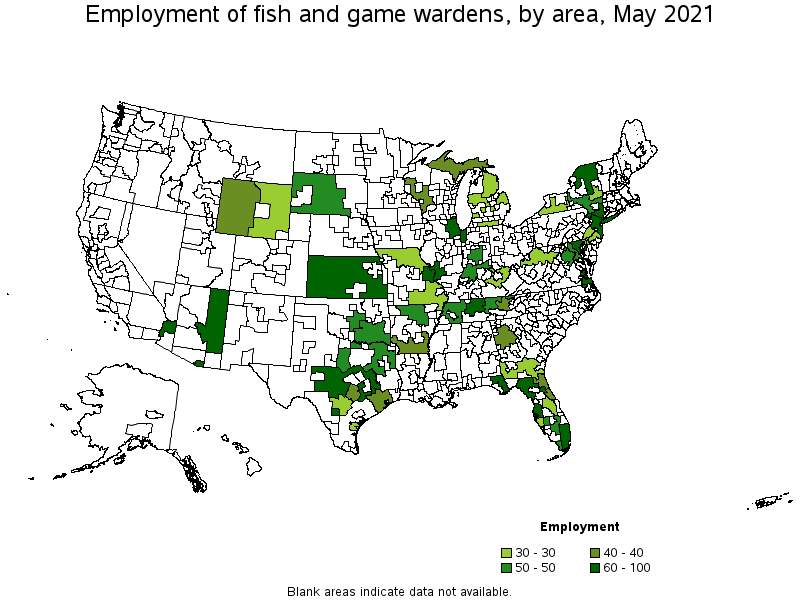
Metropolitan areas with the highest employment level in Fish and Game Wardens:
| Metropolitan area | Employment (1) | Employment per thousand jobs | Location quotient (9) | Hourly mean wage | Annual mean wage (2) |
|---|---|---|---|---|---|
| New York-Newark-Jersey City, NY-NJ-PA | 100 | 0.01 | 0.24 | $ 31.47 | $ 65,460 |
| Tampa-St. Petersburg-Clearwater, FL | 90 | 0.07 | 1.51 | $ 12.82 | $ 26,660 |
| Virginia Beach-Norfolk-Newport News, VA-NC | 90 | 0.13 | 2.63 | $ 23.76 | $ 49,410 |
| Chicago-Naperville-Elgin, IL-IN-WI | 90 | 0.02 | 0.42 | $ 35.42 | $ 73,680 |
| Baltimore-Columbia-Towson, MD | 80 | 0.07 | 1.40 | $ 32.40 | $ 67,400 |
| Nashville-Davidson--Murfreesboro--Franklin, TN | 70 | 0.07 | 1.57 | $ 37.64 | $ 78,280 |
| Miami-Fort Lauderdale-West Palm Beach, FL | 60 | 0.02 | 0.49 | $ 13.46 | $ 28,000 |
| St. Louis, MO-IL | 60 | 0.04 | 0.92 | $ 27.98 | $ 58,190 |
| Oklahoma City, OK | 50 | 0.09 | 1.90 | $ 24.14 | $ 50,210 |
| Washington-Arlington-Alexandria, DC-VA-MD-WV | 50 | 0.02 | 0.35 | $ 29.66 | $ 61,700 |
Metropolitan areas with the highest concentration of jobs and location quotients in Fish and Game Wardens:
| Metropolitan area | Employment (1) | Employment per thousand jobs | Location quotient (9) | Hourly mean wage | Annual mean wage (2) |
|---|---|---|---|---|---|
| Deltona-Daytona Beach-Ormond Beach, FL | 40 | 0.22 | 4.52 | $ 12.64 | $ 26,300 |
| Corpus Christi, TX | 30 | 0.17 | 3.58 | $ 28.57 | $ 59,430 |
| Virginia Beach-Norfolk-Newport News, VA-NC | 90 | 0.13 | 2.63 | $ 23.76 | $ 49,410 |
| North Port-Sarasota-Bradenton, FL | 30 | 0.11 | 2.36 | $ 12.70 | $ 26,410 |
| Knoxville, TN | 40 | 0.11 | 2.24 | $ 30.79 | $ 64,040 |
| Oklahoma City, OK | 50 | 0.09 | 1.90 | $ 24.14 | $ 50,210 |
| Albany-Schenectady-Troy, NY | 30 | 0.08 | 1.65 | $ 33.92 | $ 70,550 |
| Nashville-Davidson--Murfreesboro--Franklin, TN | 70 | 0.07 | 1.57 | $ 37.64 | $ 78,280 |
| Tampa-St. Petersburg-Clearwater, FL | 90 | 0.07 | 1.51 | $ 12.82 | $ 26,660 |
| Baltimore-Columbia-Towson, MD | 80 | 0.07 | 1.40 | $ 32.40 | $ 67,400 |
Top paying metropolitan areas for Fish and Game Wardens:
| Metropolitan area | Employment (1) | Employment per thousand jobs | Location quotient (9) | Hourly mean wage | Annual mean wage (2) |
|---|---|---|---|---|---|
| Nashville-Davidson--Murfreesboro--Franklin, TN | 70 | 0.07 | 1.57 | $ 37.64 | $ 78,280 |
| Austin-Round Rock, TX | 40 | 0.04 | 0.84 | $ 35.90 | $ 74,670 |
| Chicago-Naperville-Elgin, IL-IN-WI | 90 | 0.02 | 0.42 | $ 35.42 | $ 73,680 |
| Indianapolis-Carmel-Anderson, IN | 50 | 0.05 | 1.00 | $ 34.42 | $ 71,590 |
| Albany-Schenectady-Troy, NY | 30 | 0.08 | 1.65 | $ 33.92 | $ 70,550 |
| Houston-The Woodlands-Sugar Land, TX | 40 | 0.01 | 0.27 | $ 33.39 | $ 69,450 |
| San Antonio-New Braunfels, TX | 30 | 0.03 | 0.65 | $ 32.96 | $ 68,560 |
| Baltimore-Columbia-Towson, MD | 80 | 0.07 | 1.40 | $ 32.40 | $ 67,400 |
| New York-Newark-Jersey City, NY-NJ-PA | 100 | 0.01 | 0.24 | $ 31.47 | $ 65,460 |
| Philadelphia-Camden-Wilmington, PA-NJ-DE-MD | 30 | 0.01 | 0.24 | $ 31.21 | $ 64,920 |
Nonmetropolitan areas with the highest employment in Fish and Game Wardens:
| Nonmetropolitan area | Employment (1) | Employment per thousand jobs | Location quotient (9) | Hourly mean wage | Annual mean wage (2) |
|---|---|---|---|---|---|
| North Florida nonmetropolitan area | 80 | 0.70 | 14.69 | $ 12.81 | $ 26,650 |
| Kansas nonmetropolitan area | 80 | 0.22 | 4.63 | $ 24.93 | $ 51,850 |
| Hill Country Region of Texas nonmetropolitan area | 70 | 0.39 | 8.13 | $ 26.46 | $ 55,040 |
| Capital/Northern New York nonmetropolitan area | 70 | 0.53 | 11.17 | $ 33.59 | $ 69,870 |
| Arizona nonmetropolitan area | 60 | 0.64 | 13.44 | $ 18.86 | $ 39,230 |
Nonmetropolitan areas with the highest concentration of jobs and location quotients in Fish and Game Wardens:
| Nonmetropolitan area | Employment (1) | Employment per thousand jobs | Location quotient (9) | Hourly mean wage | Annual mean wage (2) |
|---|---|---|---|---|---|
| West South Dakota nonmetropolitan area | 50 | 0.81 | 16.95 | $ 21.46 | $ 44,640 |
| North Florida nonmetropolitan area | 80 | 0.70 | 14.69 | $ 12.81 | $ 26,650 |
| South Florida nonmetropolitan area | 50 | 0.66 | 13.81 | $ 13.86 | $ 28,830 |
| Arizona nonmetropolitan area | 60 | 0.64 | 13.44 | $ 18.86 | $ 39,230 |
| Capital/Northern New York nonmetropolitan area | 70 | 0.53 | 11.17 | $ 33.59 | $ 69,870 |
Top paying nonmetropolitan areas for Fish and Game Wardens:
| Nonmetropolitan area | Employment (1) | Employment per thousand jobs | Location quotient (9) | Hourly mean wage | Annual mean wage (2) |
|---|---|---|---|---|---|
| Southwest New York nonmetropolitan area | 30 | 0.20 | 4.27 | $ 35.19 | $ 73,180 |
| Southern Indiana nonmetropolitan area | 50 | 0.27 | 5.60 | $ 33.86 | $ 70,440 |
| North Central Tennessee nonmetropolitan area | 50 | 0.45 | 9.37 | $ 33.83 | $ 70,370 |
| Capital/Northern New York nonmetropolitan area | 70 | 0.53 | 11.17 | $ 33.59 | $ 69,870 |
| Central East New York nonmetropolitan area | 50 | 0.31 | 6.42 | $ 31.93 | $ 66,410 |
These estimates are calculated with data collected from employers in all industry sectors, all metropolitan and nonmetropolitan areas, and all states and the District of Columbia. The top employment and wage figures are provided above. The complete list is available in the downloadable XLS files.
The percentile wage estimate is the value of a wage below which a certain percent of workers fall. The median wage is the 50th percentile wage estimate—50 percent of workers earn less than the median and 50 percent of workers earn more than the median. More about percentile wages.
(1) Estimates for detailed occupations do not sum to the totals because the totals include occupations not shown separately. Estimates do not include self-employed workers.
(2) Annual wages have been calculated by multiplying the hourly mean wage by a "year-round, full-time" hours figure of 2,080 hours; for those occupations where there is not an hourly wage published, the annual wage has been directly calculated from the reported survey data.
(3) The relative standard error (RSE) is a measure of the reliability of a survey statistic. The smaller the relative standard error, the more precise the estimate.
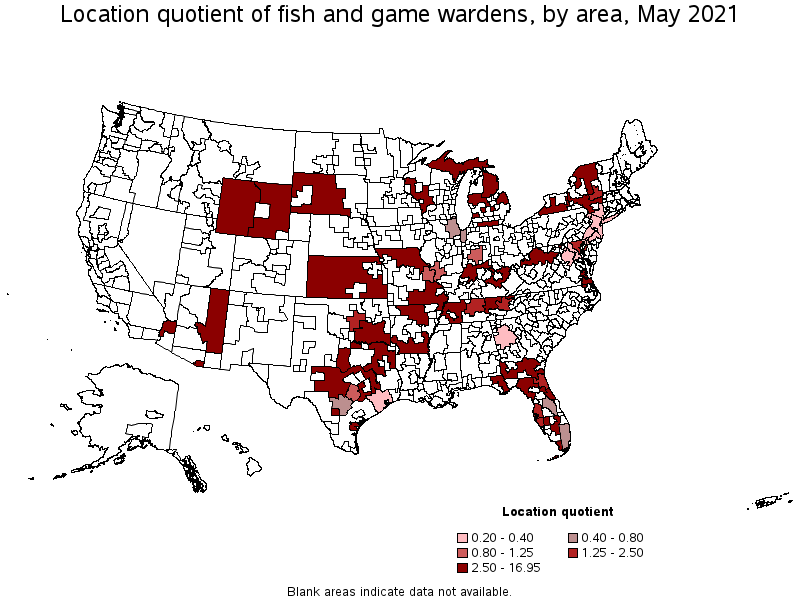
(9) The location quotient is the ratio of the area concentration of occupational employment to the national average concentration. A location quotient greater than one indicates the occupation has a higher share of employment than average, and a location quotient less than one indicates the occupation is less prevalent in the area than average.
Other OEWS estimates and related information:
May 2021 National Occupational Employment and Wage Estimates
May 2021 State Occupational Employment and Wage Estimates
May 2021 Metropolitan and Nonmetropolitan Area Occupational Employment and Wage Estimates
May 2021 National Industry-Specific Occupational Employment and Wage Estimates
Last Modified Date: March 31, 2022