
An official website of the United States government
An official website of the United States government
The .gov means it's official.
Federal government websites often end in .gov or .mil. Before sharing sensitive information,
make sure you're on a federal government site.
The site is secure.
The
https:// ensures that you are connecting to the official website and that any
information you provide is encrypted and transmitted securely.
Prepare and cook large quantities of food for institutions, such as schools, hospitals, or cafeterias.
Employment estimate and mean wage estimates for Cooks, Institution and Cafeteria:
| Employment (1) | Employment RSE (3) |
Mean hourly wage |
Mean annual wage (2) |
Wage RSE (3) |
|---|---|---|---|---|
| 392,860 | 0.7 % | $ 15.15 | $ 31,520 | 0.4 % |
Percentile wage estimates for Cooks, Institution and Cafeteria:
| Percentile | 10% | 25% | 50% (Median) |
75% | 90% |
|---|---|---|---|---|---|
| Hourly Wage | $ 10.65 | $ 11.78 | $ 14.38 | $ 17.67 | $ 21.14 |
| Annual Wage (2) | $ 22,140 | $ 24,500 | $ 29,910 | $ 36,760 | $ 43,980 |
Industries with the highest published employment and wages for Cooks, Institution and Cafeteria are provided. For a list of all industries with employment in Cooks, Institution and Cafeteria, see the Create Customized Tables function.
Industries with the highest levels of employment in Cooks, Institution and Cafeteria:
| Industry | Employment (1) | Percent of industry employment | Hourly mean wage | Annual mean wage (2) |
|---|---|---|---|---|
| Elementary and Secondary Schools | 127,350 | 1.57 | $ 13.87 | $ 28,850 |
| Special Food Services | 52,250 | 11.03 | $ 15.71 | $ 32,690 |
| Nursing Care Facilities (Skilled Nursing Facilities) | 44,940 | 3.19 | $ 14.74 | $ 30,650 |
| Continuing Care Retirement Communities and Assisted Living Facilities for the Elderly | 42,600 | 4.78 | $ 15.54 | $ 32,320 |
| General Medical and Surgical Hospitals | 31,690 | 0.57 | $ 17.55 | $ 36,500 |
Industries with the highest concentration of employment in Cooks, Institution and Cafeteria:
| Industry | Employment (1) | Percent of industry employment | Hourly mean wage | Annual mean wage (2) |
|---|---|---|---|---|
| Special Food Services | 52,250 | 11.03 | $ 15.71 | $ 32,690 |
| Rooming and Boarding Houses | 440 | 4.95 | $ 15.60 | $ 32,440 |
| Continuing Care Retirement Communities and Assisted Living Facilities for the Elderly | 42,600 | 4.78 | $ 15.54 | $ 32,320 |
| Nursing Care Facilities (Skilled Nursing Facilities) | 44,940 | 3.19 | $ 14.74 | $ 30,650 |
| Child Day Care Services | 17,520 | 2.18 | $ 13.22 | $ 27,500 |
Top paying industries for Cooks, Institution and Cafeteria:
| Industry | Employment (1) | Percent of industry employment | Hourly mean wage | Annual mean wage (2) |
|---|---|---|---|---|
| Highway, Street, and Bridge Construction | (8) | (8) | $ 23.70 | $ 49,290 |
| Federal Executive Branch (OEWS Designation) | 2,700 | 0.13 | $ 22.79 | $ 47,400 |
| Securities, Commodity Contracts, and Other Financial Investments and Related Activities | 40 | (7) | $ 20.43 | $ 42,490 |
| Inland Water Transportation | 50 | 0.22 | $ 20.32 | $ 42,260 |
| Deep Sea, Coastal, and Great Lakes Water Transportation | 120 | 0.36 | $ 19.66 | $ 40,900 |
States and areas with the highest published employment, location quotients, and wages for Cooks, Institution and Cafeteria are provided. For a list of all areas with employment in Cooks, Institution and Cafeteria, see the Create Customized Tables function.
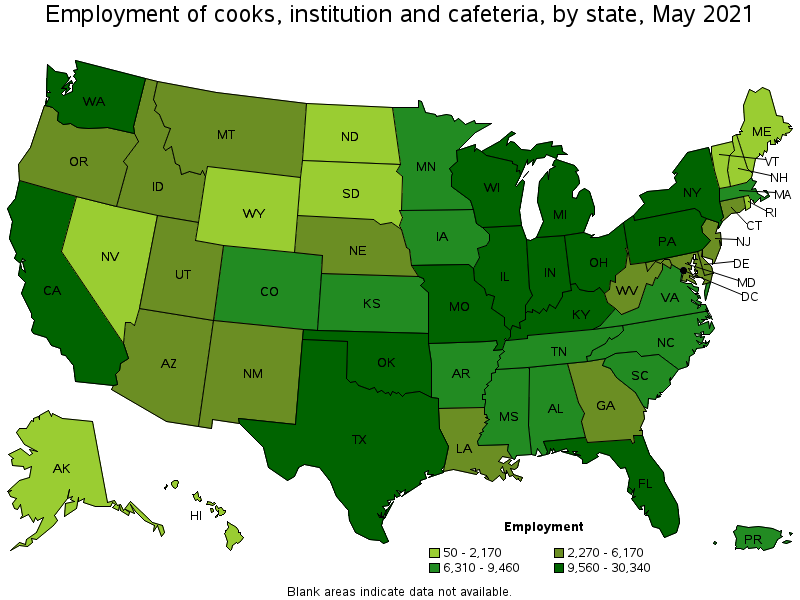
States with the highest employment level in Cooks, Institution and Cafeteria:
| State | Employment (1) | Employment per thousand jobs | Location quotient (9) | Hourly mean wage | Annual mean wage (2) |
|---|---|---|---|---|---|
| Texas | 30,340 | 2.48 | 0.89 | $ 13.58 | $ 28,250 |
| Ohio | 23,470 | 4.51 | 1.62 | $ 14.52 | $ 30,190 |
| Florida | 22,400 | 2.60 | 0.93 | $ 13.93 | $ 28,980 |
| California | 19,560 | 1.18 | 0.42 | $ 19.97 | $ 41,530 |
| Illinois | 17,690 | 3.15 | 1.13 | $ 14.79 | $ 30,770 |
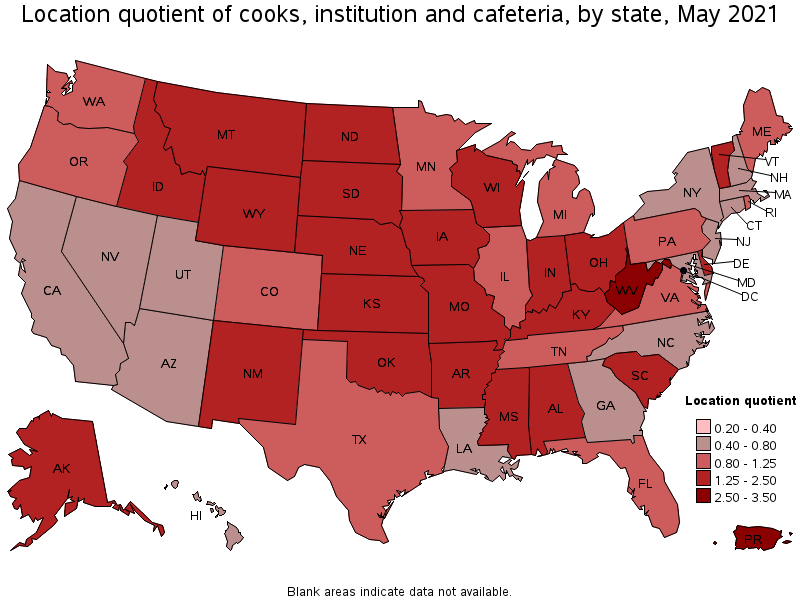
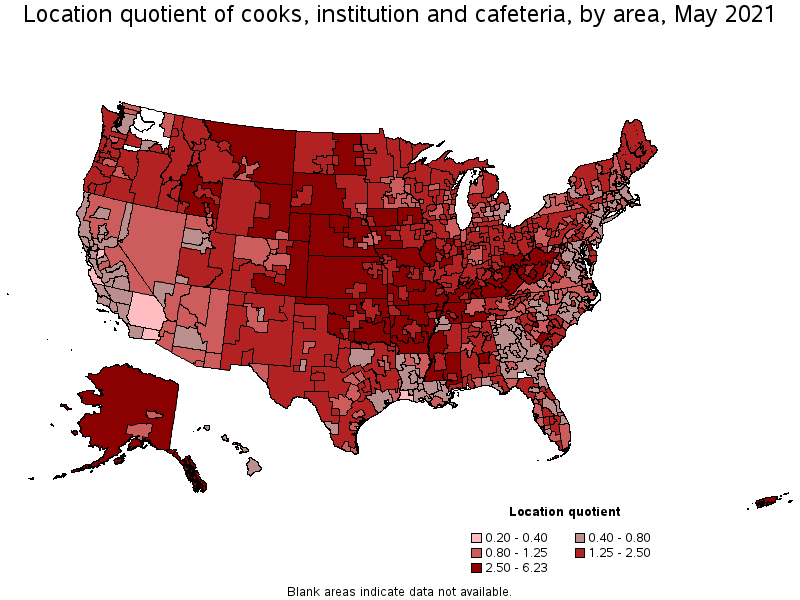
States with the highest concentration of jobs and location quotients in Cooks, Institution and Cafeteria:
| State | Employment (1) | Employment per thousand jobs | Location quotient (9) | Hourly mean wage | Annual mean wage (2) |
|---|---|---|---|---|---|
| West Virginia | 4,970 | 7.56 | 2.71 | $ 13.04 | $ 27,130 |
| Oklahoma | 10,610 | 6.81 | 2.44 | $ 12.10 | $ 25,160 |
| Arkansas | 7,930 | 6.66 | 2.39 | $ 12.19 | $ 25,350 |
| Kentucky | 11,460 | 6.24 | 2.24 | $ 13.33 | $ 27,720 |
| Mississippi | 6,440 | 5.84 | 2.10 | $ 10.63 | $ 22,120 |
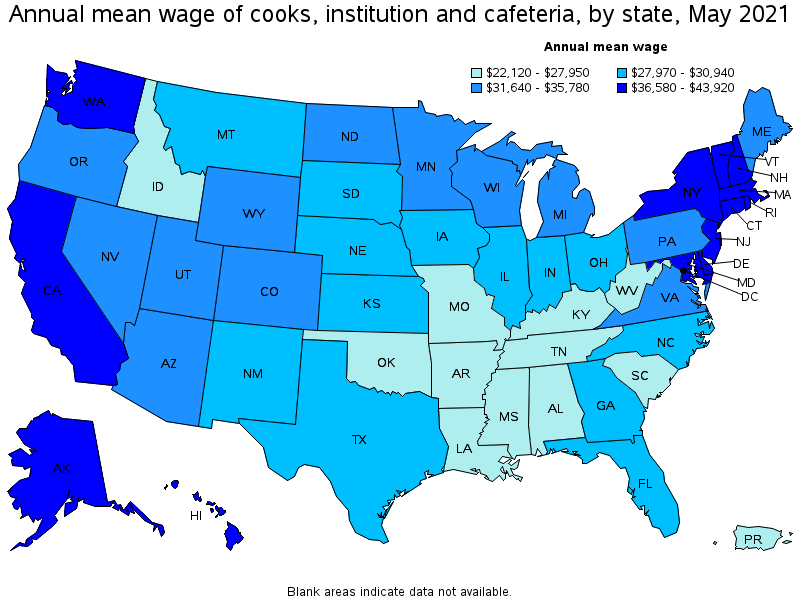
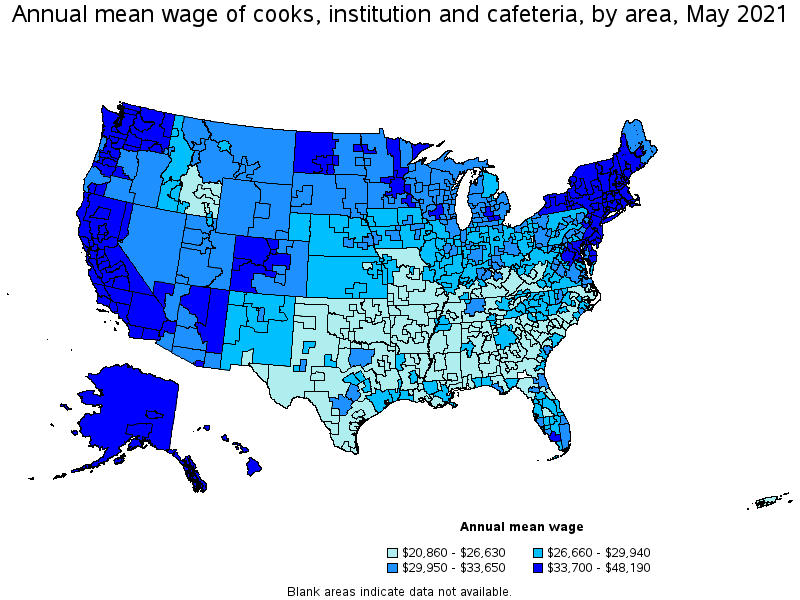
Top paying states for Cooks, Institution and Cafeteria:
| State | Employment (1) | Employment per thousand jobs | Location quotient (9) | Hourly mean wage | Annual mean wage (2) |
|---|---|---|---|---|---|
| Hawaii | 730 | 1.34 | 0.48 | $ 21.12 | $ 43,920 |
| Alaska | 1,370 | 4.63 | 1.66 | $ 20.96 | $ 43,610 |
| Massachusetts | 6,310 | 1.86 | 0.67 | $ 20.89 | $ 43,440 |
| California | 19,560 | 1.18 | 0.42 | $ 19.97 | $ 41,530 |
| Washington | 10,890 | 3.40 | 1.22 | $ 19.88 | $ 41,350 |
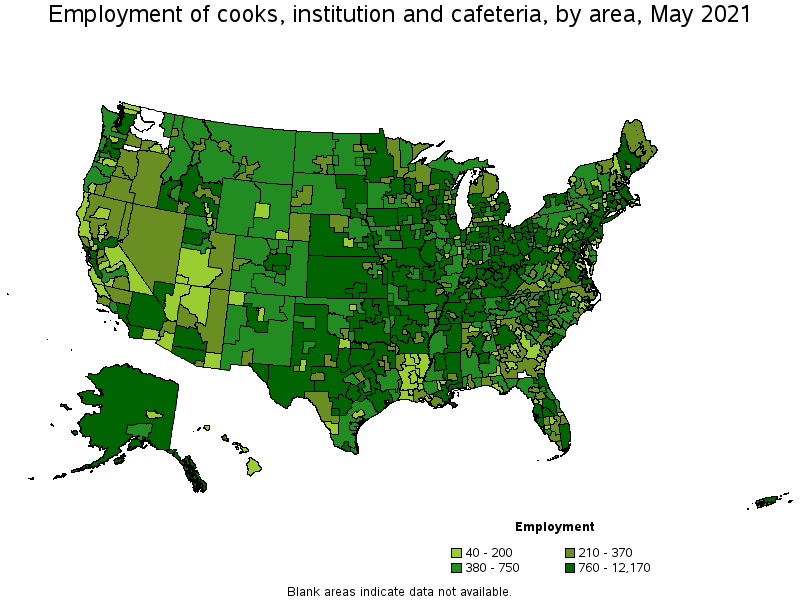
Metropolitan areas with the highest employment level in Cooks, Institution and Cafeteria:
| Metropolitan area | Employment (1) | Employment per thousand jobs | Location quotient (9) | Hourly mean wage | Annual mean wage (2) |
|---|---|---|---|---|---|
| New York-Newark-Jersey City, NY-NJ-PA | 12,170 | 1.40 | 0.50 | $ 20.50 | $ 42,630 |
| Chicago-Naperville-Elgin, IL-IN-WI | 10,820 | 2.56 | 0.92 | $ 15.46 | $ 32,160 |
| Philadelphia-Camden-Wilmington, PA-NJ-DE-MD | 6,760 | 2.55 | 0.91 | $ 16.85 | $ 35,050 |
| Dallas-Fort Worth-Arlington, TX | 6,550 | 1.82 | 0.65 | $ 14.40 | $ 29,950 |
| Los Angeles-Long Beach-Anaheim, CA | 6,320 | 1.11 | 0.40 | $ 19.69 | $ 40,950 |
| Houston-The Woodlands-Sugar Land, TX | 6,210 | 2.14 | 0.77 | $ 13.95 | $ 29,010 |
| St. Louis, MO-IL | 5,960 | 4.67 | 1.67 | $ 13.88 | $ 28,870 |
| Miami-Fort Lauderdale-West Palm Beach, FL | 5,950 | 2.42 | 0.87 | $ 14.45 | $ 30,060 |
| Portland-Vancouver-Hillsboro, OR-WA | 5,760 | 5.13 | 1.84 | $ 19.48 | $ 40,520 |
| Washington-Arlington-Alexandria, DC-VA-MD-WV | 4,980 | 1.70 | 0.61 | $ 18.28 | $ 38,020 |
Metropolitan areas with the highest concentration of jobs and location quotients in Cooks, Institution and Cafeteria:
| Metropolitan area | Employment (1) | Employment per thousand jobs | Location quotient (9) | Hourly mean wage | Annual mean wage (2) |
|---|---|---|---|---|---|
| Huntington-Ashland, WV-KY-OH | 1,040 | 8.37 | 3.00 | $ 13.06 | $ 27,170 |
| Bowling Green, KY | 600 | 8.37 | 3.00 | $ 12.66 | $ 26,340 |
| Weirton-Steubenville, WV-OH | 300 | 8.34 | 2.99 | $ 12.78 | $ 26,590 |
| Montgomery, AL | 1,240 | 8.05 | 2.89 | $ 10.03 | $ 20,860 |
| Dover, DE | 480 | 7.51 | 2.69 | $ 17.69 | $ 36,790 |
| Danville, IL | 190 | 7.42 | 2.66 | $ 14.07 | $ 29,260 |
| Owensboro, KY | 370 | 7.37 | 2.64 | $ 13.20 | $ 27,460 |
| Fort Smith, AR-OK | 750 | 7.34 | 2.63 | $ 11.24 | $ 23,380 |
| Beckley, WV | 280 | 7.13 | 2.56 | $ 12.49 | $ 25,970 |
| Pine Bluff, AR | 210 | 7.04 | 2.53 | $ 12.25 | $ 25,470 |
Top paying metropolitan areas for Cooks, Institution and Cafeteria:
| Metropolitan area | Employment (1) | Employment per thousand jobs | Location quotient (9) | Hourly mean wage | Annual mean wage (2) |
|---|---|---|---|---|---|
| San Jose-Sunnyvale-Santa Clara, CA | 1,220 | 1.14 | 0.41 | $ 23.14 | $ 48,130 |
| San Francisco-Oakland-Hayward, CA | 2,580 | 1.15 | 0.41 | $ 22.79 | $ 47,400 |
| Kahului-Wailuku-Lahaina, HI | 70 | 1.12 | 0.40 | $ 22.60 | $ 47,000 |
| Fairbanks, AK | 100 | 2.81 | 1.01 | $ 22.02 | $ 45,800 |
| Napa, CA | 100 | 1.42 | 0.51 | $ 21.75 | $ 45,240 |
| Hanford-Corcoran, CA | 60 | 1.50 | 0.54 | $ 21.55 | $ 44,820 |
| Boston-Cambridge-Nashua, MA-NH | 4,440 | 1.72 | 0.62 | $ 21.43 | $ 44,570 |
| Barnstable Town, MA | 200 | 2.11 | 0.76 | $ 21.13 | $ 43,940 |
| Vallejo-Fairfield, CA | 170 | 1.33 | 0.48 | $ 21.03 | $ 43,740 |
| Seattle-Tacoma-Bellevue, WA | 3,970 | 2.07 | 0.74 | $ 20.88 | $ 43,440 |
Nonmetropolitan areas with the highest employment in Cooks, Institution and Cafeteria:
| Nonmetropolitan area | Employment (1) | Employment per thousand jobs | Location quotient (9) | Hourly mean wage | Annual mean wage (2) |
|---|---|---|---|---|---|
| Kansas nonmetropolitan area | 2,840 | 7.57 | 2.72 | $ 12.90 | $ 26,840 |
| North Northeastern Ohio nonmetropolitan area (noncontiguous) | 1,890 | 6.01 | 2.15 | $ 13.31 | $ 27,670 |
| Southeast Missouri nonmetropolitan area | 1,700 | 10.77 | 3.86 | $ 12.03 | $ 25,010 |
| West Northwestern Ohio nonmetropolitan area | 1,560 | 6.49 | 2.33 | $ 13.70 | $ 28,490 |
| Central Missouri nonmetropolitan area | 1,440 | 9.38 | 3.36 | $ 12.49 | $ 25,980 |
Nonmetropolitan areas with the highest concentration of jobs and location quotients in Cooks, Institution and Cafeteria:
| Nonmetropolitan area | Employment (1) | Employment per thousand jobs | Location quotient (9) | Hourly mean wage | Annual mean wage (2) |
|---|---|---|---|---|---|
| East Kentucky nonmetropolitan area | 1,280 | 13.37 | 4.79 | $ 11.62 | $ 24,160 |
| Southeast Missouri nonmetropolitan area | 1,700 | 10.77 | 3.86 | $ 12.03 | $ 25,010 |
| Southern West Virginia nonmetropolitan area | 720 | 10.76 | 3.86 | $ 12.28 | $ 25,540 |
| Southwest Oklahoma nonmetropolitan area | 600 | 10.37 | 3.72 | $ 10.84 | $ 22,550 |
| South Arkansas nonmetropolitan area | 920 | 10.11 | 3.63 | $ 11.91 | $ 24,770 |
Top paying nonmetropolitan areas for Cooks, Institution and Cafeteria:
| Nonmetropolitan area | Employment (1) | Employment per thousand jobs | Location quotient (9) | Hourly mean wage | Annual mean wage (2) |
|---|---|---|---|---|---|
| Hawaii / Kauai nonmetropolitan area | 150 | 1.69 | 0.61 | $ 23.17 | $ 48,190 |
| Alaska nonmetropolitan area | 760 | 7.77 | 2.79 | $ 21.04 | $ 43,760 |
| Massachusetts nonmetropolitan area | 190 | 3.26 | 1.17 | $ 20.34 | $ 42,310 |
| North Valley-Northern Mountains Region of California nonmetropolitan area | 290 | 2.97 | 1.07 | $ 19.41 | $ 40,370 |
| Western Washington nonmetropolitan area | 490 | 4.09 | 1.47 | $ 19.27 | $ 40,070 |
These estimates are calculated with data collected from employers in all industry sectors, all metropolitan and nonmetropolitan areas, and all states and the District of Columbia. The top employment and wage figures are provided above. The complete list is available in the downloadable XLS files.
The percentile wage estimate is the value of a wage below which a certain percent of workers fall. The median wage is the 50th percentile wage estimate—50 percent of workers earn less than the median and 50 percent of workers earn more than the median. More about percentile wages.
(1) Estimates for detailed occupations do not sum to the totals because the totals include occupations not shown separately. Estimates do not include self-employed workers.
(2) Annual wages have been calculated by multiplying the hourly mean wage by a "year-round, full-time" hours figure of 2,080 hours; for those occupations where there is not an hourly wage published, the annual wage has been directly calculated from the reported survey data.
(3) The relative standard error (RSE) is a measure of the reliability of a survey statistic. The smaller the relative standard error, the more precise the estimate.
(7) The value is less than .005 percent of industry employment.
(8) Estimate not released.
(9) The location quotient is the ratio of the area concentration of occupational employment to the national average concentration. A location quotient greater than one indicates the occupation has a higher share of employment than average, and a location quotient less than one indicates the occupation is less prevalent in the area than average.
Other OEWS estimates and related information:
May 2021 National Occupational Employment and Wage Estimates
May 2021 State Occupational Employment and Wage Estimates
May 2021 Metropolitan and Nonmetropolitan Area Occupational Employment and Wage Estimates
May 2021 National Industry-Specific Occupational Employment and Wage Estimates
Last Modified Date: March 31, 2022